Generating a browser HAR file for Kibana troubleshooting
.jpg)

 Share on Twitter
Share on Twitter

 Share on LinkedIn
Share on LinkedIn

 Share on Facebook
Share on Facebook

 Share by Email
Share by Email

 Print this page
Print
Elastic support and developers frequently request web browser HAR files from users in order to problem box stack issues between Kibana’s UI — either Kibana’s API or Elasticsearch’s API — and Elasticsearch’s database. Below, we’ll contextualize why HAR files are helpful for troubleshooting and outline how to successfully capture them.
Caveats for repeat visitors:
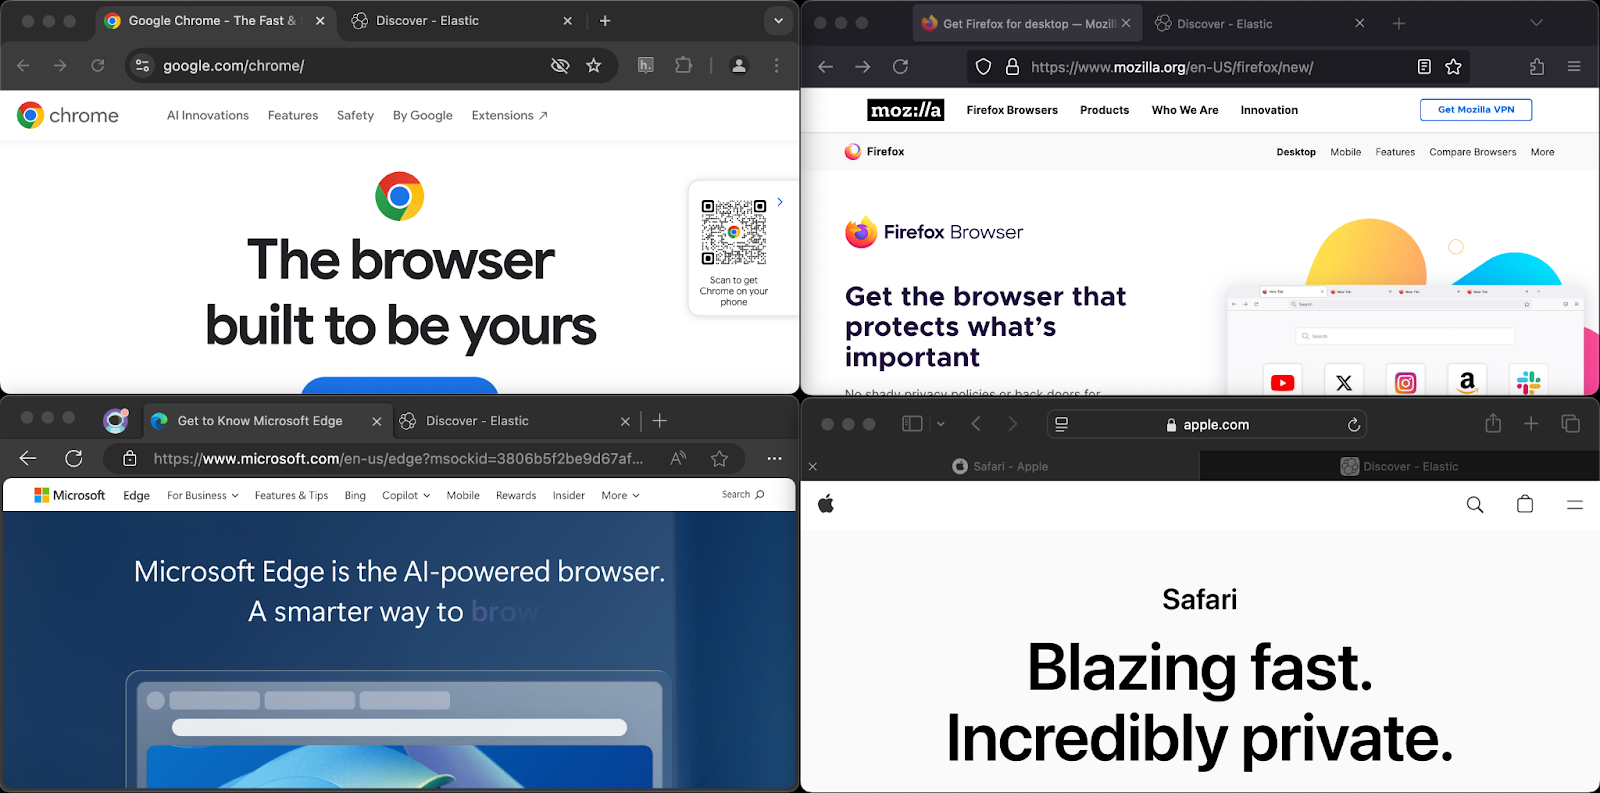
- Reproduce the issue in an incognito window from the latest version of one of the following major web browsers: Chrome, Firefox, Edge Chromium, or Safari.
- Capturing user should have the Elasticsearch security role:superuser, or multiple captures should be gathered to show the changing experience resulting from permission differences.
- Make sure to perform a browser page hard refresh to avoid caching and capture all network activity.
- Sanitize sensitive data as needed from the resulting .har JSON file.
Background
Elasticsearch exposes REST API endpoints that can both be called directly and used by the Kibana server to render its UI components. Kibana supports the latest generally available version of the most popular internet web browsers: Firefox, Edge Chromium, Chrome, and Safari.
Websites and apps are usually structured to receive and respond to requests via a stacked formation of database, backend, API, and frontend UI elements. The joint Kibana and Elasticsearch experience follows this model. Therefore, like other websites, it is possible that errors surfacing in Kibana may reflect either single-layer issues, such as database issues like CircuitBreakingException, API issues like malformed request JSON, or UI issues like a JavaScript page crash, or interlayer performance problems like mapping explosion as discussed in troubleshooting Discover load.
When troubleshooting a stack issue, one of the first steps is to problem box its symptoms to both its affected and inducing layers. For our most recent example, mapping explosion occurs within the Elasticsearch database’s index mapping and surfaces both via its mapping API and field capabilities API, where the latter is incorporated as part of Kibana loading Discover and therefore surfacing symptoms at Discover’s load time. The affected layer spreads across the stack, but the inducing layer is from within the database. However, users may only initially notice symptoms upon loading Kibana as their most frequent access point, so it’s important to know how to distinguish the problem’s inducing layers from its affected layers.
What is a HAR log?
Internet website pages load raw backend data (usually via HTML, JSON, and/or XML) through browser network sockets/API and extend this raw data to make it both presentable (usually via CSS) and interactive (commonly through JavaScript). The Kibana website experience follows this model.
All major browsers allow users to inspect a web page loading through their developer tools, specifically the browser’s network tabs that log its socket/API activity. For information for each browser, refer to its network tool’s guide: Chrome, Firefox, Safari (after enabling), and Edge Chromium.
Inspecting a browser’s network tab enables users to differentiate when the website UI is only surfacing a backend API or database error from instigating the error itself. This is a necessary step toward diagnosing novel situations.
All major browsers’ network tabs follow the HAR (HTTP Archive) traffic log specification, also known as “HAR log.” This specification standardization enables traffic logs to be exported from and imported into any major browser’s network tab, which makes these logs quite useful for diagnostic purposes — both for local testing and to be shared with Elastic to investigate on the user’s behalf.
A HAR log only captures network traffic within the browser’s current tab, so websites that temporarily spin up a new tab — for SSO authentication, for example — will only have the original tab’s traffic captured but not the new subtab’s traffic.
Generate HAR log
Let’s outline generating a HAR log by preparing Kibana, capturing segmented pages per major browser, and then sanitizing sensitive data. Kibana screenshots are captured for latest stack version 8.15.1, but the same conversation generally applies across all versions since 7.9.0.
HAR logs should be captured:
By Elasticsearch admins whose user has security role superuser to avoid permissions issues; however, other users can supplement HAR logs for response comparisons.
In a browser incognito tab to avoid caching issues. To open an incognito window per browser, see Chrome, Firefox, Edge Chromium, and Safari.
Prepare Kibana
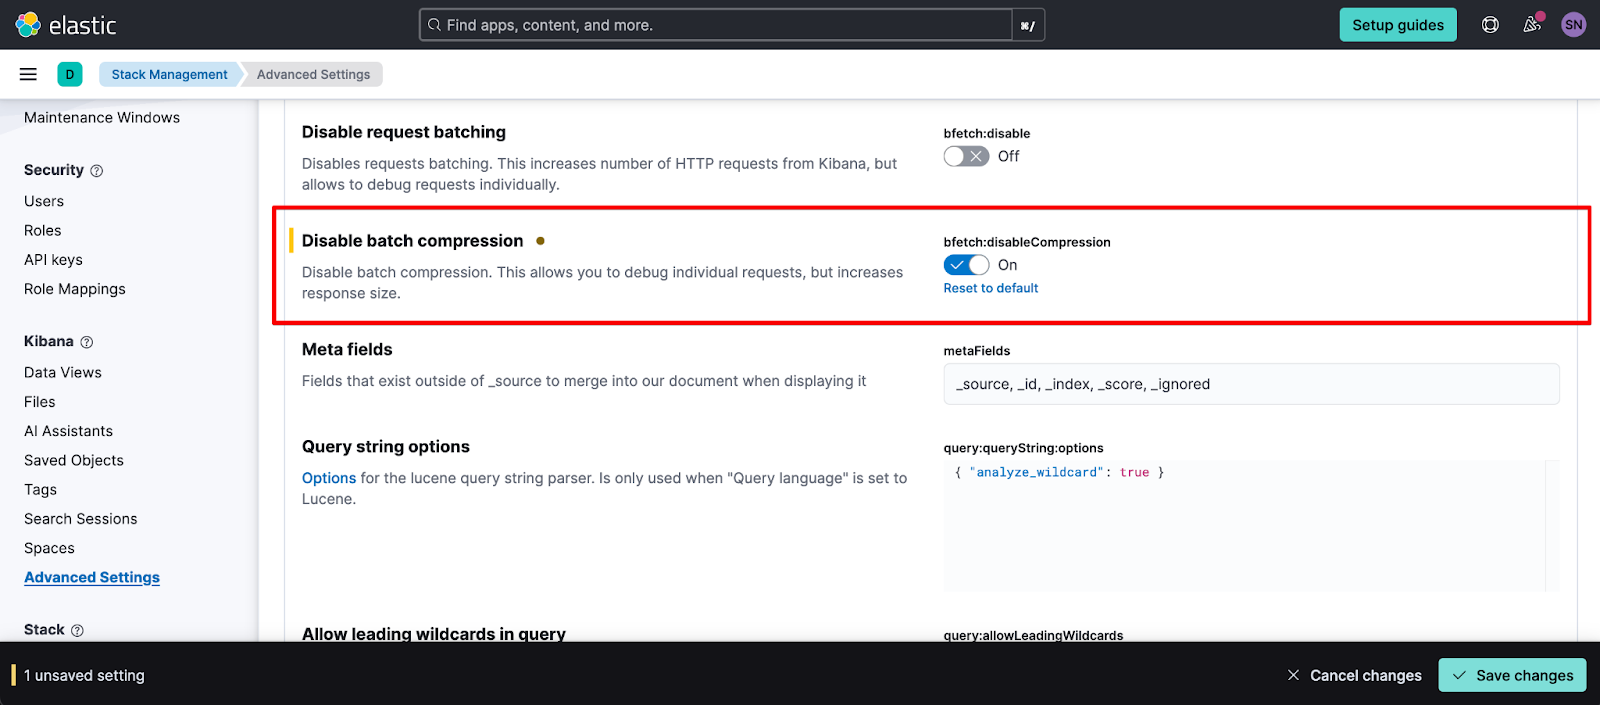
Kibana default optimizes the user experience by compressing network requests and default disabling debugging. We want to temporarily disable these optimizations to further enable network introspection. We recommend resetting these overrides after a HAR log has been captured.
Under Kibana’s Stack Management, navigate to Advanced Settings. In recent stack versions, this can be directly navigated under the URL KIBANA_BASE_URL/app/management/kibana/settings. This page is segmented into advanced settings per Elastic feature where there’s a couple we want to review:
- If troubleshooting the Observability UI, under its section, toggle “Inspect ES queries” (observability:enableInspectEsQueries) to “on.”
If users are investigating missing response data per Kibana solution and/or feature, they may want to confirm expected index patterns:
For Observability, “Logs Explorer allowed data views” (observability:logsExplorer:allowedDataViews) or “Logs index pattern” (observability:aiAssistantLogsIndexPattern)
For Security, “Elasticsearch indices” (securitySolution:defaultIndex) or “Threat indices” (securitySolution:defaultThreatIndex)
If toggling one of these settings changes the problem’s symptoms, we recommend capturing two HAR logs — one with setting at default and one when overrode.
Once applicable settings are overrode, navigate to either the problematic Kibana page or the first page in the sequence to be demonstrated.
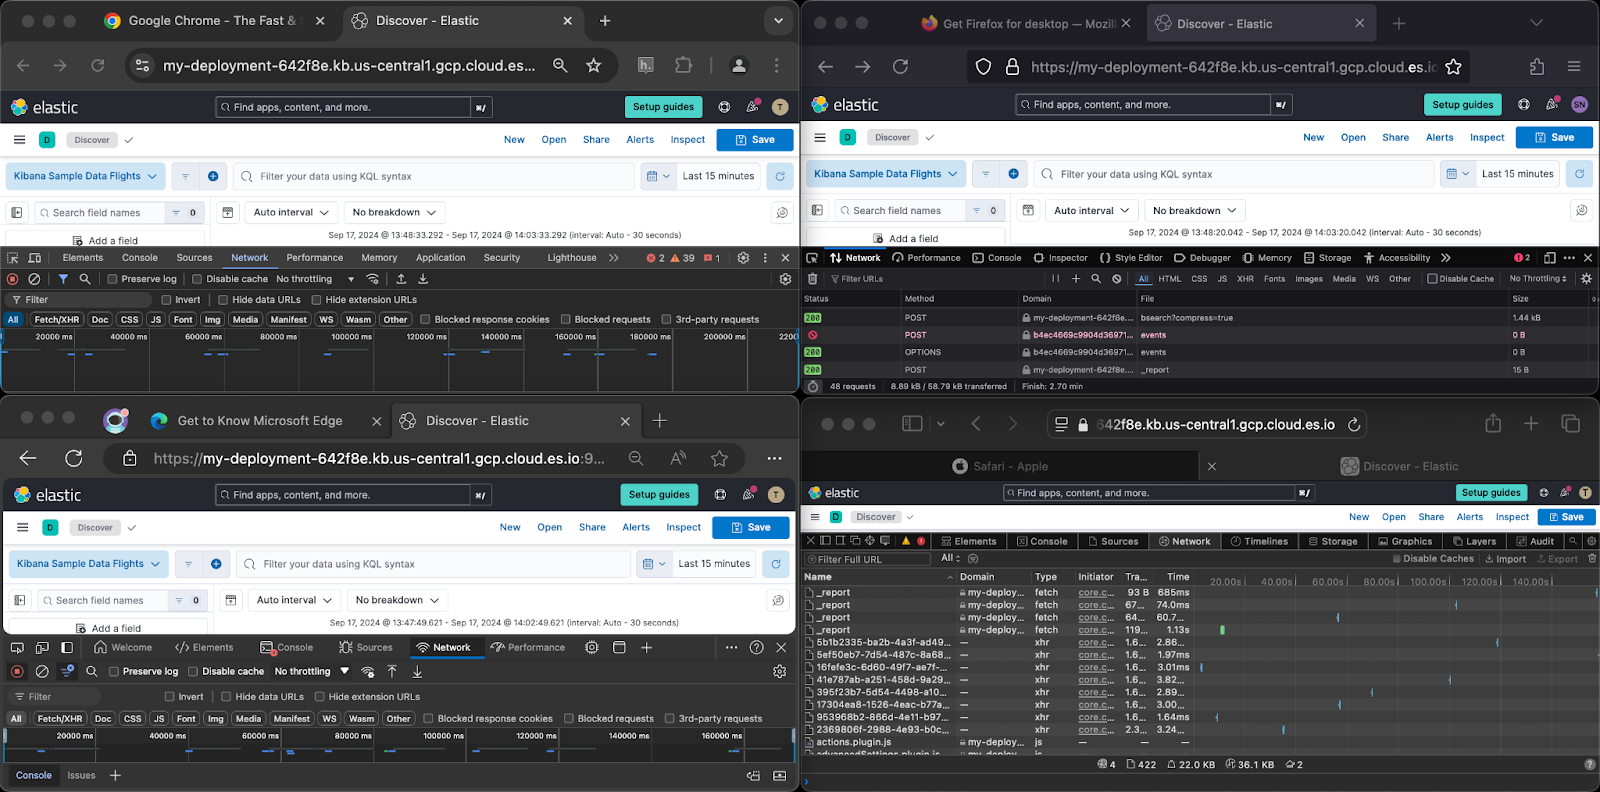
Open network tab
Major web browser tooling has a standardized flow to capture HAR logs. Here, we’ll outline the flow at a high level, but for browser specific information, refer to their direct guides: Chrome, Firefox, Safari, and Edge Chromium. For Safari, note that it first requires enabling its developer tools.
First, let’s open the browser developer tools and navigate to the network tab. All four browsers support opening their developer tools via keyboard hotkey: CMD+OPT+I on Mac and CTRL+SHIFT+I for Windows. Alternatively, users can open developer tools using these steps for each browser:
Chrome: Top-right three-vertical-dots menu > More Tools > Developer Tools
Edge: Top-right three-horizontal-dots menu > More Tools > Developer Tools
Firefox: Top-right hamburger menu > More Tools > Web Developer Tools
Safari: Develop > Show Web Inspector
This will open the last tab used under the browser’s developer tool. Navigate to the network tab. For inspection ease, the top-right menu of this sub-menu also allows shifting its docking location; I prefer to host the dock on the bottom of the web page for visibility.
Kindly note, some government employers disable developer tool access. For affected users, neither option will work and the manual navigation will show the last step as a grayed out option. If this situation applies to you without a viable workaround, notify Elastic support who will work with your team to explain the steps necessary to manually gather the same information needed to move forward.
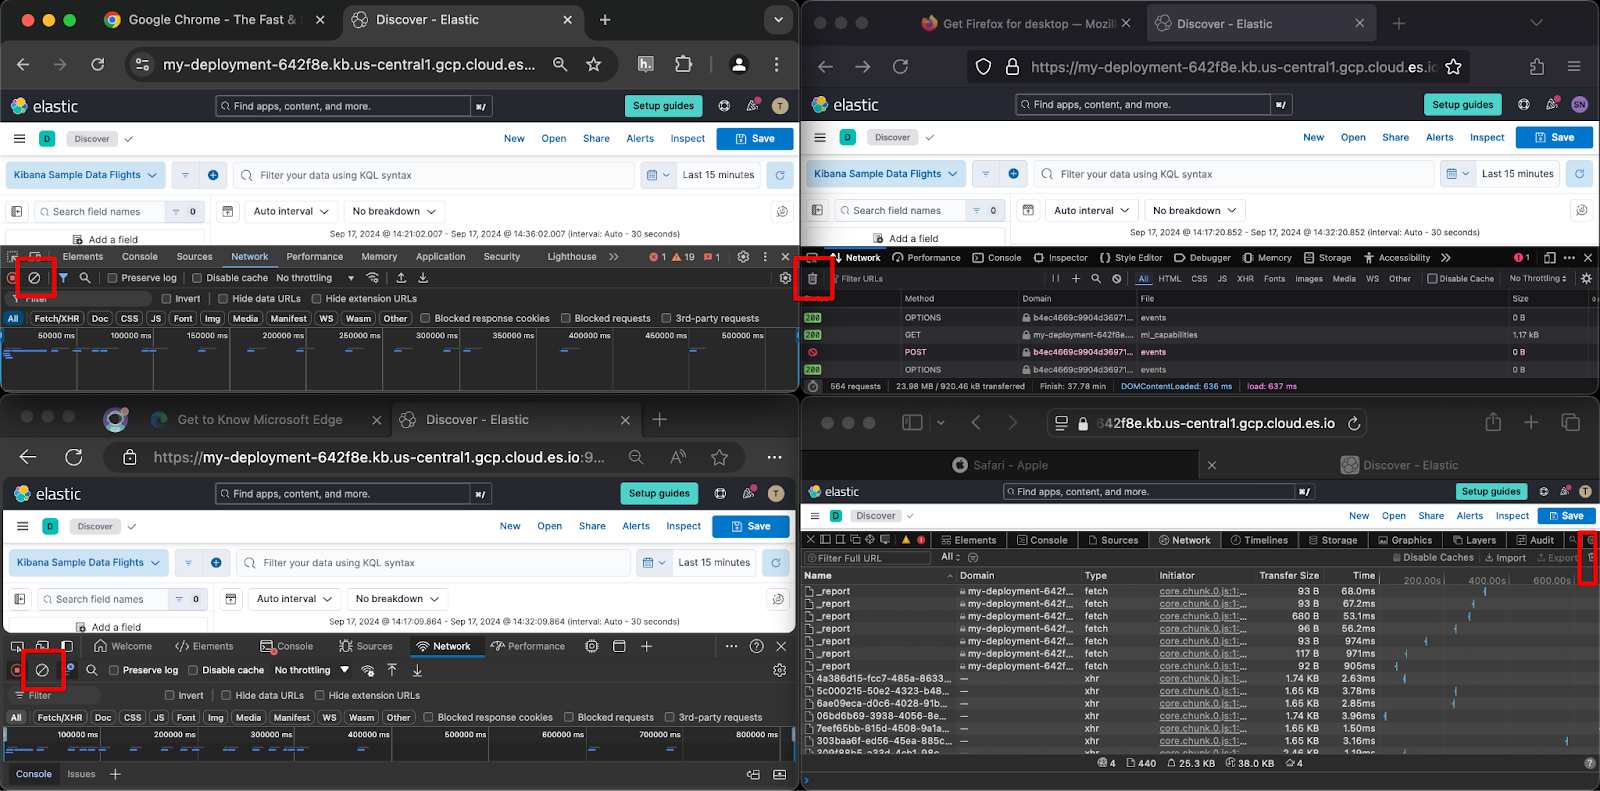
Capture HAR log
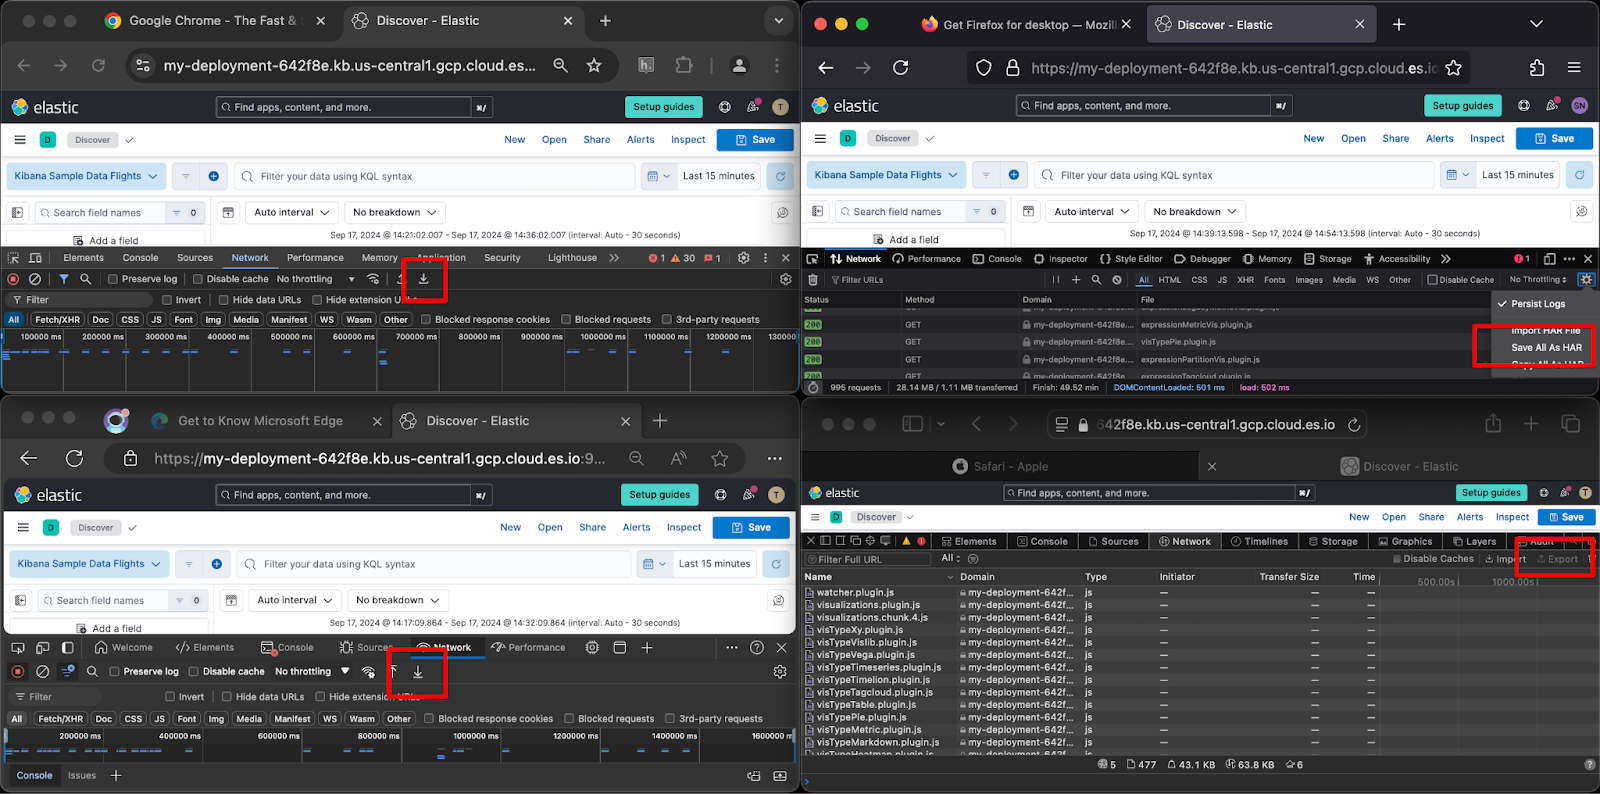
At this point, we’re ready to capture our HAR log. We should be sitting on the page or first page in sequence of the problematic UI we want to demonstrate. In the browser network tab, clear the previous network traffic. This icon will appear as either a stop sign in Chrome and Edge Chromium or a trash can in Firefox and Safari:
For performance optimizations, web browsers cache various Javascript, CSS, and some API response data; therefore, we need to make sure we load our web page after clearing browser cache. To enable this, perform a browser page hard refresh using the browser’s hotkeys:
For Mac users using Chrome, Firefox, and Edge Chromium: CMD+SHIFT+R
For Windows users using Chrome, Firefox, and Edge Chromium: CTRL+SHIFT+R
For Safari: Clear cache using CMD+OPT+E then refresh the page using CMD+R
Alternatively, if hotkeys are not preferred:
For Chrome and Edge Chromium, right-click on the refresh icon and select “Hard Reload.”
For Firefox, follow their guide.
For Safari, follow their community’s guide.
This will refresh the browser page. Do not hard refresh sequential pages. Navigate within Kibana as needed to demonstrate the problem symptoms. As a third alternative, you can temporarily disable your browser tab’s cache altogether.
Once done, export the HAR log to a local .har JSON file. The export functionality will appear as a download icon (Chrome and Edge Chromium), under “Save all as HAR” (Firefox) or “Export” (Safari):
Sanitize sensitive data
By their nature, HAR logs capture whatever sensitive data is loading in the browser tab, including raw, potentially production data returned from the Elasticsearch API or your session cookies.
Private information is strictly handled by Elastic according to our compliance with data protection legal requirements. However, you may still consider redacting sensitive data from the emitted .har JSON file as deemed necessary by your information security team by:
Manually search and replace sensitive strings in your favorite text editor. If manually edited, kindly validate ending .har JSON file via method described below.
- (Recommended) Using a third-party tool like Cloudflare’s HAR sanitation tool (see their related blog for context).
Troubleshoot with locally saved HAR logs
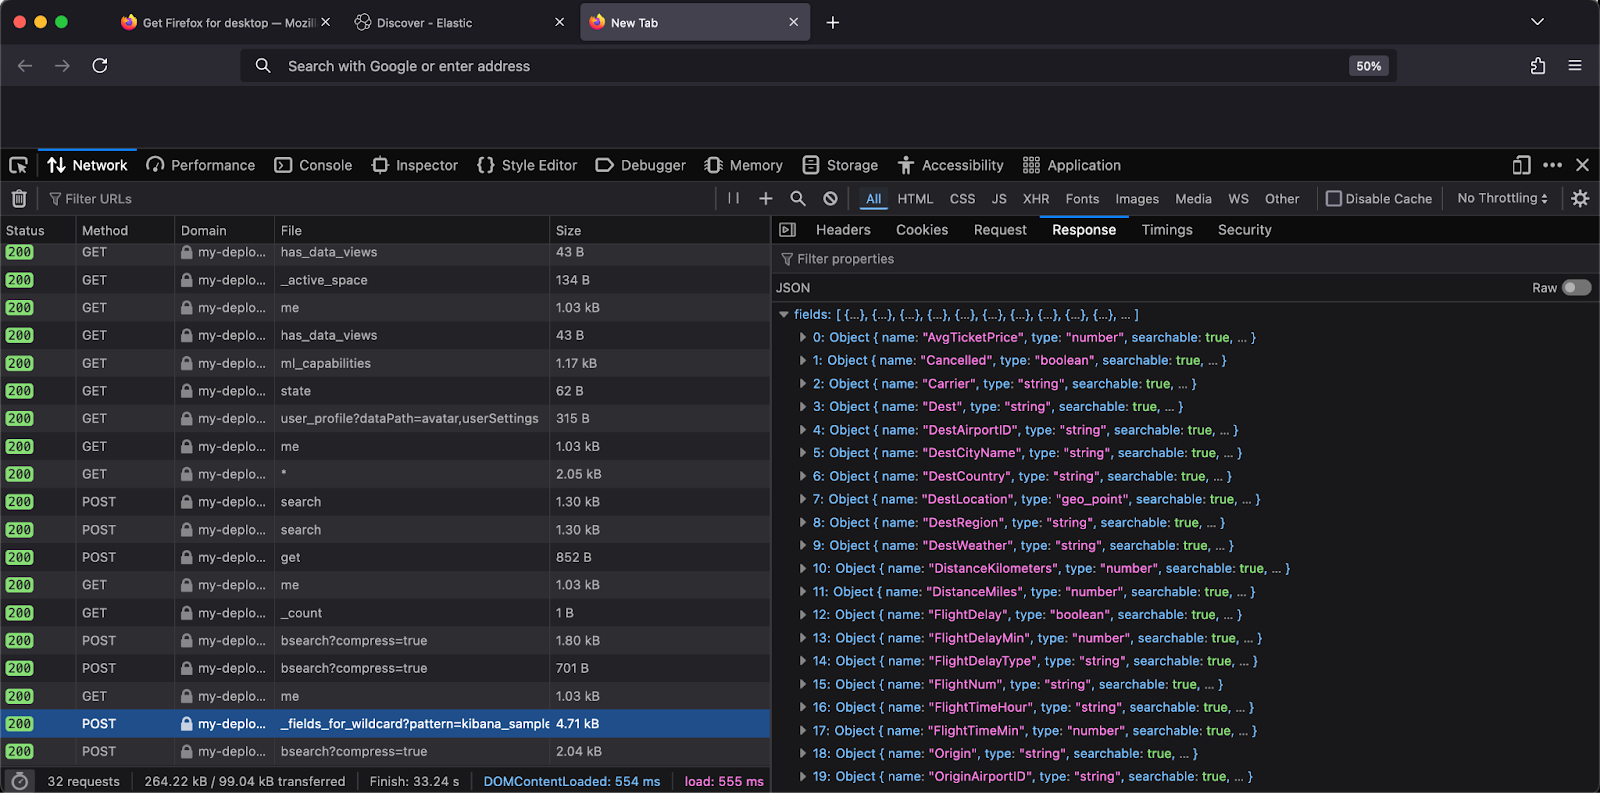
Saved HAR logs can be locally investigated by inspecting their JSON and/or by importing back into a browser’s network tab. Since top browsers follow the HAR log’s specifications, this export can be imported into any major browser’s network tab and not only the originating browser type or version. This enables you to review network timing waterfall charts again as well as API metadata or request and response bodies. I prefer to drag-and-drop a locally saved HAR log into a new browser tab’s developer tools’ network tab as shown below.
If Elastic has requested a HAR log, kindly upload it to your Elastic support case along with a Kibana diagnostic and Elasticsearch diagnostic (pulled including or supplementing their logs) of the same timeframe. In a future blog, we’ll outline some common HAR log examples, so stay tuned!
The release and timing of any features or functionality described in this post remain at Elastic's sole discretion. Any features or functionality not currently available may not be delivered on time or at all.
Share
- Share on Twitter
Share on Twitter
- Share on LinkedIn
Share on LinkedIn
- Share on Facebook
Share on Facebook
- Share by Email
Share by Email
- Print this page
Print