Inventory to insight: How Elastic’s asset inventory powers InfoSec use cases


 Share on Twitter
Share on Twitter

 Share on LinkedIn
Share on LinkedIn

 Share on Facebook
Share on Facebook

 Share by Email
Share by Email

 Print this page
Print
In a previous article, we laid out the basics of building a cybersecurity asset management solution using the Elastic Stack. Today, we're excited to dive into the latest improvements that transformed our solution from a simple inventory of assets to a powerful tool that enables real-world use cases and helps us keep Elastic secure.
Since our last update, our asset inventory has grown significantly, now containing over 1 million individual records and spanning approximately 60 different asset types. Our definition of an asset has expanded from typical categories such as cloud resources, devices, and SaaS applications to include identities, roles, credentials, or GitHub repositories. To enable these real-world use cases and fully leverage the extensive array of assets in our inventory, we need to piece together various capabilities, much like assembling the pieces of a puzzle, to build an integrated solution.
Adopting naming conventions
We've adopted the practice of using many smaller but denser indices rather than a few large ones. By creating a consistent structure in our Elastic data stream naming scheme, we’ve enhanced user experience and streamlined permissions by centralizing the setup of templates and ingest pipelines. This structure involves naming asset indices starting with "asset_", followed by a hierarchy that moves from broad to specific categories. This hierarchical approach reflects the asset type, moving from general categories to specific subtypes, and culminates with the source system or cloud provider. This naming approach allows us to merge indices with similar information originating from different sources.
For instance, workstations managed by different platforms are identified distinctly, such as asset_infrastructure_workstation_jamf for Jamf-managed devices and asset_infrastructure_workstation_intune for those under Intune. Similarly, cloud-based assets like virtual machines are categorized by their environment, such as asset_infrastructure_compute_vm_azure_vm for Azure, asset_infrastructure_compute_vm_aws_ec2 for AWS, and asset_infrastructure_compute_vm_gcp_vm for GCP.
Standardizing metadata and fields
Correlation across data sets is a nearly impossible task if fields are inconsistently named. Inconsistencies can lead to complex queries across multiple fields that all represent the same information (e.g., host.name: “serverA” or host_name: “serverA” or name: “serverA”). Standardizing metadata and fields across different asset classes allows us to normalize asset data for analysis, visualization, and correlation; search across multiple indices using standardized field names; and align with Elastic Common Schema (ECS) to leverage searches that span multiple indices, use predefined dashboards, and machine learning jobs.
We implement ECS by adhering to its standard blueprint for event-based data. Elastic’s integrations and ingestion tools adhere to this standard to provide consistent field names and data types. For data that does not map directly to ECS, we use custom field names. If Elastic integrations are unavailable, we utilize custom ingest pipelines and manually provide the mapping based on the criteria and principles outlined in this article.
| Field name | Naming convention | Example (AWS) | ECS mapping |
| Cloud provider | cloud.provider | aws | Y |
| Account/project/subscription | cloud.project.id, cloud.project.name | Id, Name | Y |
| Cloud region | cloud.region | region.RegionName | Y |
| Cloud location: Virtual private network | cloud.vpc | Vpcld | N/A |
| Owner | cloud.instance.owner | OwnerId | N/A |
Standardizing common metadata across all assets goes beyond the cloud based assets, and we have many cases that require common fields across all assets, which range from continuous control monitoring to detection alerting. Unlike the cloud specific extensions to ECS, which are limited in scope to cloud assets, the asset related fields are present across all asset types and allow us to make correlations and find assets across multiple indices.
Current list of fields we use to enrich assets with additional metadata:
| Field name | Naming convention | Example |
| Asset name | asset.name | <repository name> |
| Asset ID | asset.id | <internal unique id> |
| Asset owner | asset.owner | <team/owner> |
| Asset criticality/data classification | asset.data_classification | ‘restricted' |
| Asset category | asset.category | ‘saas' |
| Asset type | asset.type | ‘github repository’ |
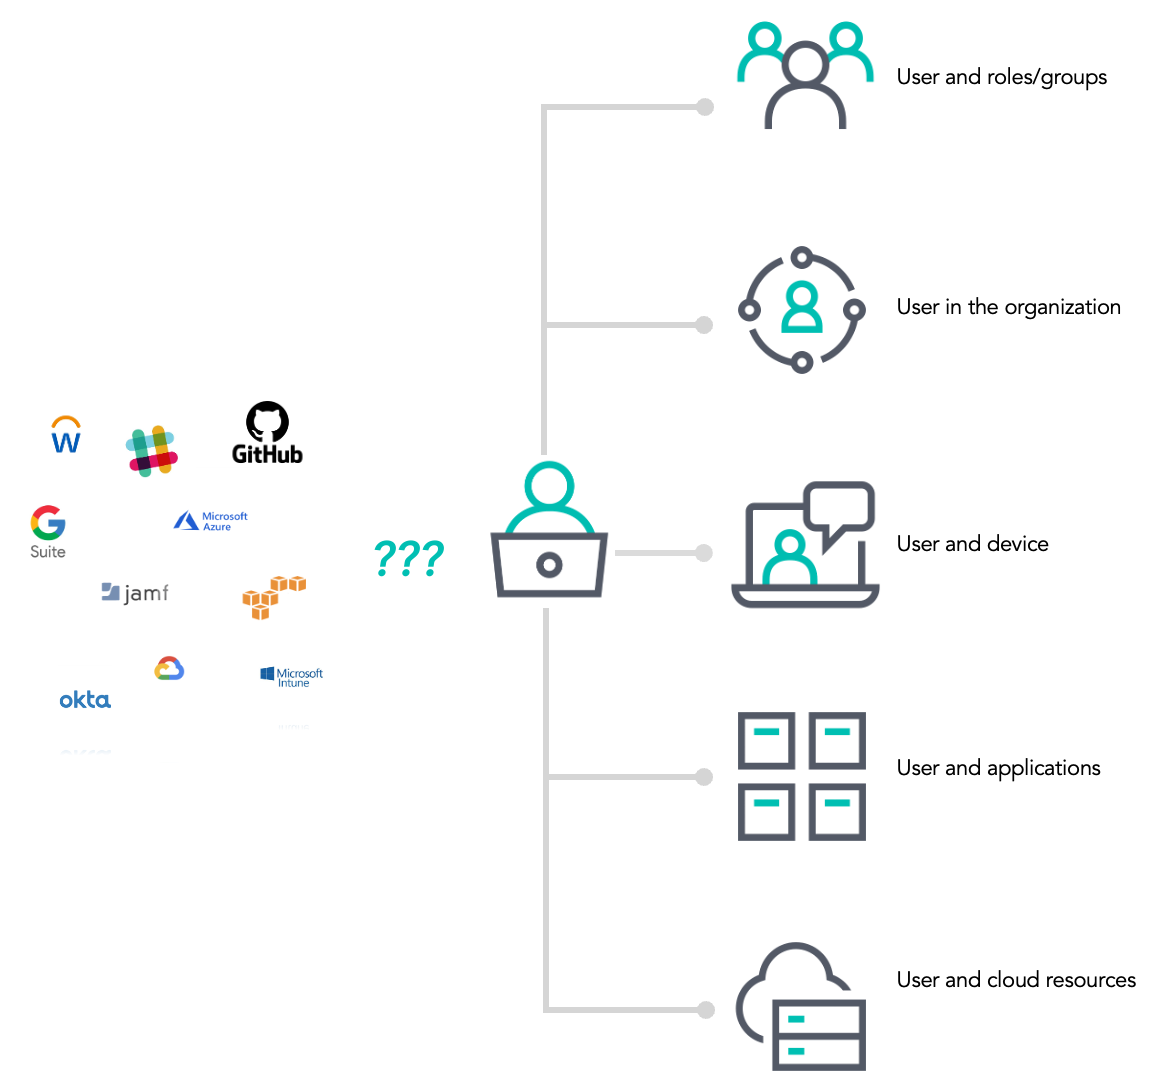
Enriching indices and creating relationships between assets
Enriched indices in Elasticsearch have allowed us to create a comprehensive view of specific assets of interest, where the relevant data typically resides in multiple source systems. This involves integrating various asset-related contexts, such as mapping users to their permissions, roles, and groups within the organization. This process provides a deeper understanding of access levels and potential security risks.
We also link users to the devices they use — whether workstations, mobile devices, or other endpoints — providing a complete picture of user activity across the organization. Enriching user data with information related to the organizational hierarchy helps in identifying specific user roles and understanding the internal structure. Finally, connecting users to the applications they interact with allows us to monitor usage patterns and detect unauthorized access, ensuring a robust security posture.
Our enriched indices facilitate the establishment of relationships between assets, similar in concept to the notion of primary-foreign key relationships in relational databases. This capability enables us to perform complex queries and correlations that would otherwise be challenging.
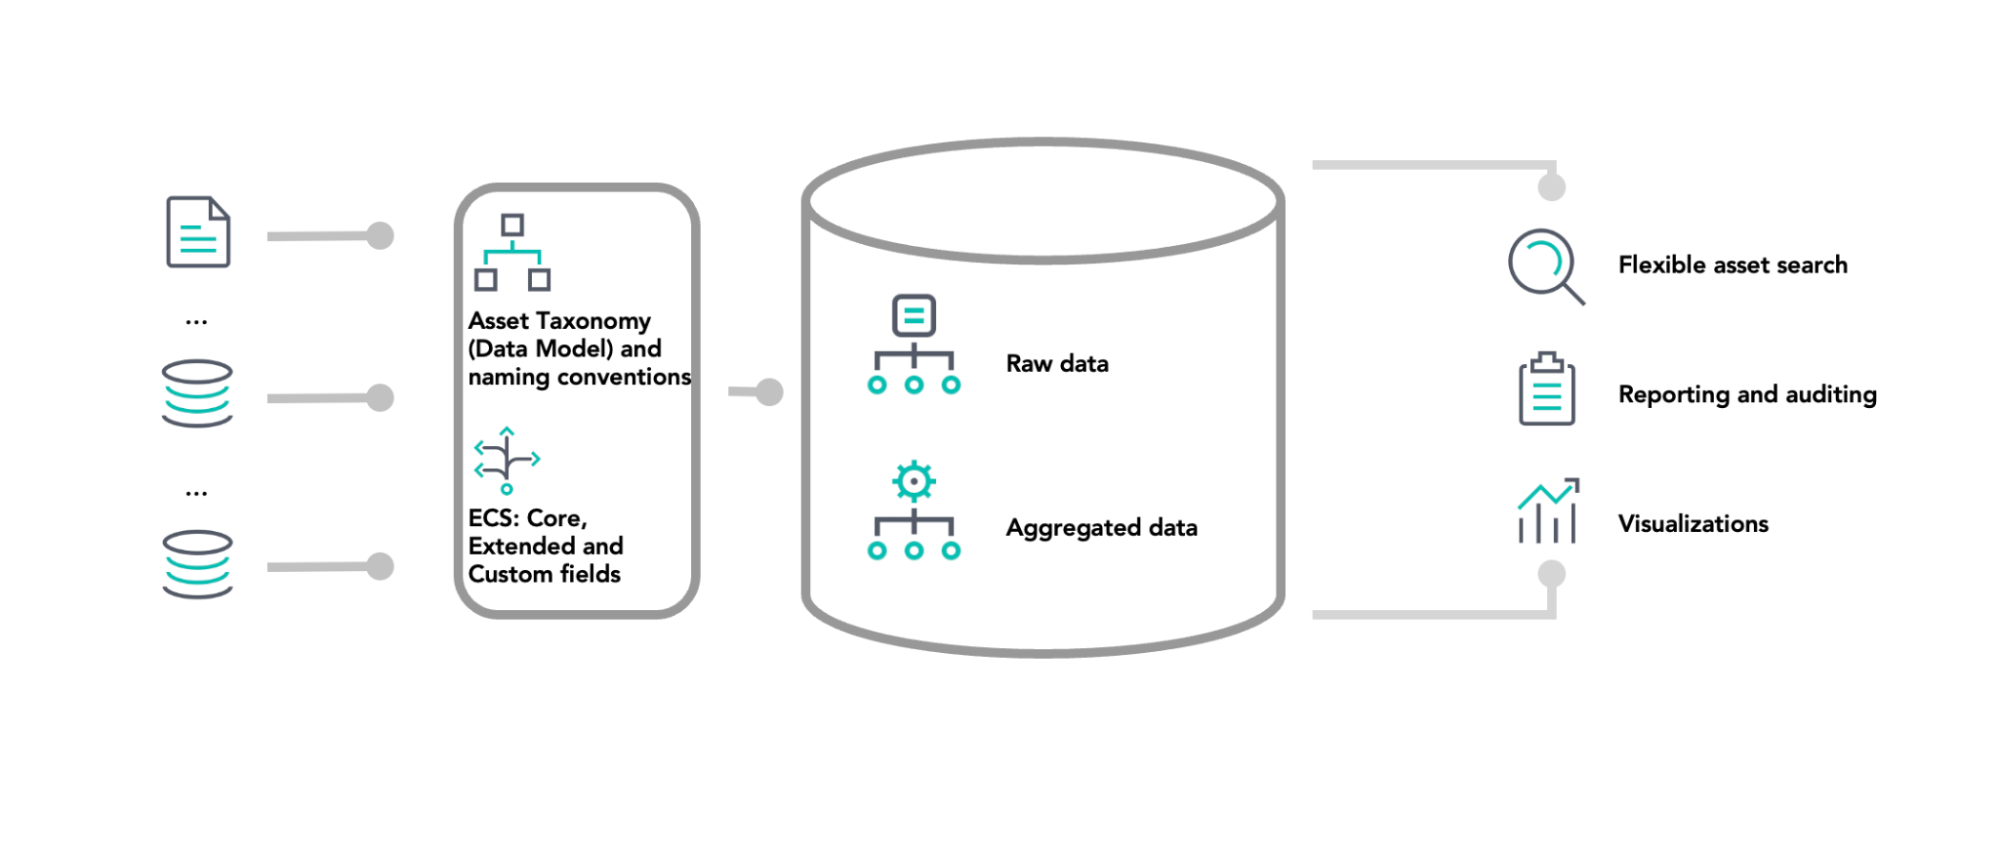
Visualizing the workflow
Our data processing workflow begins with ingesting data from diverse sources, including documents, databases, cloud services, and APIs. Once ingested, the data is organized according to our predefined asset taxonomy and naming conventions. We then standardize the data using ECS, ensuring consistency across data sets.
Processed data is stored in a centralized Elasticsearch cluster, containing both raw and aggregated data. This setup allows us to maintain data integrity for detailed analysis and optimize querying for faster reporting.
Finally, we utilize the stored data for various purposes, including flexible asset searches; reporting and auditing; and creating visualizations such as charts, graphs, and dashboards. These tools help us identify trends, spot anomalies, and make informed decisions.
Real-world use cases for an asset inventory
You can’t protect what you don’t know about. Having an accurate asset inventory searchable within our Elastic cluster gives us a lot of capabilities to detect and protect in ways we never could without it. Two of the primary use cases for the asset inventory within the InfoSec team at Elastic are to enrich SIEM alerts and as an indicator index for indicator match rules.
SIEM alert enrichment
The Elastic InfoSec SIEM architecture consists of Elastic clusters, a Tines SOAR, as well as Slack and PagerDuty for push notifications of critical alerts to the response analysts. As we send the SIEM alerts to Tines and on to Slack, we can use information from the original alert to query the asset inventory and gather all of the information about the system that an analyst may need. This can be incredibly useful in situations when the hostname of the system or user doesn’t help identify the system owner, such as Windows systems with names like DESKTOP-XXXXXX or MacOS systems named macbook-pro.local.
Example use case of SIEM alert enrichment
When a malware alert triggers on a MacOS workstation named macbook-pro.local, the alert will contain information about the workstation such as the host.id. With Elastic Agent on macOS, the host.id field is the same value as the workstation's serial number. The serial number is collected as part of the Jamf inventory information, so we can use that value from the alert to find the workstation entity.
After retrieving the workstation entity record, we now have the name and email address of the system owner. We then run a second query to the asset inventory for the user entity of the system owner. This entity contains information about the user including their work role, cost center, work location, manager, Okta status, contact information, and any other resources managed by that user.
After gathering all of this information, we can then update the alert in Slack by adding the enrichment as a thread to the original message.
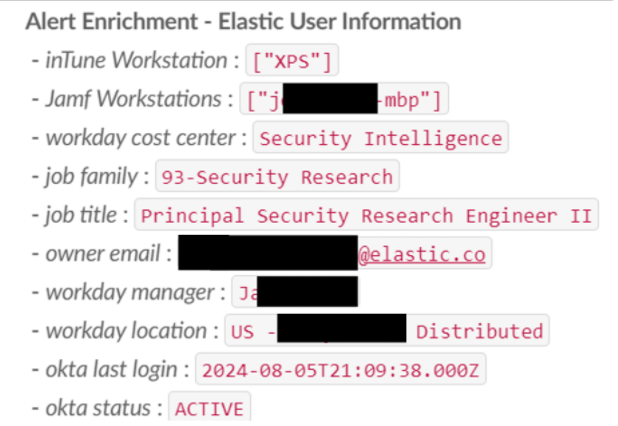
Presenting this information to the analyst in the same place as the alert saves several minutes of investigation time with every alert and can often be used to quickly update the severity of an alert. For example, when we see a malware alert on a security researcher system, we may have a different initial assumption than if we see a malware alert on a workstation in the Payroll cost center.
Another capability that the asset database unlocks is the ability to distribute alerts directly to the system owners that are closest to the issues. When we have an alert where the first triage action is to reach out to the system owner to see if the activity is expected, we can now automate that step and use the response from the system owner to determine whether to escalate the alert to the SOC or to close it.
Using the asset inventory to create alerts
In addition to enriching existing alerts, the asset inventory can be used to detect suspicious activity that would otherwise be impossible to detect. We have several custom detections using the asset inventory as the indicator index pattern in an indicator match rule. An indicator match detection rule will search for new events in an index, as well as for any matching events in a second index where the value of a field matches between the two indices. These detection rules were originally designed to be used with a threat intelligence feed containing known bad indicators of compromise, but they also work really well with the asset inventory. These detections can be great for detecting misconfigurations, insider threat, or process failures such as incomplete employee offboarding.
To create an indicator match rule using the asset inventory, we create a new detection rule and select Indicator Match as the type of rule. We then select the data view or index pattern and the query that we want to use for our alert.
Example use case of using the asset inventory to create alerts
For this example, we are going to create a detection rule that will alert us for any activity from a user account that has been deactivated in Okta. This alert would indicate a failure to fully disable all of the third-party accounts for a deactivated user.
For the first query in an indicator match rule, you provide the index pattern and the query for the events you want to check. In this example, we are looking for any events in our logs-* index that contain a user.email and source.ip field that don’t come from Okta. These could be events from your other data sources such as GitHub, AWS, GCP, Azure, and other third-party software that your users create accounts on.
The second query uses the index pattern of the asset inventory and a query that looks for any Okta accounts that are in a DEPROVISIONED status within the last 24h. We then select the user.email field to match on any events where the user.email in the event matches a deprovisioned account in our asset inventory.
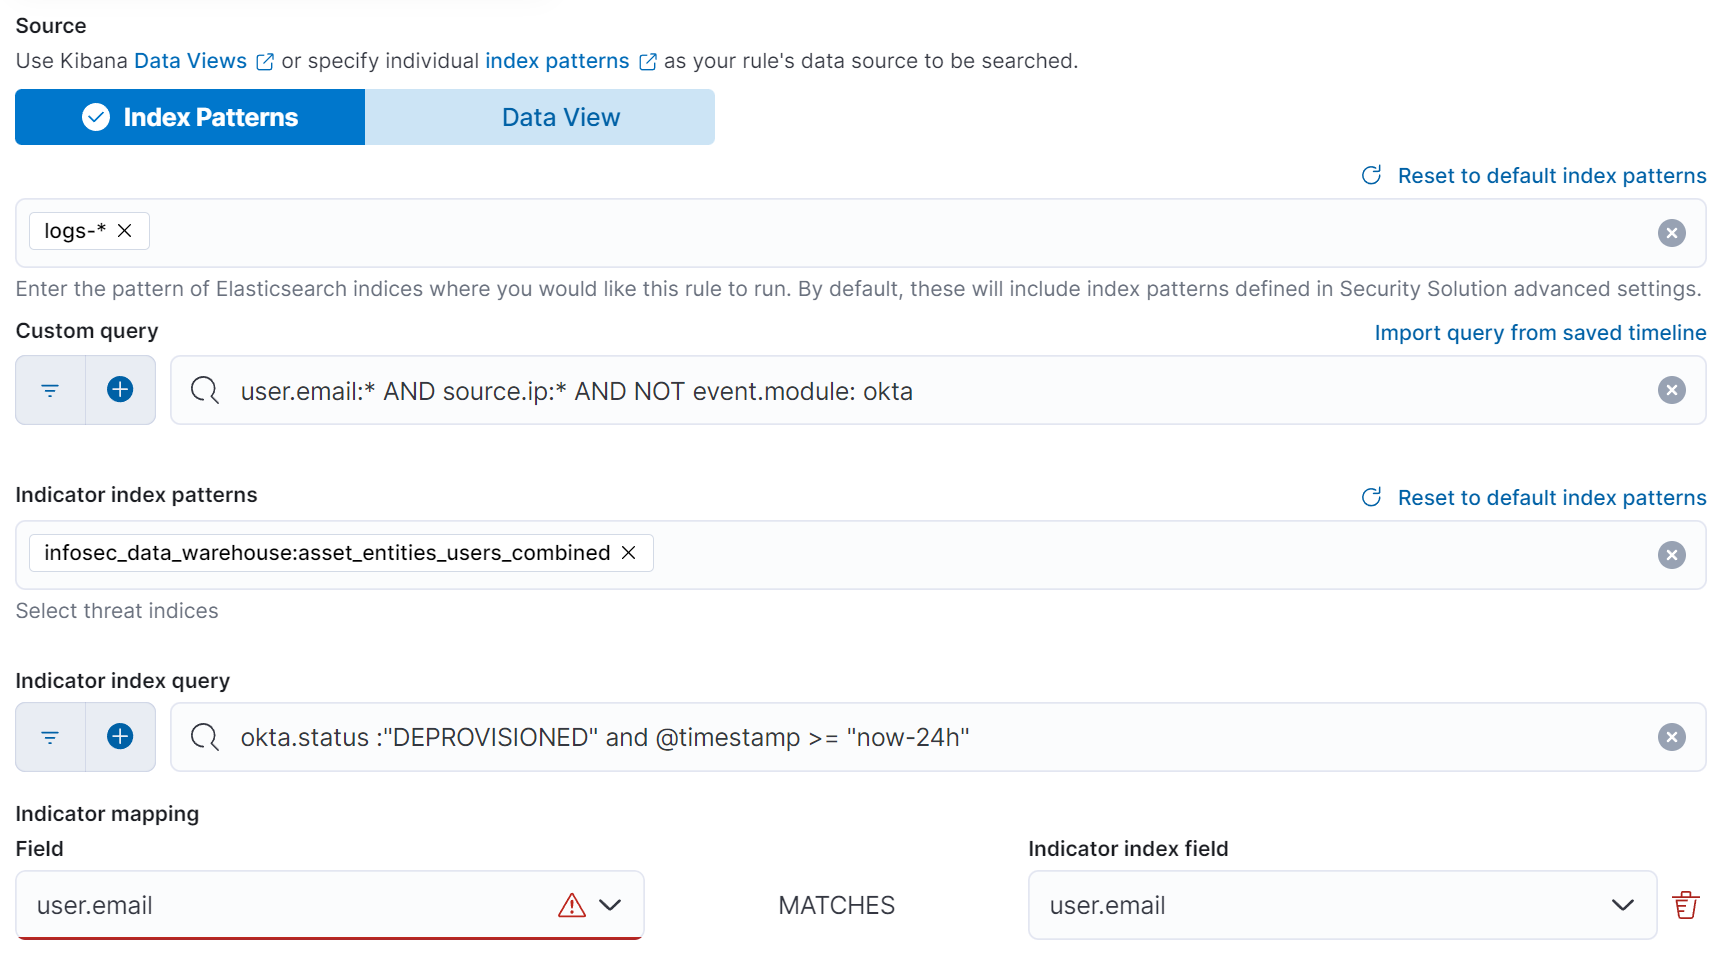
Modern IT systems can be complex and heavily reliant on third-party systems, many of which have their own authentication mechanisms outside of your identity provider (IdP). This detection rule will alert us to any activity from an account that is still active even though the user was deactivated in our Okta IdP.
Wrapping up
This approach not only enhances our asset visibility but also improves our ability to monitor, analyze, and secure our environment in real time.
We use these capabilities to power automation use cases through distributed alerting, alert enrichment, or remediation workflows. For distributed alerting, we are utilizing workflows built in Tines to triage alerts from the Elastic Stack and distribute them based on predefined logic within Tines stories. The same concept is applied to detecting non-conformities and policy violations, such as for workstation enrollment. Whenever users without enrolled workstations are identified, a Tines workflow gathers the relevant user information from the asset inventory and sends the notification to the user via Slack, prompting the enrollment and offering assistance, further streamlining the remediation process.
We’re excited about the potential to expand into many more use cases. Stay tuned for future blogs where we will provide more details and share our story!
Learn more about how Elastic’s InfoSec team uses the Elastic Stack for vulnerability management.
The release and timing of any features or functionality described in this post remain at Elastic's sole discretion. Any features or functionality not currently available may not be delivered on time or at all.
Share
- Share on Twitter
Share on Twitter
- Share on LinkedIn
Share on LinkedIn
- Share on Facebook
Share on Facebook
- Share by Email
Share by Email
- Print this page
Print