How to Tune Elastic Beats Performance: A Practical Example with Batch Size, Worker Count, and More
Motivation
Working in Elastic Support for some time now, I’ve worked on a fair amount of performance tuning case. One of the common scenarios is to help improve ingestion rates. Ingestion has to be tested and tuned per use case --- there is not a formula that fits them all. Performance tuning is an iterative process. Usually, I find that the bottleneck is not in Beats, but in the subsequent stages. Sometimes, though, Beats instances need to be tuned to improve performance.
In this blog post, we will go through a simple, practical exercise about tuning how Beats writes to Elasticsearch. We will be focusing purely on Beats. We will start with an out of the box Elasticsearch cluster, and we will not make any modifications to it. If you are interested in tuning Elasticsearch, the tuning for indexing speed documentation is the right place to go to.
The end goal of this post is to give you an understanding on how you can play with Beats to get better ingestion rates, which tools to use to measure performance, which parameters to tune for most cases, and also to provide an example that you can easily reproduce. Advanced parameters and Beats internals are out of the scope of this tuning exercise.
Setup
Before getting to work, let’s elaborate on the setup (configuration files will come later). This exercise uses version 6.3.1.
Beats
For this example, Filebeat is running from a laptop with 2 quad-core processors and 16GB of memory. We obtained the ZIP or TAR package from the Filebeat download page and uncompressed it to a new folder --- we are not reusing an existing Filebeat installation, since we will be deleting its current status often. We are starting it from the command line in each test. We start it by running filebeat -c <config_file> -e. With this, we will be selecting which configuration we run, and we will see the output in the command line (to quickly see errors in case we make a mistake).
Elasticsearch Cluster(s)
For this test, I created an empty, small cluster in the Elasticsearch Service on Elastic Cloud --- 1GB of RAM, single zone. If you want to do a quick test, you can subscribe to a 14 day free trial.
As part of this test I also enabled Elastic monitoring to an external cluster and configured Filebeat to store monitoring data. This will help to visualize the ingestion rate improvements we are getting.
Data
A very important part of running the tests is to make them repeatable and representative of production data. To that purpose, I will be using the same log file in all of the tests. This log file is comprised of 75,000 log lines from a (fake) apache server log, similar to the following (you can find test samples online):
192.168.1.10 - - [27/Apr/2018:14:11:25 +0200] "GET /app/main/posts HTTP/1.0" 200 5023 "http://somefakeurl.fakedomain/search.php" "Mozilla/5.0 (Macintosh; Intel Mac OS X 10_5_2) AppleWebKit/5342 (KHTML, like Gecko) Chrome/15.0.847.0 Safari/5342"
With this amount of data the test will take just a few minutes. Note that when trying to tune a production system, the tests should run for longer, with more data.
Initial Conditions per Test
Another very important point is to have the exact same conditions at the start of the test. To that end, before each test:
- Stop Filebeat (ctrl+c).
- Delete the index created in the previous execution. Indices are created, by default, with the date appended at the end. To delete it, you can go in Kibana to
Dev Toolsand execute the following command with the right date (click on the green arrow when the command is written):DELETE filebeat-6.3.1-2018.07.17. If your cluster already contains indices, be careful to configure Filebeat to write to an index that does not exist, to be able to remove it without harming the already existing data. - Delete the
datafolder inside the Filebeat directory being used for this exercise (not for any pre-existing Filebeat installations). This is a hard reset of the Filebeat status (remember, Filebeat is stopped).
And now, we are ready to start the next execution.
Performance Tests
In the following tests, we will be playing with the batch size and the number of workers. Per iteration, we will be inspecting the monitoring data. In our monitoring cluster, we can access Monitoring → Beats Overview , and this will show metrics on ingestion rates, failures and throughput. When showing monitoring data, we will be showing the timeline including the previous execution (on the left) and the current execution (on the right).
Baseline
In our case, the baseline will be the default configuration that comes with Filebeat. We will create indices with 3 shards (remember, tuning at the Elasticsearch level is out of the scope of this publication, so the value will remain unchanged), use 1 worker only (i.e, 1 thread writing to Elasticsearch) and a batch size of 50 (documents will be sent to Elasticsearch in batches, at most, of 50 documents). The other changes to the out of the box config are the path to the log file and enabling monitoring and configuring access to the Elastic Cloud cluster via the Cloud ID credentials:
filebeat.prospectors:

- type: log
  enabled: true
  paths:
    - /tmp/my_log
#============================= Filebeat modules ===============================
filebeat.config.modules:
  # Glob pattern for configuration loading
  path: ${path.config}/modules.d/*.yml

  # Set to true to enable config reloading
  reload.enabled: false

  # Period on which files under path should be checked for changes
  #reload.period: 10s

#==================== Elasticsearch template setting ==========================

setup.template.settings:
  index.number_of_shards: 3
  #index.codec: best_compression
  #_source.enabled: false


xpack.monitoring:
  enabled: true

#-------------------------- Elasticsearch output ------------------------------
cloud.id: "my_cloud_id"
cloud.auth: "user:password"
output.elasticsearch:
Finding the Right Batch Size
We can configure how many documents will be sent per batch to Elasticsearch. Depending on the type of data, hardware, network, number of shards, etc, the ideal batch size can vary. The goal of this test is to tune that parameter. The default configuration is already configured with only 1 thread, so we are testing just the batch size.
In the tests, we will start with the default and then we will be doubling the batch size each time.
Batch Size: 50
output.elasticsearch:
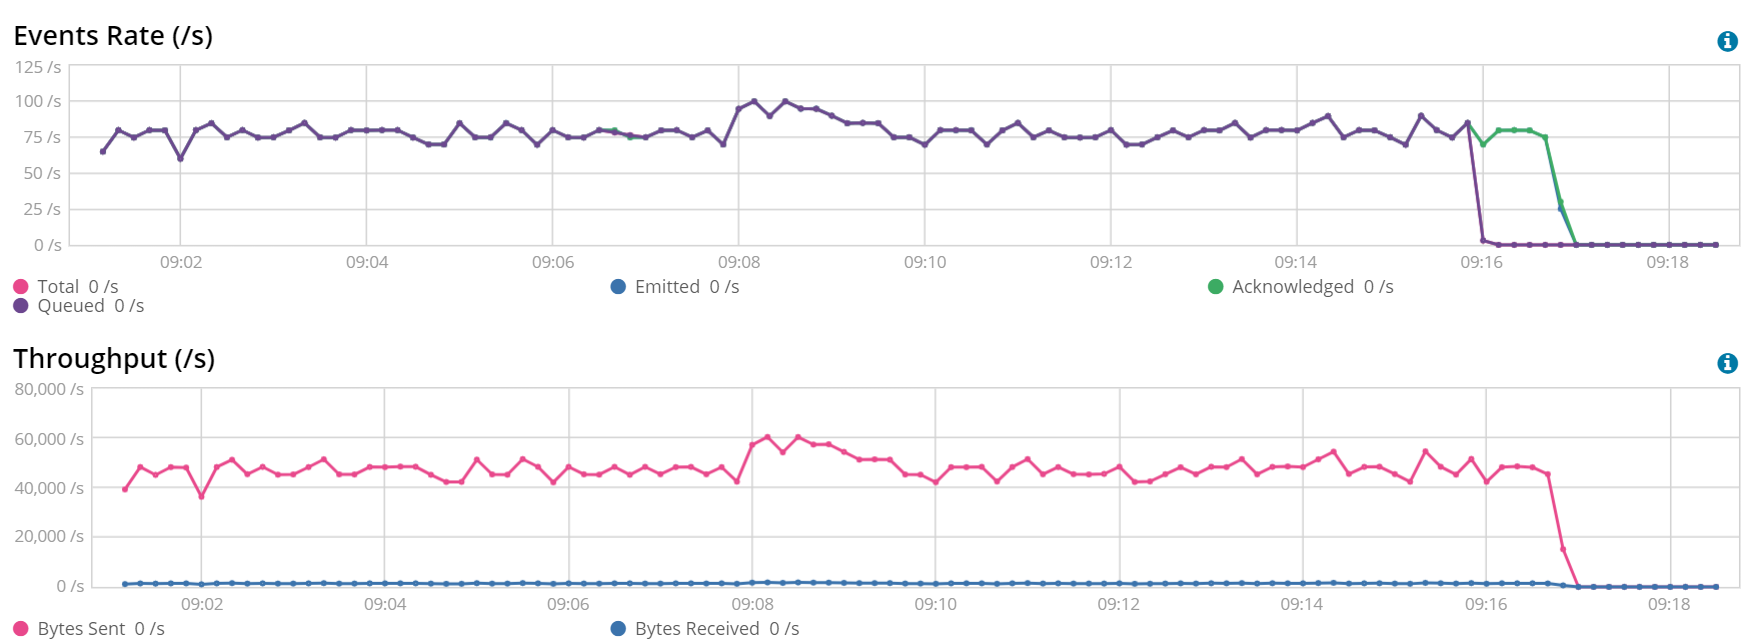
We started with the default configuration --- a batch size of 50. The initial conditions give us an ingestion rate between 50 and (highest peak) 100 documents per second.
Batch Size: 50 (left) vs 100 (right)
We can clearly see that ingestion rates are over 75 documents per second when using a batch size of 100 documents.
output.elasticsearch:
  bulk_max_size: 100
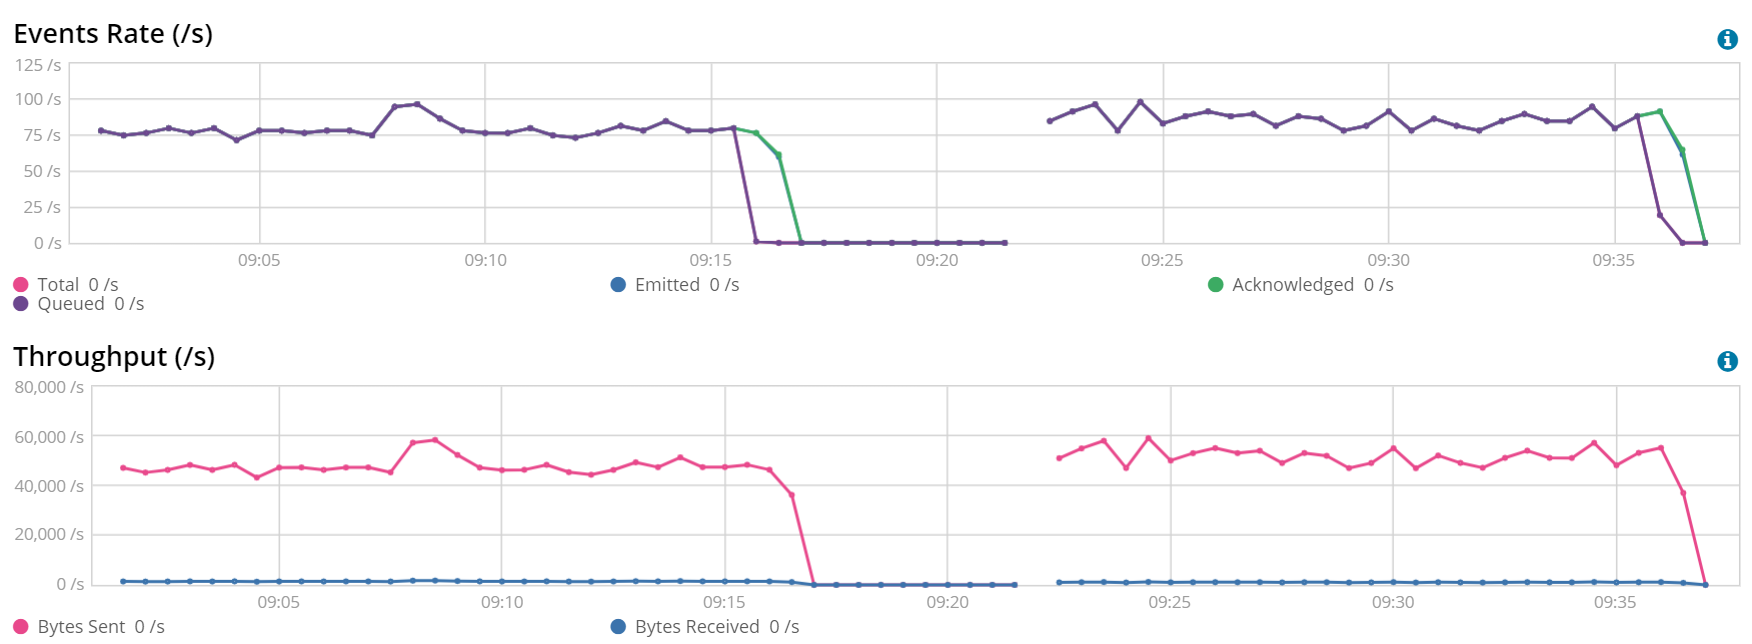
Batch Size: 3200 (left) vs 6400 (right)
Before this test, all of the tests with a batch size of 200, 400, …, 1600 were done. For the clarity of the post we just fast-forwarded until the last test. In this test, we saw that the performance improvements for 3200 vs 6400 is not noticeable, so we selected 3200 as our best batch size.
Tuning the Number of Workers
Once we have established how many documents we should send to Elasticsearch per batch, it is time to establish how many workers/writers we can have. Tuning the number of workers increases how many threads write to Elasticsearch. Once again, this test aligns with the recommendations to improve indexing speed in Elasticsearch. We will follow the same procedure by doubling the number of workers per execution:
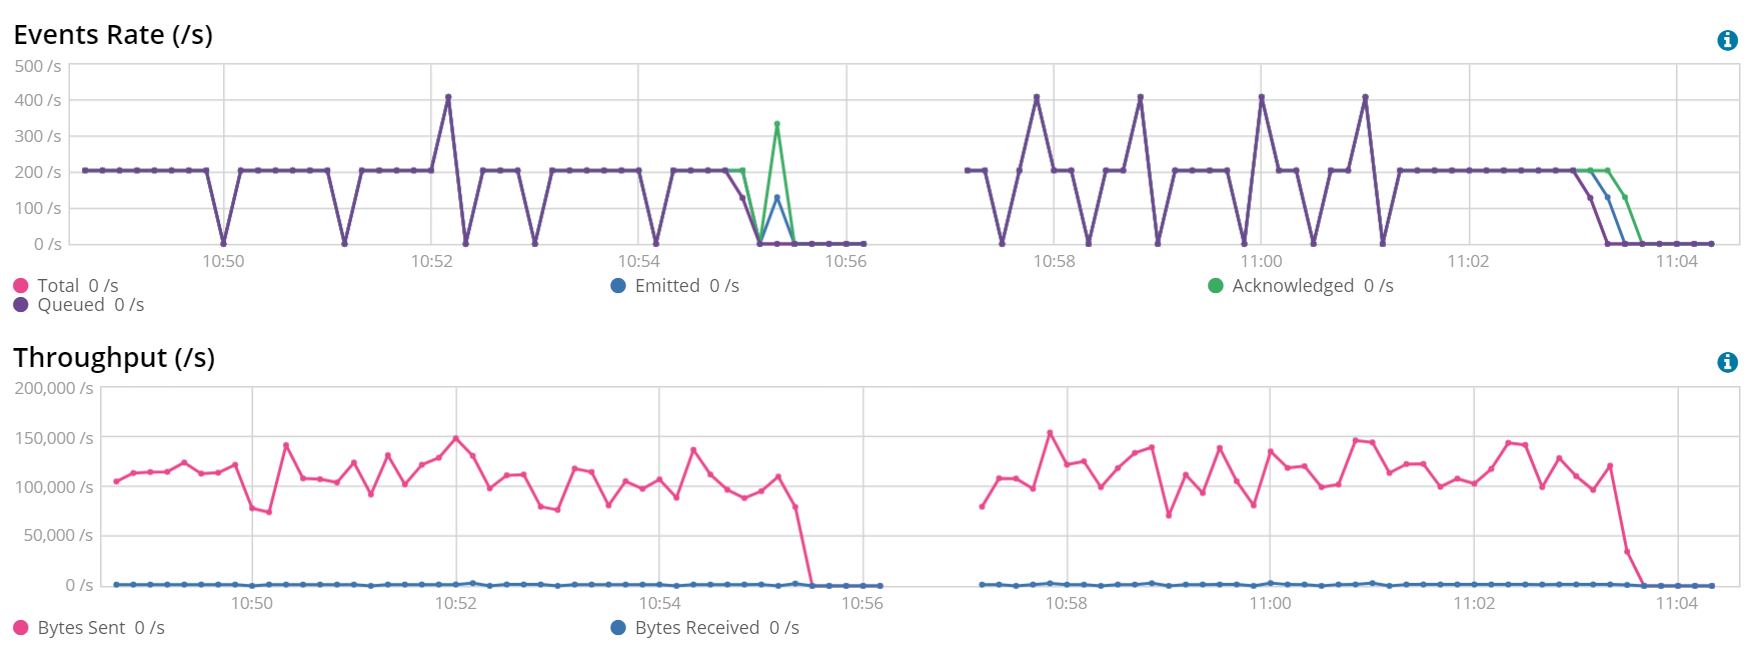
1 Worker, Batch Size 3200 and 6400 (left) vs 2 Workers, Batch Size 3200 (right)
Doubling the number of workers gave us a great improvement. We now have more threads taking batches of documents when they are available and sending them to Elasticsearch.
output.elasticsearch:
  bulk_max_size: 3200
  worker: 2
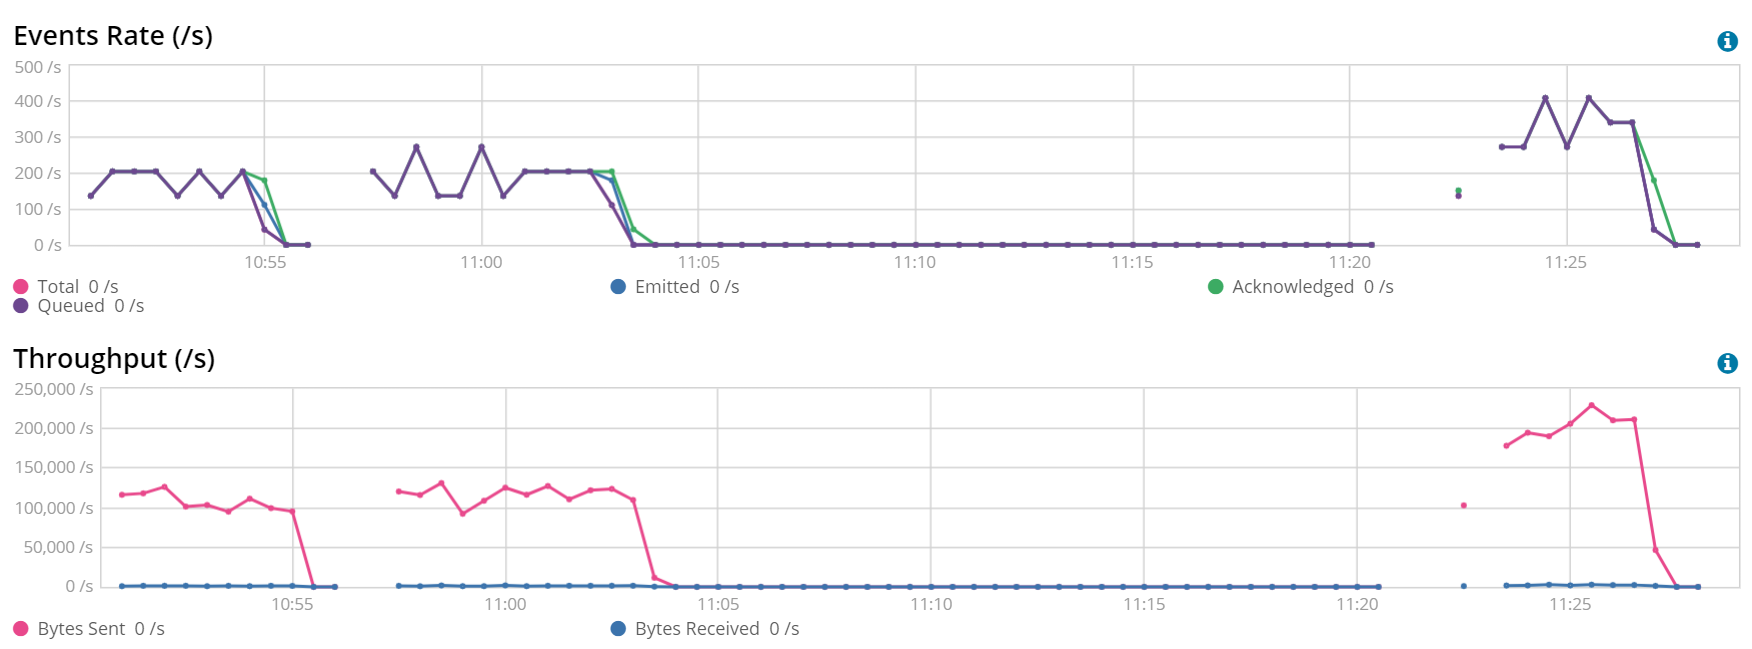
2 Workers, Batch Size 3200 (left) vs 4 Workers, Batch Size 3200 (right)
This result may be surprising, but it is a great example of more is not always better. Having more threads writing to Elasticsearch in this Filebeat instance actually had a negative impact.
output.elasticsearch:
  bulk_max_size: 3200
  worker: 4
Reviewing the Test Results
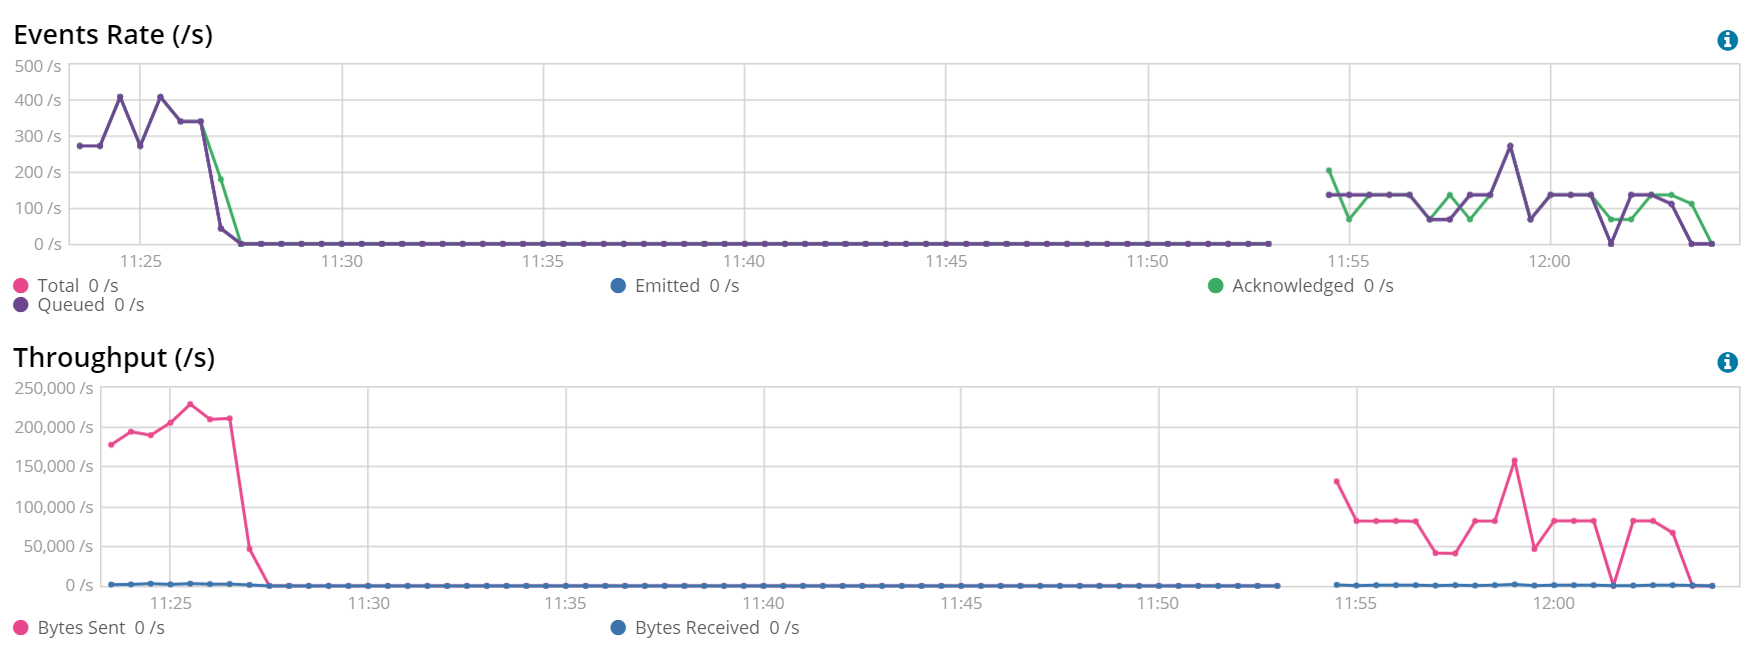
The moment has come. What is the improvement we got? The following screenshot shows the tests. On the top of each execution, the number of workers (w1, w2) and the batch size (b50..b6400) is stated:

We started on an average below 100 documents per second and we ended with more than 300 documents per second --- the new scenario is 3-4 times faster than the original one! Is this the best scenario we could reach just by modifying these two parameters? Very likely, it is not. Is this one of the best scenarios we could reach just by modifying these two parameters? Very likely, yes. We could have run more exhaustive tests, testing every possible combination workers-batch size, using smaller steps when increasing the batch size… but hopefully, at this point you already got the idea on how a tuning process looks like, which is the goal of this post.
Seeing these results, another test is needed. The next is an example of 3 Filebeat instances running at the same time in the same laptop (so, competing for hardware resources), reading the same file and with the configuration that we had agreed to be the best (batch size = 3200, workers = 2):

As can be seen, the rate varies between 500 and 750 documents per second, well above the average 350 we had obtained earlier.
Sneak preview on more advanced settings
During this post, we did not configure Beats internal queues, which is out of the scope of this text --- a future advanced tuning blog post will discuss it in depth.
An approach to achieve higher throughput via a single Beats instance working against Elasticsearch is to set the following properties: queue.mem.events to 2 * workers * batch size and queue.mem.flush.min_events to batch size. This specific configuration aims to optimize average throughput at the expense of using more memory and be a bit less near-real-time under certain conditions. The following is the best-case scenario obtained by applying the previous memory queue considerations during the tuning tests, in which the best end parameters were a batch size of 1600 and 16 workers:
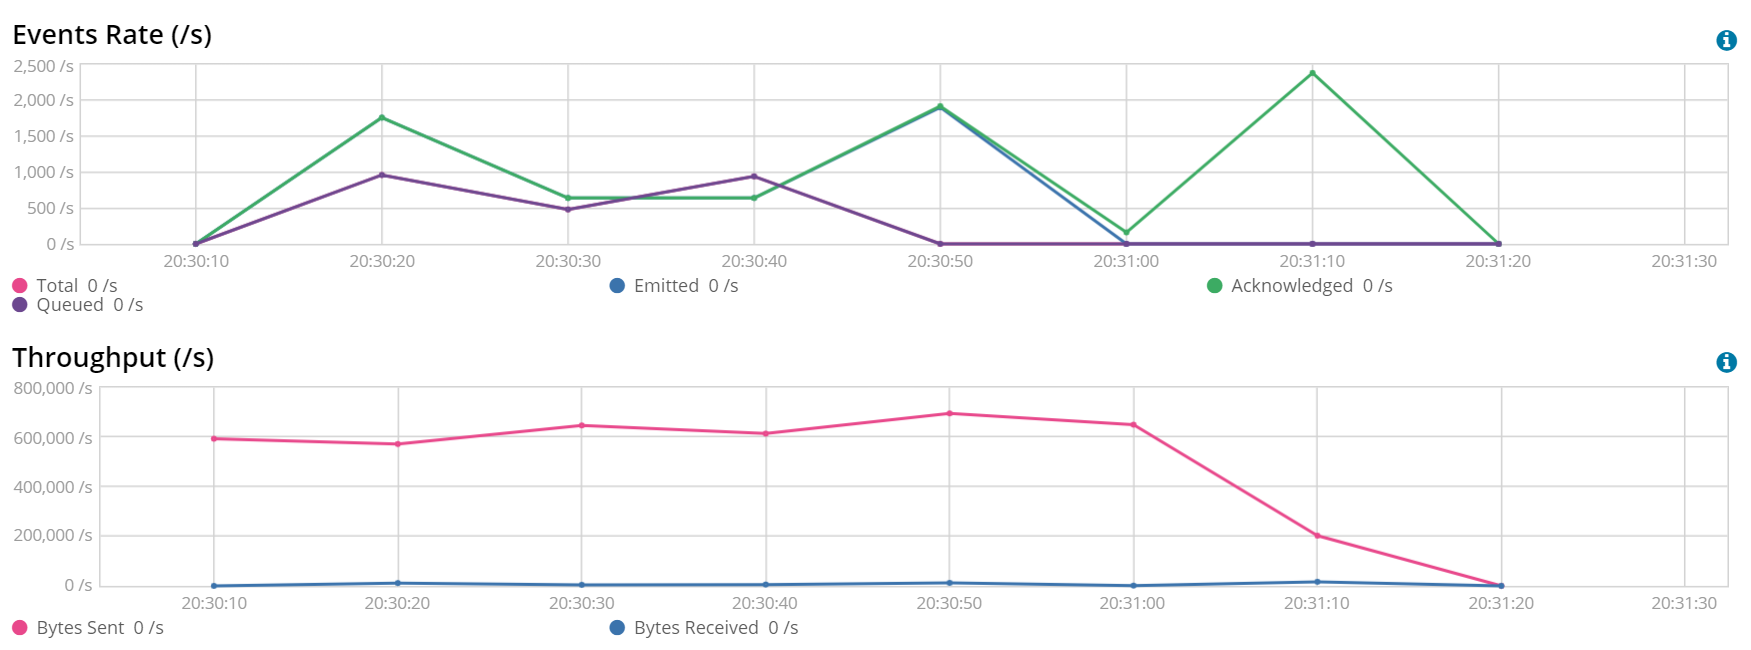
In this scenario, we ingested the 75K docs file in around 70 seconds, giving us an ingestion rate over 1000 documents per second. As mentioned, we achieved this result at the expense of using more resources. Going in Monitoring to Beats → Instances in this period of time and selecting this specific Beat showed an average usage of 160MB of memory and 3% of CPU. In the best scenario without memory queue tuning, average memory usage had been 40MB and average CPU usage 1.5%.
Another item that you may have noticed in this extra test is that we never go over 700KB/s. Are we hitting bandwidth limitations? We can configure the compression level in several outputs, including the Elasticsearch output. By default, it does not do compression. To test this hypothesis, we changed the configuration as follows for max compression:
output.elasticsearch:
  bulk_max_size: 1600
  worker: 16
  compression_level: 9
Testing the file we had originally was not representative (too fast), so we decided to test with a file with the same type of data, but 10x bigger (750K lines). The result follows:
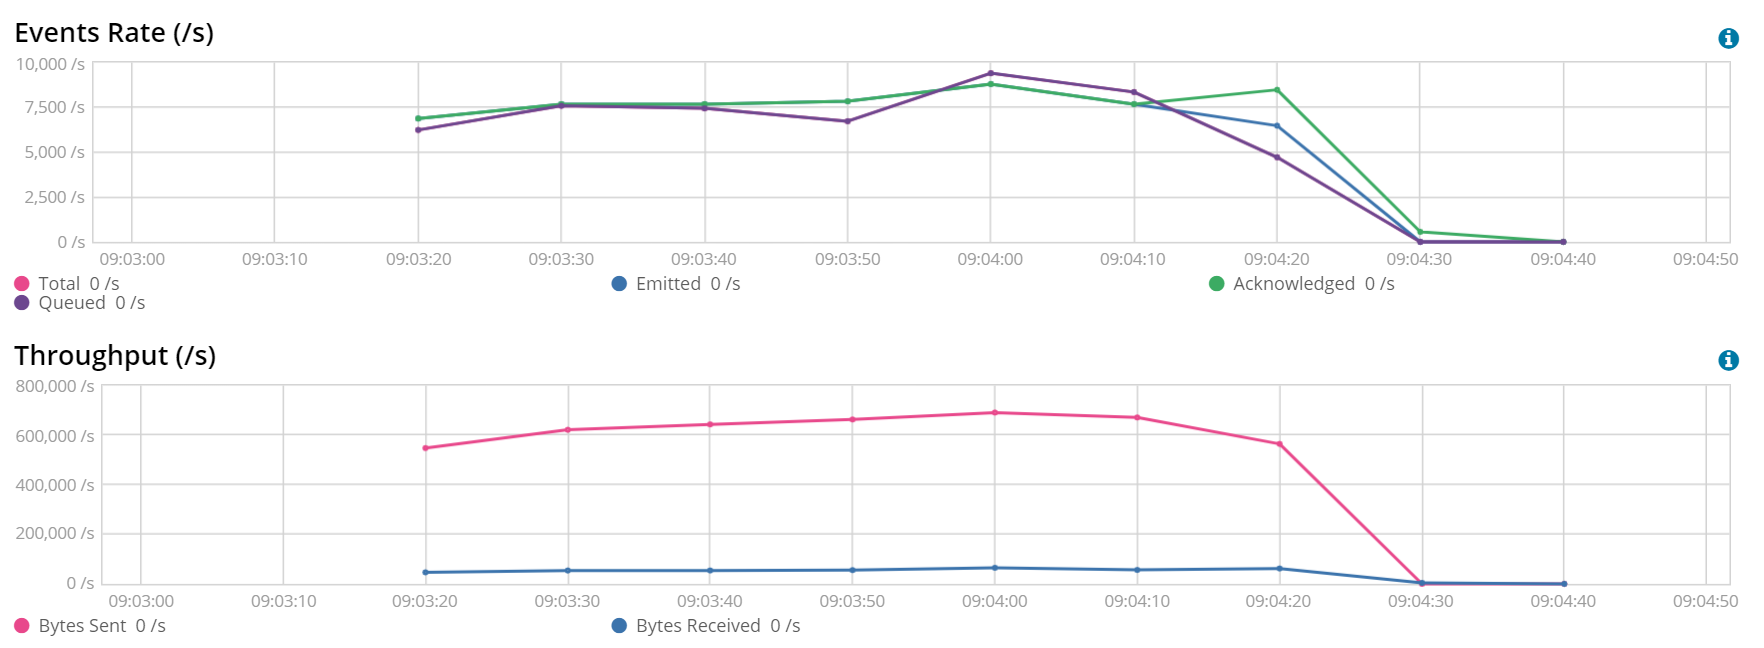
Indeed, with the max compression we seem to be hitting the same network throughput. At the same time, we are able to reach over 7500 docs/s --- at the expense of higher CPU consumption, which reached 8% for Beats processing. So, in this scenario, we are network limited.
Extra considerations
During these tests, we did not inspect any other monitoring data apart from the indexing rates. When doing formal performance testing, it is recommended to take a look at the metrics of both systems involved. If any of the systems is getting stressed in memory or CPU, we may have the ability to increase those resources. If we are getting rejections from the destination (observable in the Beats logs and also in Beats monitoring), Beats will have to retry them, with implicit performance impact. If we do not pay attention to rejections, we may think that the bottleneck is Beats and try to tune in the wrong part, when we should be looking at tuning the destination.
A typical scenario we see in support is the following: a Logstash instance configured with 8 threads and a batch size of 400 documents performing better than when the batch is set to 800 documents (which may be legit). Upon further inspection we see memory stress in the instance because it is configured with a heap of 1GB, so, keeping 8x800 documents in memory is too much. Simply increasing the heap (if memory is available) can lead to being able to properly test a batch size of 800, which may or may not be better than 400.
Wait, why did you mention Logstash? This is a Beats post.
The same principles explained in this post apply to Logstash → Elasticsearch, but we have two very good docs elaborating further on that topic for Logstash: Performance troubleshooting and Tuning and Profiling Logstash performance.
Also, the same principles on batch size and workers apply when the workflow is Beats → Logstash.
Lessons Learned
- Some simple performance tests can save you a lot of headaches later --- the benefit can be great.
- Be thorough in your tests! Spend as much time as needed at the start of the project. Once a project is already running in production, the most likely scenario for performance testing is that it is not keeping up with the incoming data, and you'll have to improve the performance while surrounded by sirens and horns!
- Be methodical when testing performance: stable environment, repeatable tests, representative of production, one change at a time, do not rush it should be the mantra here.
- More is not always better. ”It is going slow, so we should deploy a change in production tonight so it uses more threads” does not always bring benefits.
And now, time to go and start testing. Happy tuning!