Integrating Nagios Checks with Logstash
Nagios is an open-source monitoring platform wherein users can write plugins or download a wide range of community plugins to accomplish highly customized monitoring goals. A while back, I wrote about how you can integrate any Nagios plugin into the Elastic Stack by using a plugin for Beats called NagioscheckBeat.
It seems only fair that Beats’ older brother — Logstash — should also have this ability, which would provide a great fit for centralized monitoring to compliment the distributed monitoring of Beats. Let’s see what we can do with logstash-input-nagioscheck plugin.
Getting Started with Nagioscheck
A Nagios check is a very simple interface. An executable runs and outputs a string in the expected format, which is parsed by Logstash. The nagios-plugins package is usually available in the base repo of most Linux distributions, otherwise they can be downloaded. In the example below, we're using a basic check_snmp, that polls remote system metrics via SNMP.
$ yum install nagios-plugins
$ /usr/local/sbin/check_snmp -H demo.snmplabs.com -C public -o SNMPv2-MIB::system.sysUpTime.0
SNMP OK - 464134787 | DISMAN-EVENT-MIB::sysUpTimeInstance=464134787
Taking a closer look, we have a number of components that are parsable:
- Message:
SNMP OK - 464134787 - Metric:
DISMAN-EVENT-MIB::sysUpTimeInstance=464134787
Each performance data metric is split into its own Logstash event, and then pushed onto the pipeline. Additionally, a base event is pushed that contains the primary result of the overall check. Most plugins include warning and critical level thresholds so that a determination of status (OK, WARNING, or CRITICAL) can be made at the time the check returns.
The advantage of the interface is its simplicity — anyone can write a Nagios check, even with a shell script. Here’s a great tutorial on how to write a basic check in bash. If you want to write a more advanced plugin, you should use the helper Perl module.
You might decide to use this integration when you want to store & analyze performance data (metrics) from some custom polling. With Elasticsearch’s new Rollup feature in 6.3, the retention period for this type of data is potentially indefinite. Further, you could even use Nagios data to forecast trends with machine learning.
Example: How to Implement Nagioscheck
Let’s take a look how to implement Nagioscheck. Note that this input plugin requires Logstash 6.2.3 at minimum.
1. Install Nagioscheck
bin/logstash-plugin install logstash-input-nagioscheck
2. Nagios Module Setup
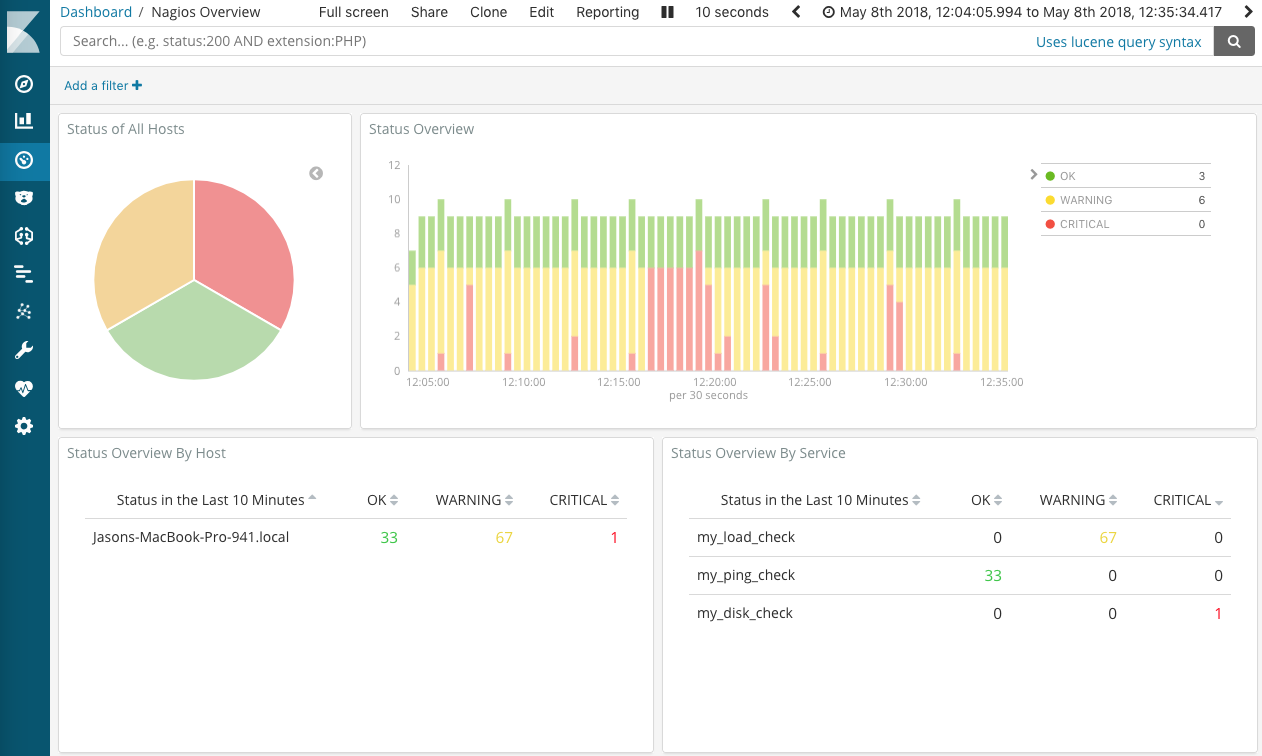
Then, you can initialize Elasticsearch with an index template, and Kibana with an overview dashboard by running the nagios module setup
bin/logstash --modules nagios --setup

3. Start Plugging
Download or develop your favourite check, and plug it in:
input {
 nagioscheck {
   name => "my_ping_check"
   command => "/usr/local/sbin/check_ping -H www.google.com -w 85,30% -c 100,40%"
   interval => "10"
 }
}
Once you’ve got data into Elasticsearch, the sky's the limit.

This use case begs the question, what if I want to programatically add thousands or more checks into Logstash? The Nagioscheck input is an extension of the exec input plugin, which could be enhanced with thread pooling — let us know if you would find such an enhancement useful.
The Nagioscheck Community
Both NagioscheckBeat and the Nagioscheck Logstash plugin are community maintained, and not officially supported by Elastic. If you have any issues with Nagioscheck, you can reach out on our Discuss forum or raise a pull request.