Monitoring Kubernetes with the Elastic Stack using Prometheus and Fluentd
Kubernetes is an open source container orchestration system for automating computer application deployment, scaling, and management, and seems to have established itself as the de facto standard in this area these days. The shift from monolithic applications to microservices brought by Kubernetes has enabled faster deployment, where dynamic environments become commonplace. But on the other hand, this has made monitoring applications and their underpinning infrastructure more complex. Fortunately, Elastic has been widely used for infrastructure and application monitoring solutions for many years — both as the ELK Stack (Elasticsearch, Logstash, and Kibana) and more recently as Elastic Observability. While Elastic Observability can be used to establish observability for Kubernetes environments, many users also want to use the open source-based monitoring tools they already have.
In this blog, we will explore how to monitor your Kubernetes ecosystem using Prometheus and Fluentd in conjunction with the Elastic Stack.
Using Prometheus and Fluentd
As you know, Prometheus is a very popular open source project as a metric toolkit, which holds a dominant position especially in the recent metric monitoring for Kubernetes environments. Prometheus uses a pull model that scrapes metrics from endpoints and ingests them into Prometheus server. However, when it comes to storage, Prometheus has some limitations in its scalability and durability since its local storage is limited to a single node. In order to eliminate those limitations, users should either go with clustered storage in Prometheus itself, or use the Prometheus interfaces that allow integrating with remote storage systems. Fluentd is an open source log collection tool that has been known for a long time, and it is also very popular. Fluentd exists between various log sources and the storage layer that stores the collected logs, and is similar to Logstash in the Elastic Stack. Therefore, Fluentd also needs a long-term storage system. That's why we combine Elasticsearch as a long-term storage for logs and metrics, and Kibana as a visualization tool. In fact, log monitoring solutions using Elasticsearch, Fluentd, and Kibana are also known as the EFK Stack.
Monitoring architecture
In this blog, we will deploy a simple, multi-container application called Cloud-Voting-App on a Kubernetes cluster and monitor the Kubernetes environment including that application. I will explain the procedure to collect metrics using Prometheus and logs using Fluentd, ingest them into Elasticsearch, and monitor them using Kibana. The overview architecture is shown in the figure below. Also, the code for this tutorial is available in my GitHub repo, so please refer to that for the complete procedure.
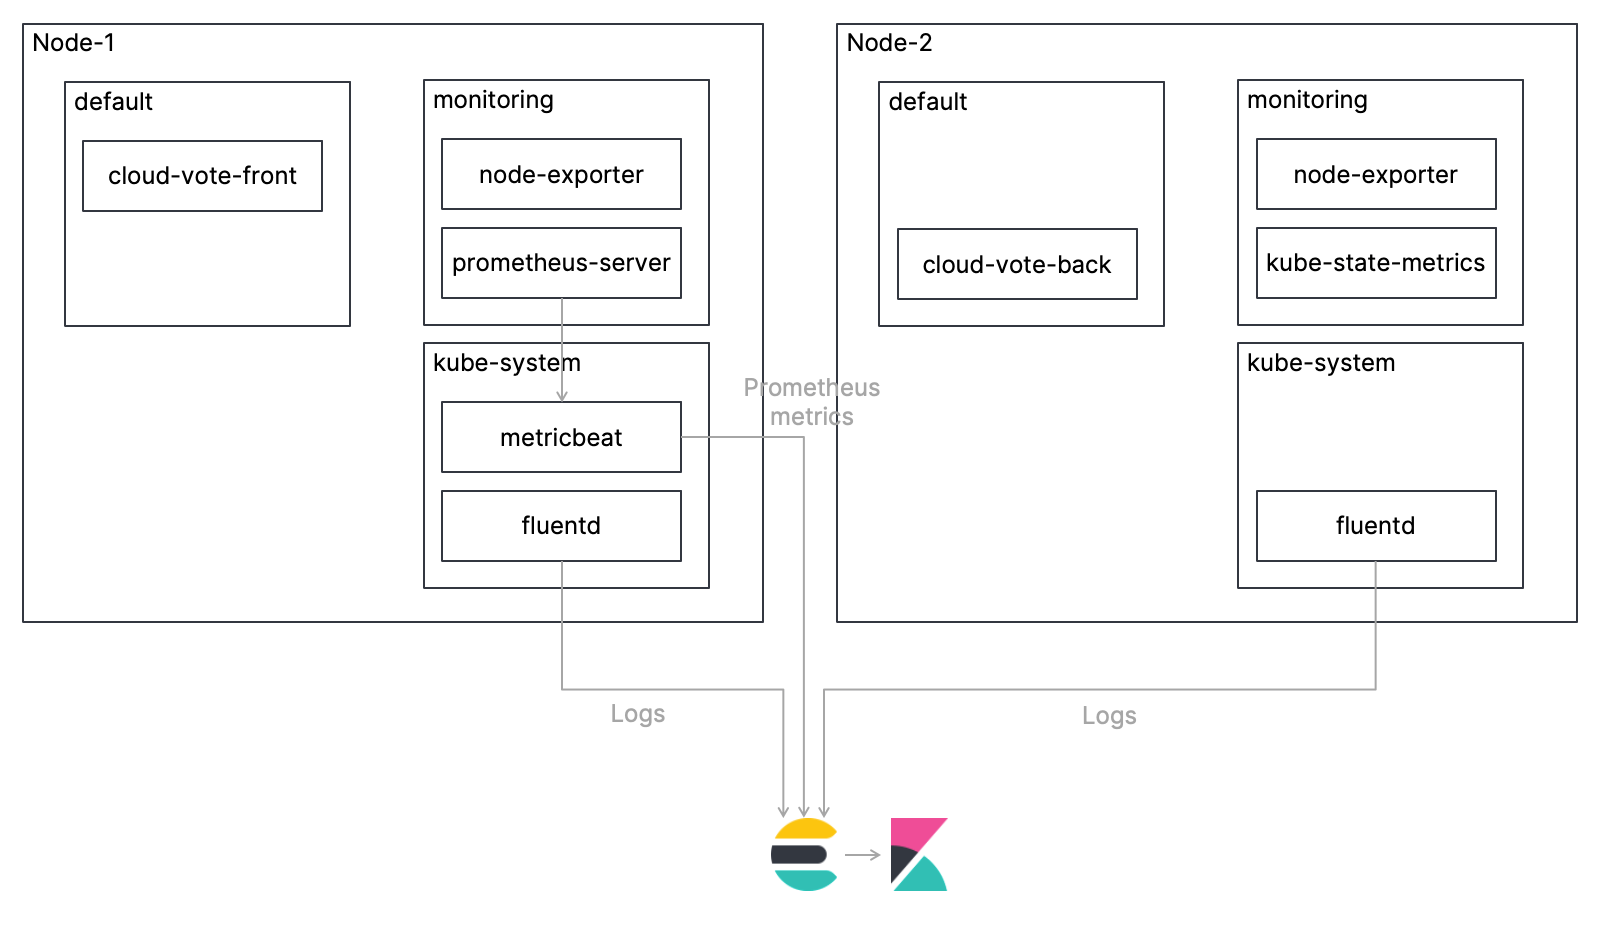
Let's take a look at each step!
Deploying Fluentd as a DaemonSet
Only one instance of Fluentd should be deployed per Kubernetes node. Configuration examples are available in Fluentd’s official GitHub repo, and Fluentd settings, which are required for parsing the logs from each container properly, are added as a ConfigMap. The manifest for the DaemonSet is already defined in the file cncf-projects/fluentd-daemonset-elasticsearch-rbac.yaml, so all you have to do is add the URL and credentials for your Elasticsearch cluster. If you want to know more about how to configure Fluentd, please consult the official Fluentd documentation. The blog "Cluster-level Logging in Kubernetes with Fluentd" written by Kirill Goltsman is also very helpful.
apiVersion: extensions/v1beta1
kind: DaemonSet
metadata:
  name: fluentd
  namespace: kube-system
  ...
spec:
    ...
    spec:
      containers:
      - name: fluentd
        image: quay.io/fluent/fluentd-kubernetes-daemonset
        env:
          - name:  FLUENT_ELASTICSEARCH_HOST
            value: "elasticsearch-logging"
          - name:  FLUENT_ELASTICSEARCH_PORT
            value: "9200"
          - name:  FLUENT_ELASTICSEARCH_SSL_VERIFY
            value: "true"
          - name:  FLUENT_ELASTICSEARCH_SSL_VERSION
            value: "TLSv1_2"
          - name: FLUENT_ELASTICSEARCH_USER
            value: "elastic"
          - name: FLUENT_ELASTICSEARCH_PASSWORD
            value: "changeme"
        ...
Fluentd creates indices in Elasticsearch called logstash-YYYY.mm.dd by default. Create an Index Template in advance to avoid unnecessary mixing of Text and Keyword fields.
PUT _template/logstash
{
  "index_patterns": [
    "logstash-*"
  ],
  "mappings": {
    "dynamic_templates": [
      {
        "message_field": {
          "path_match": "message",
          "mapping": {
            "norms": false,
            "type": "text"
          },
          "match_mapping_type": "string"
        }
      },
      {
        "another_message_field": {
          "path_match": "MESSAGE",
          "mapping": {
            "norms": false,
            "type": "text"
          },
          "match_mapping_type": "string"
        }
      },
      {
        "strings_as_keyword": {
          "mapping": {
            "ignore_above": 1024,
            "type": "keyword"
          },
          "match_mapping_type": "string"
        }
      }
    ],
    "properties": {
      "@timestamp": {
        "type": "date"
      }
    }
  }
}
Deploying Prometheus
Prometheus can write samples that it ingests to a remote URL in a standardized format, by integrating remote storage systems. Please refer to the official Prometheus documentation for more details. In order to use Elasticsearch as a remote storage system for Prometheus, we employ the official Metricbeat module and more specifically the remote_write metricset.
Deploying Metricbeat as a Deployment
Deploy one instance of Metricbeat as a Deployment in your Kubernetes cluster. The manifest for the deployment is already defined in cncf-projects/metricbeat-kubernetes-deployment.yaml so all you have to do is add the URL and credentials for your Elasticsearch cluster. The settings for the Metricbeat remote_write metric set in the manifest file are as follows. Metricbeat now listens for a remote write request via http from Prometheus on port 9201 and writes the metrics from Prometheus to metricbeat- * indices. Metricbeat acts, so to speak, as a Prometheus remote storage adapter.
# Metrics sent by a Prometheus server using remote_write option
- module: prometheus
  metricsets: ["remote_write"]
  host: "0.0.0.0"
  port: "9201"
Deploying Prometheus with Helm Charts
There are several ways to deploy Prometheus to a Kubernetes cluster, but here we employ Helm Chart to deploy Prometheus. Please refer to the GitHub repo for the Helm Charts provided by the Prometheus community. Prometheus components can be customized using Chart's customization YAML file, and the following shows the customizations in the file cncf-projects/prometheus_custom.yaml. Here, the default Prometheus Service is changed from ClusterIP to LoadBalancer, and the URL of remote_write is set to Service of Metricbeat in order to write the metric to the port 9201 of Metricbeat mentioned above. Alertmanager and Pushgateway are disabled here.
alertmanager:
  ## If false, alertmanager will not be installed
  ##
  enabled: false

server:
  ## Prometheus server container name
  ##
  service:
    type: LoadBalancer
  ## https://prometheus.io/docs/prometheus/latest/configuration/configuration/#remote_write
  ##
  remoteWrite:
    - url: "http://metricbeat-svc.kube-system.svc.cluster.local:9201/write"

pushgateway:
  ## If false, pushgateway will not be installed
  ##
  enabled: false
Deploying the application
The Cloud-Voting-App, which is the monitoring target in this case, is a simple multi-container application. The application interface has been built using Python/Flask. The data component is using Redis. The application is instrumented with Prometheus Python Client to export a simple custom metric cloud_vote_total. The metric is incremented with each POST request, where the vote variable specifies the label.
# Define prometheus counter
VOTES = Counter('cloud_votes_total', 'Cloud Votes Requested.', labelnames=['vote'])

@app.route('/', methods=['GET', 'POST'])
def index():

    if request.method == 'GET':

    ...

    elif request.method == 'POST':

        # Increment Counter
        VOTES.labels(request.form['vote']).inc()
        ...
Let's access Kibana
Now we have deployed all the required components. Let's vote a few times with the Cloud-Voting-App and then access Kibana.
Logs
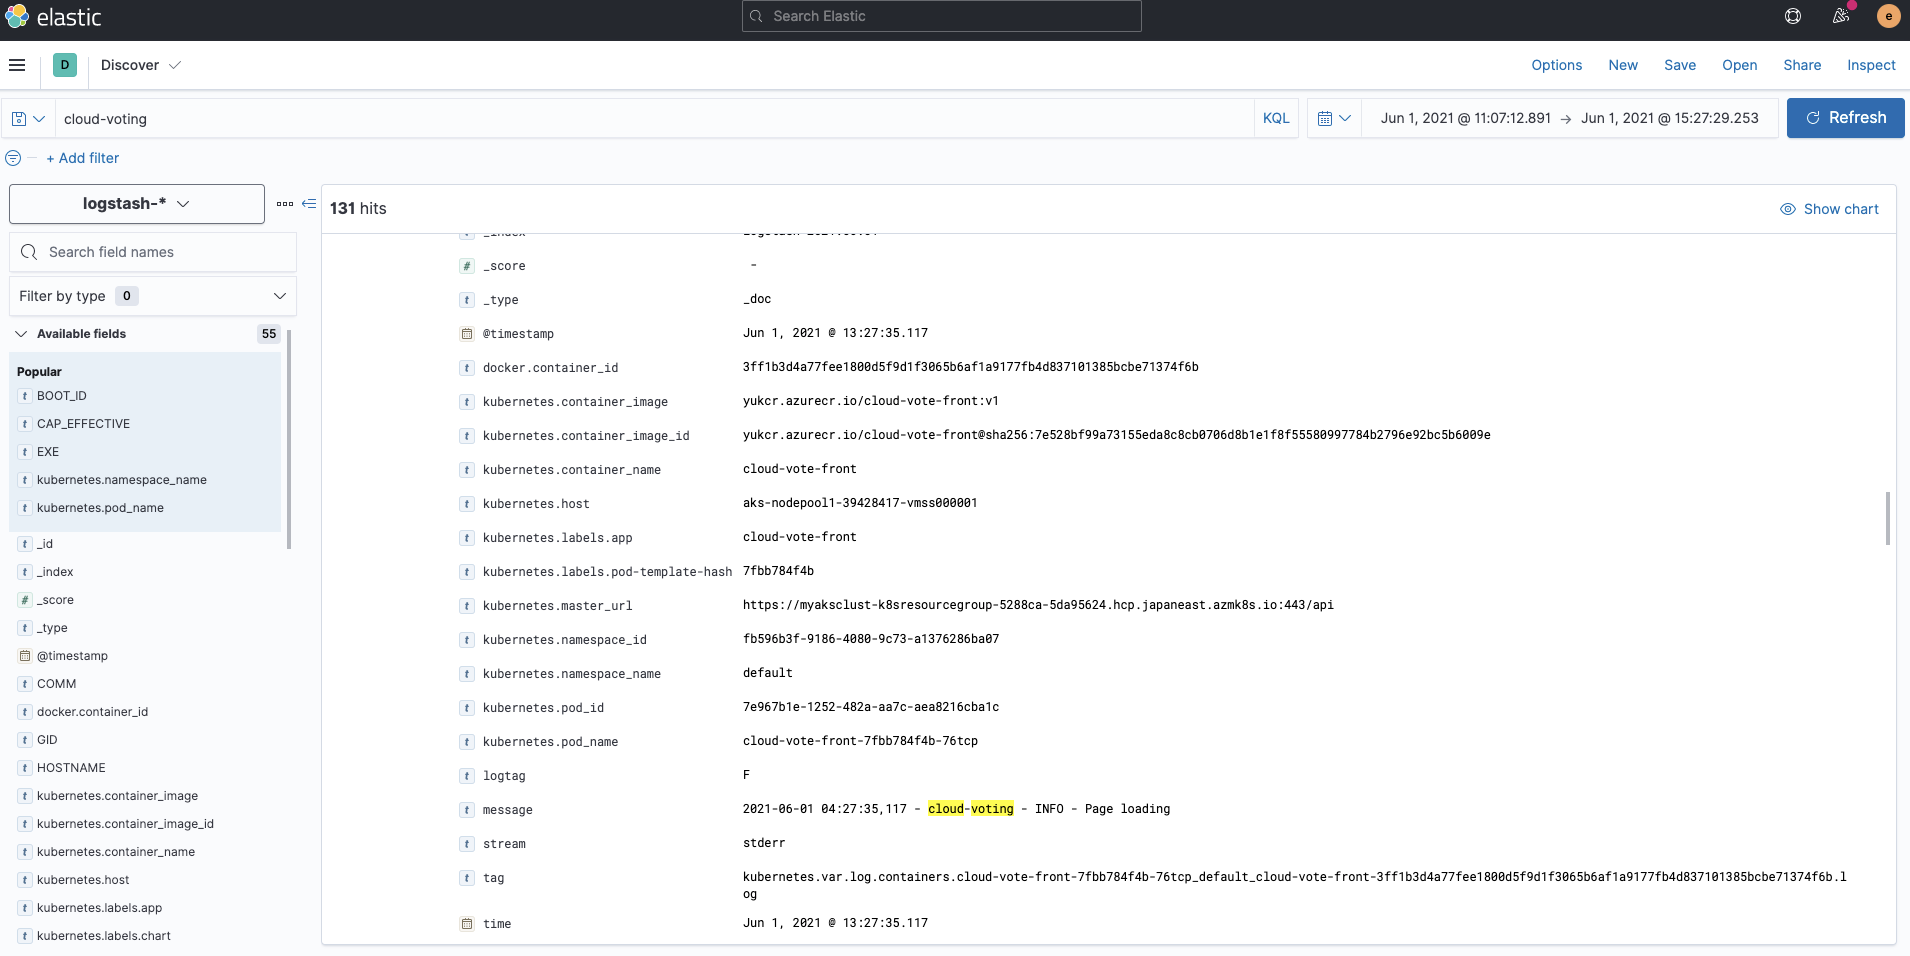
Logs ingested by Fluentd are stored into the indices logstash-*. If you check with Kibana Discover, you can see that the logs for each container are indexed with the metadata kubernetes.*.
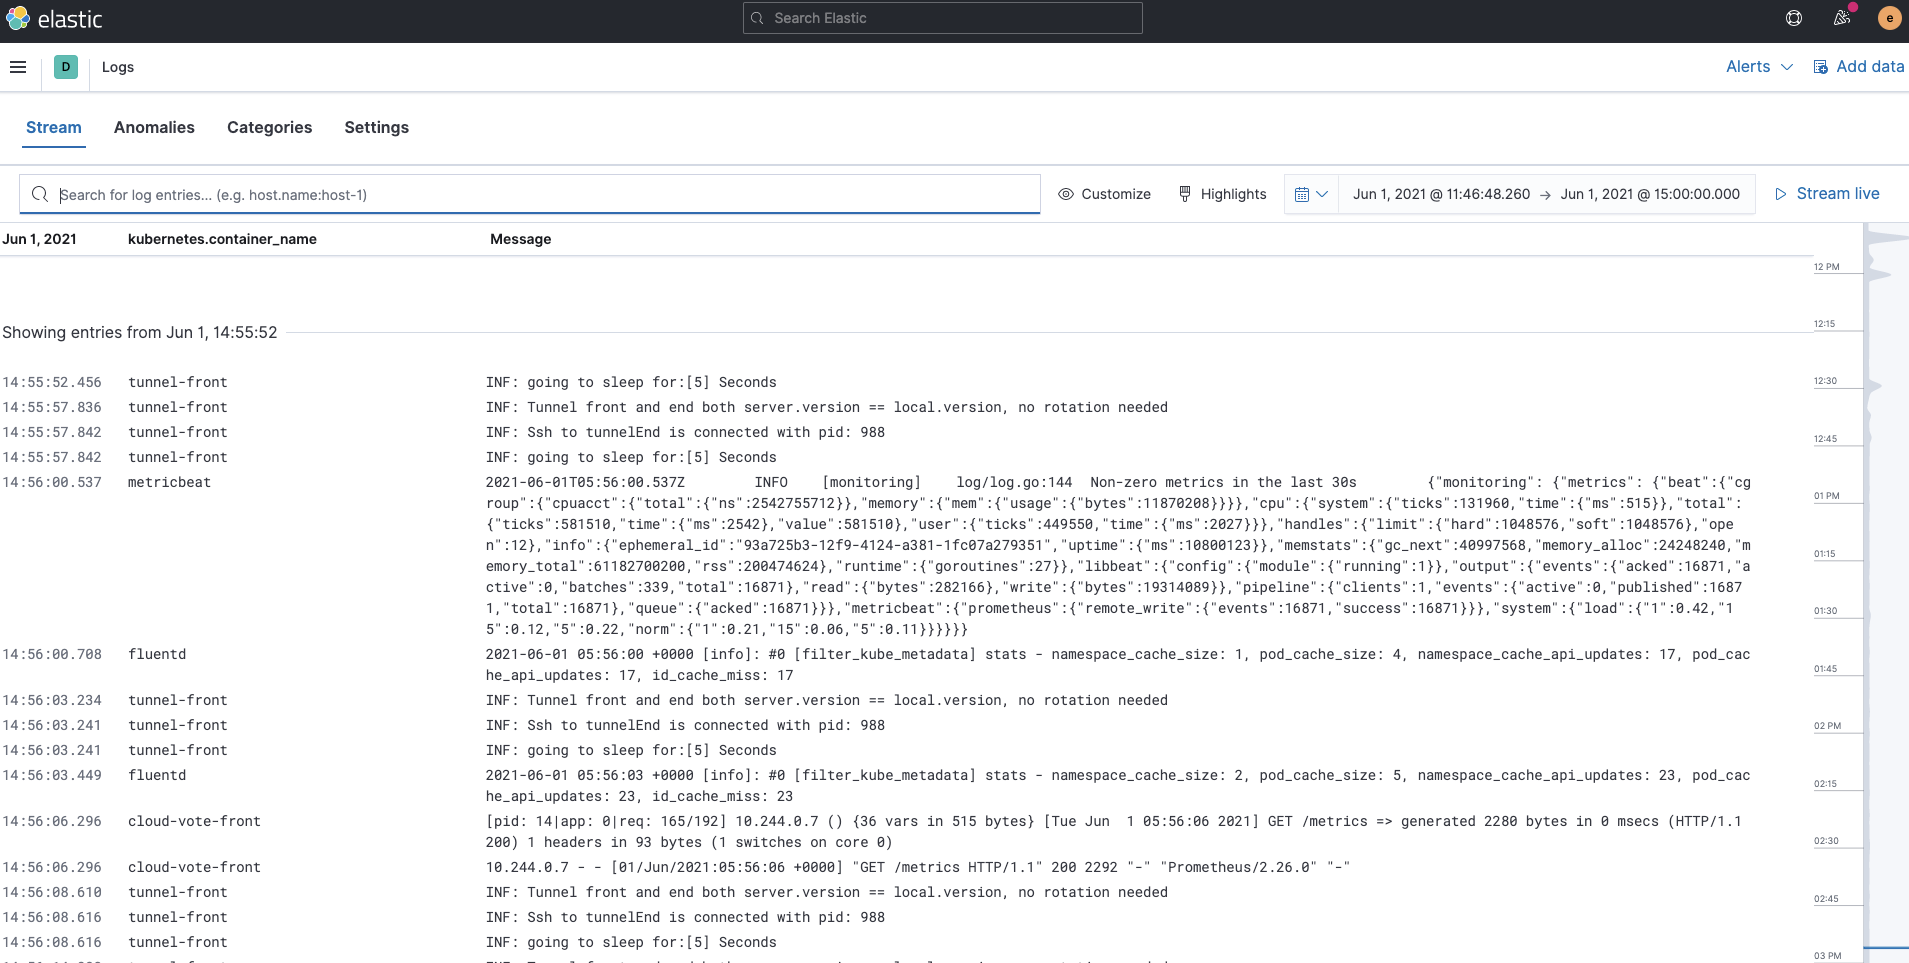
Also, the Logs app in Kibana allows you to search, filter, and tail all the logs collected into the Elastic Stack. Now all the Kubernetes container logs collected by Fluentd are available in one tool under the Logs app.
Metrics
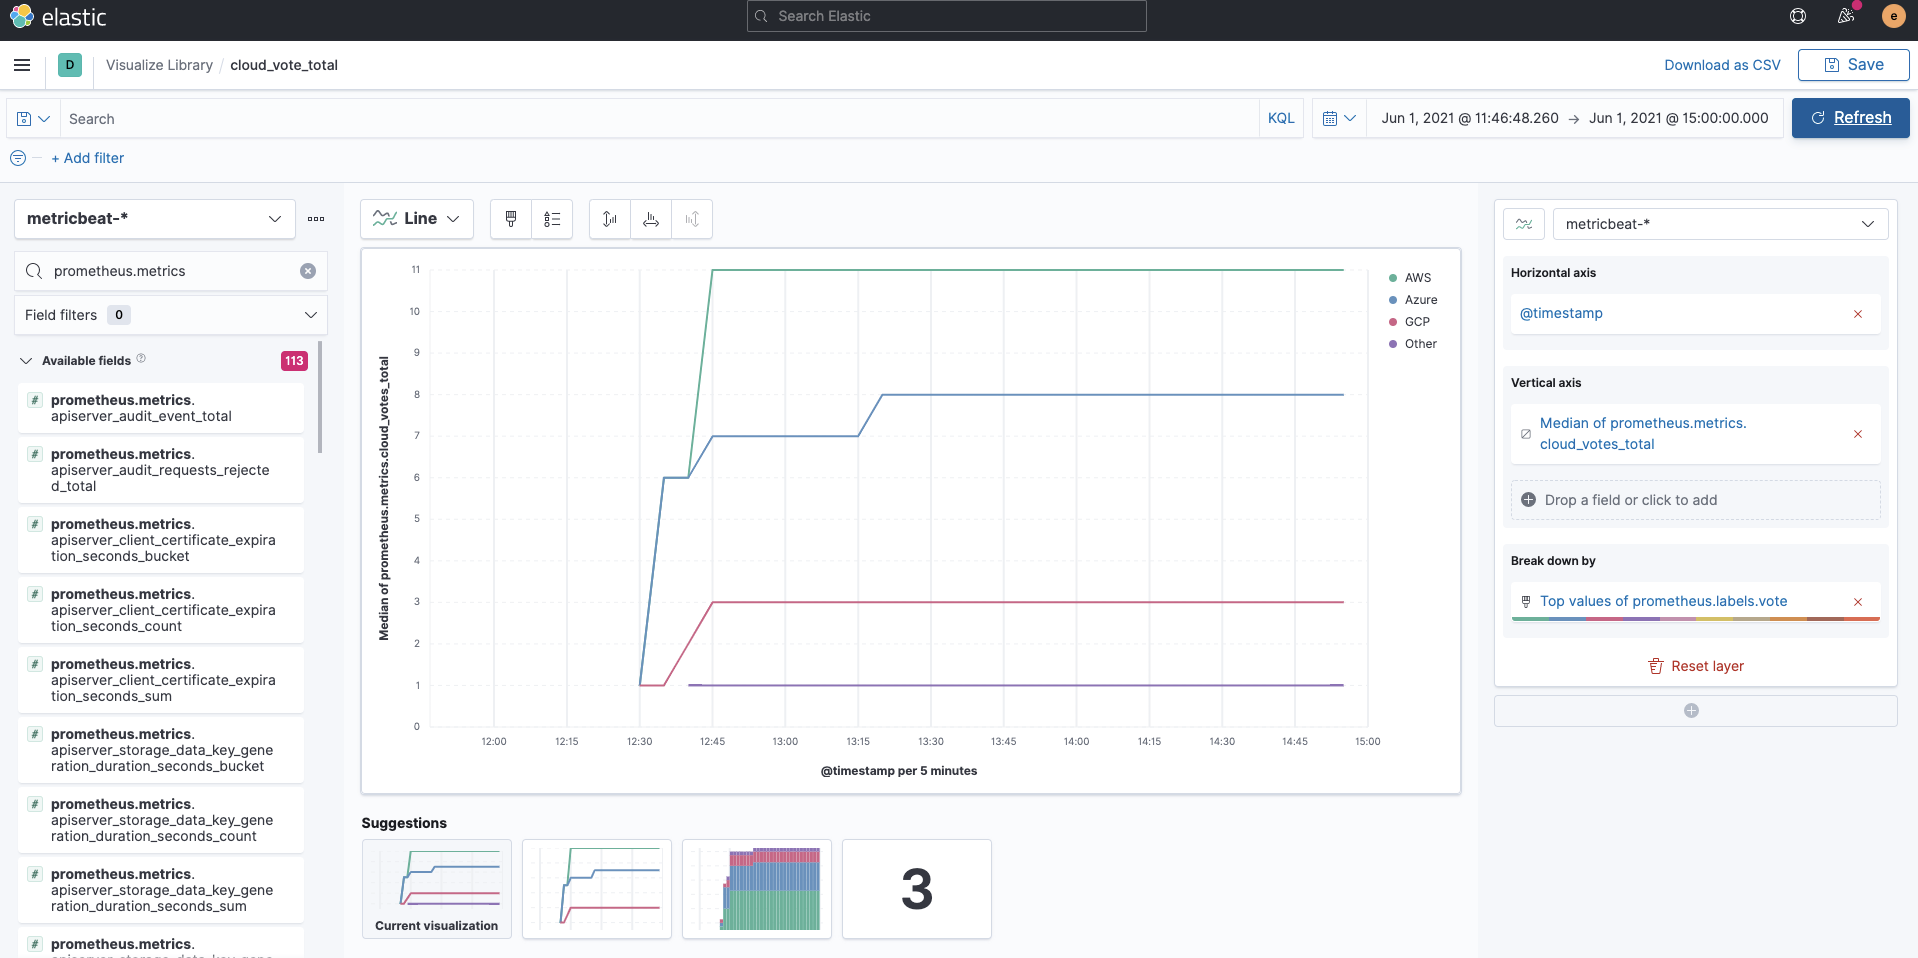
Metrics collected by Prometheus are stored in indices called metricbeat-* via Metricbeat. The Prometheus metrics are fields qualified with the prefix prometheus. Since they are regular metricbeat-* indices, you can easily visualize fields starting with prometheus using Kibana Lens as follows. The following example is a visualization of container_memory_usage_bytes for each labels.pod.
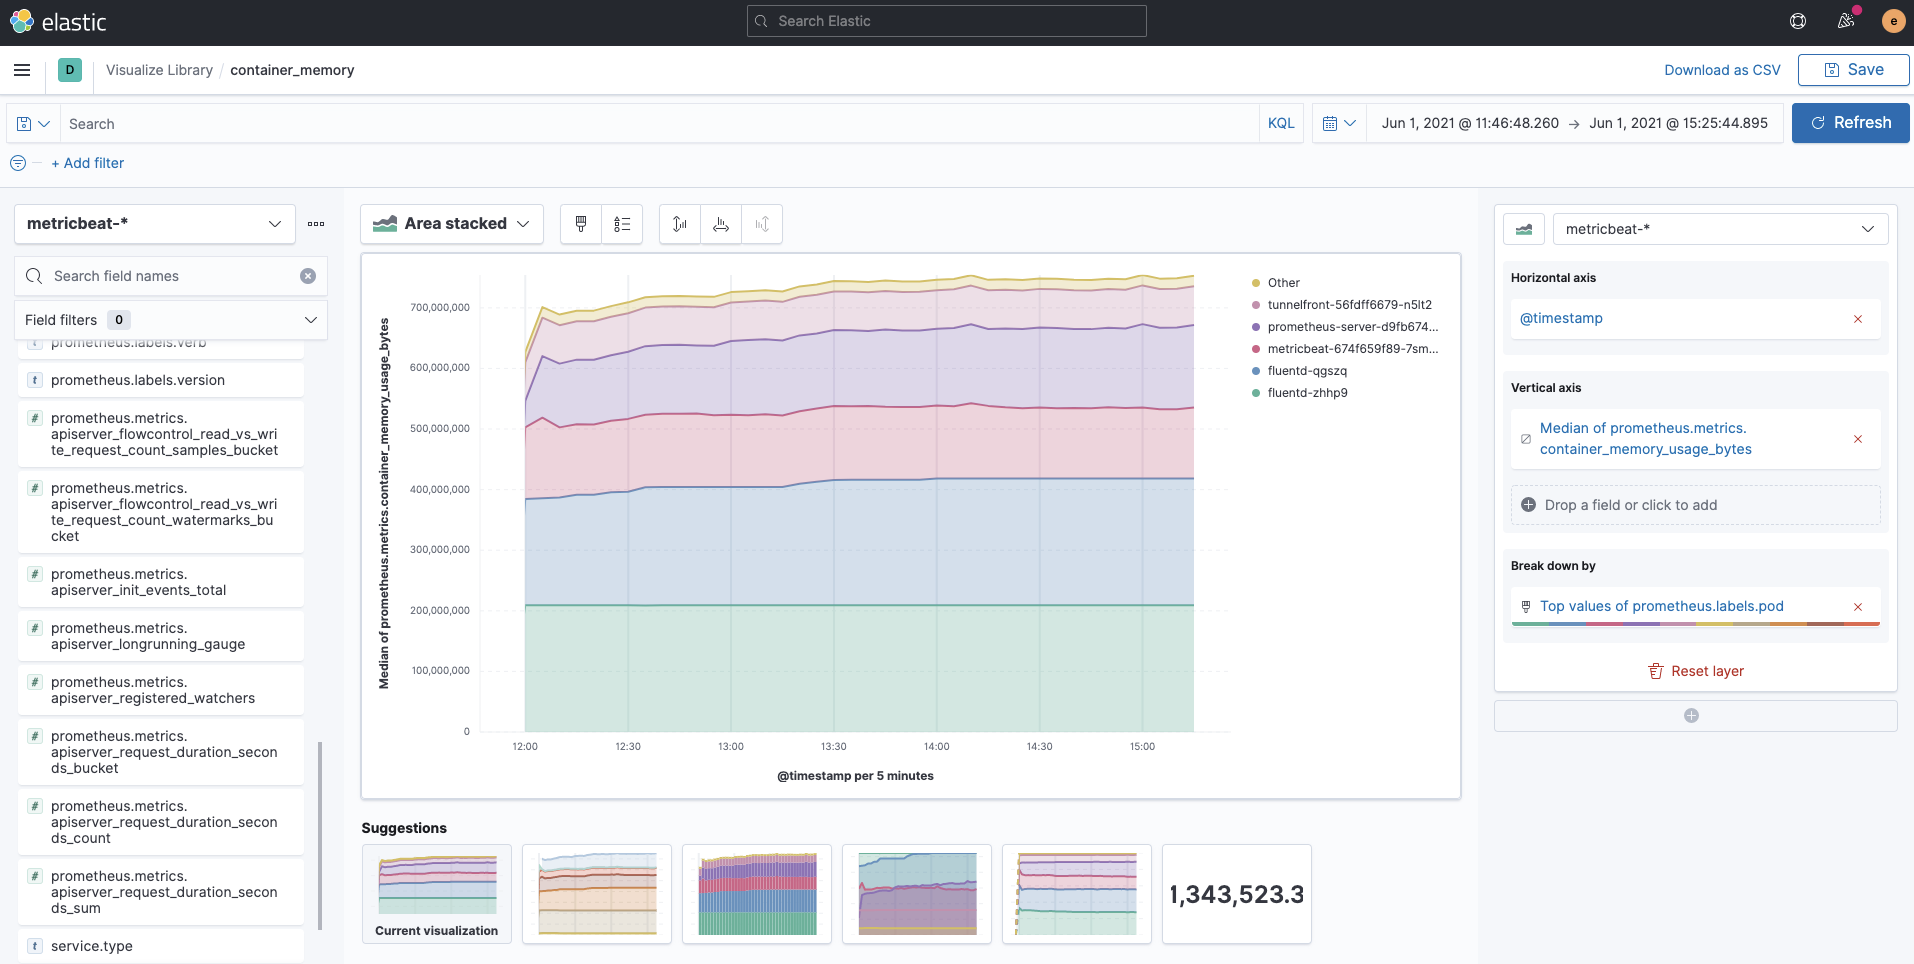
This is also the case for the application's custom metric cloud_vote_total. labels.vote shows each variable at POST.
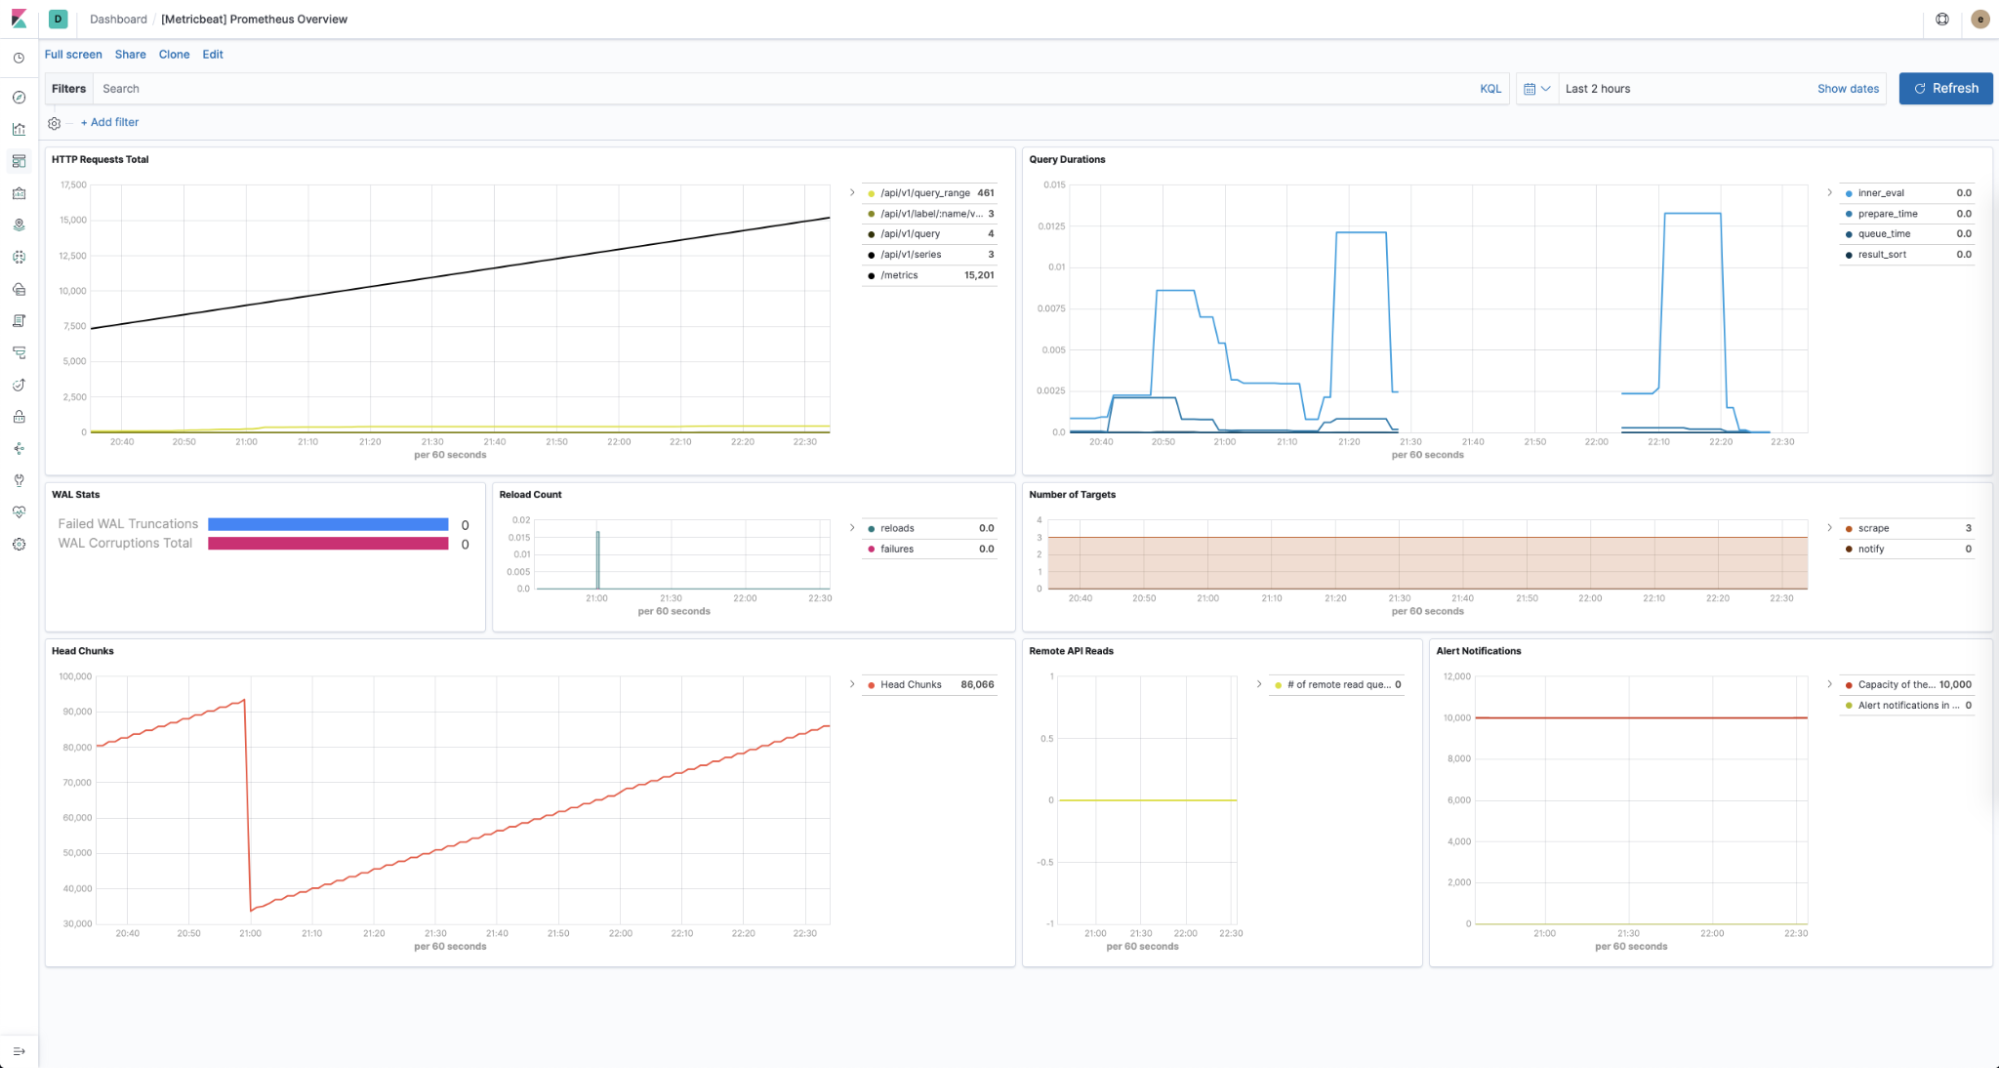
Metricbeat's Prometheus module allows you to use a predefined dashboard for Prometheus specific statistics without any configuration.
Alerting
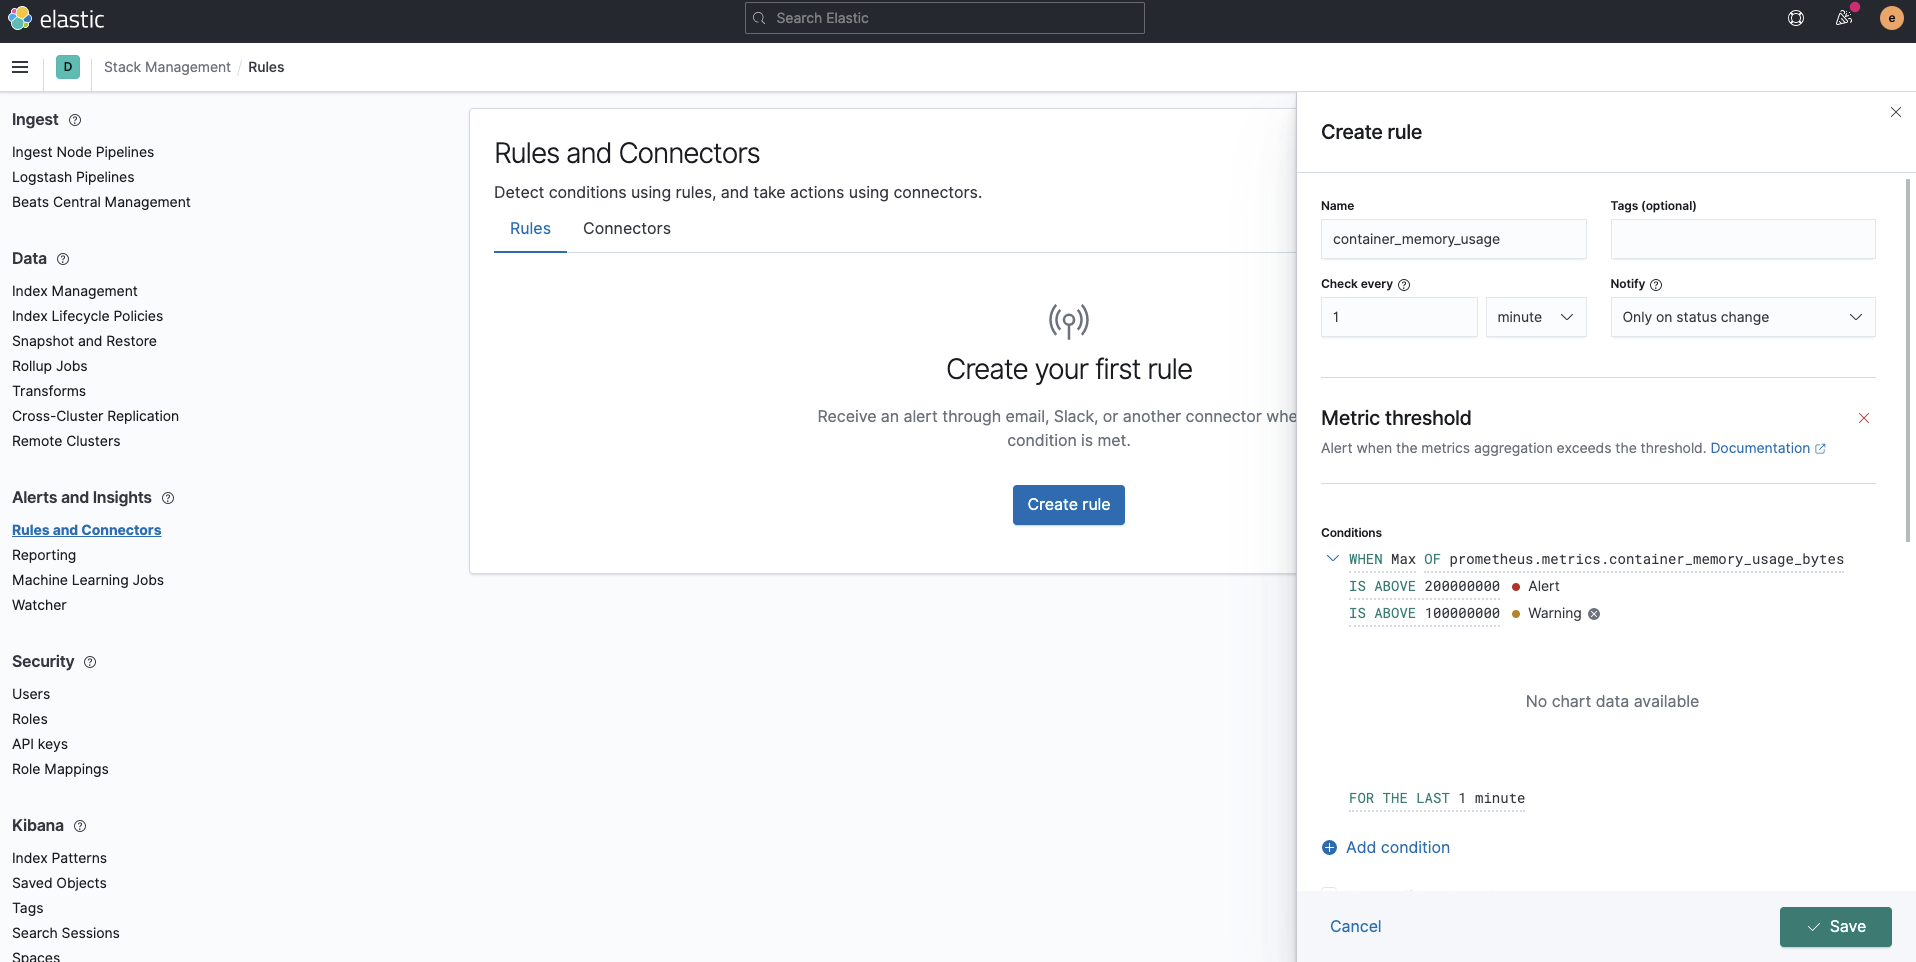
We have disabled Alertmanager when deploying Prometheus. If you collect logs and metrics in the Elastic Stack, you can fully utilize Kibana Alert as an alternative to Alertmanager to implement alerting. Not only can we utilize the metrics from Prometheus, all the data stored in Elasticsearch can be utilized, including logs and any other indices. Furthermore, advanced alerting using machine learning becomes possible with the Elastic Stack.
Summary
In this post, we saw how to use Fluentd and Prometheus to ingest logs and metrics into the Elastic Stack to monitor Kubernetes. You can start monitoring your Kubernetes environments today by signing up for a free trial of Elastic Cloud, or by downloading the Elastic Stack and hosting it yourself. If you're already using these free and open tools, you know that you can leverage the Elastic Stack to establish comprehensive observability. If you run into any hurdles or have questions, jump over to our Discuss forums — we're here to help.
In a future follow-up blog post, stay tuned for more ways to use Elastic for logs and metrics monitoring.