Monitoring MySQL, Percona Server, and MariaDB with the Elastic Stack
Databases are a fundamental keystone of most applications, and there are many options for many different use cases. Even a single database can be used in a variety of ways, but regardless of the database type, implementation, or use case, the need for a good solution for monitoring them remains a common denominator. Databases keep the most precious information of any company, and any hiccup can be a reason for alarm.
The majority of the most popular databases have a place in our solutions for logs and metrics, and we are continuously increasing our coverage by supporting more services and more versions. The first implementation of Metricbeat already included support for MySQL and Redis, and the recent 7.0 release came with a new module for Microsoft SQL Server.
MySQL has a long history of success. Being included in the popular LAMP stack made it incredibly popular, first between enthusiasts of new technologies wanting to use it for their websites and blogs, and then in the biggest companies that saw in it as a free solution that offered a new opportunity to scale with any kind of hardware.
MySQL modules for Metricbeat and Filebeat
Metricbeat and Filebeat have MySQL well covered from the metrics and logs monitoring perspective. Let’s look at Filebeat first.
Filebeat for MySQL
The Filebeat module for MySQL includes two filesets, one for the database error log and another one for the slow query log.
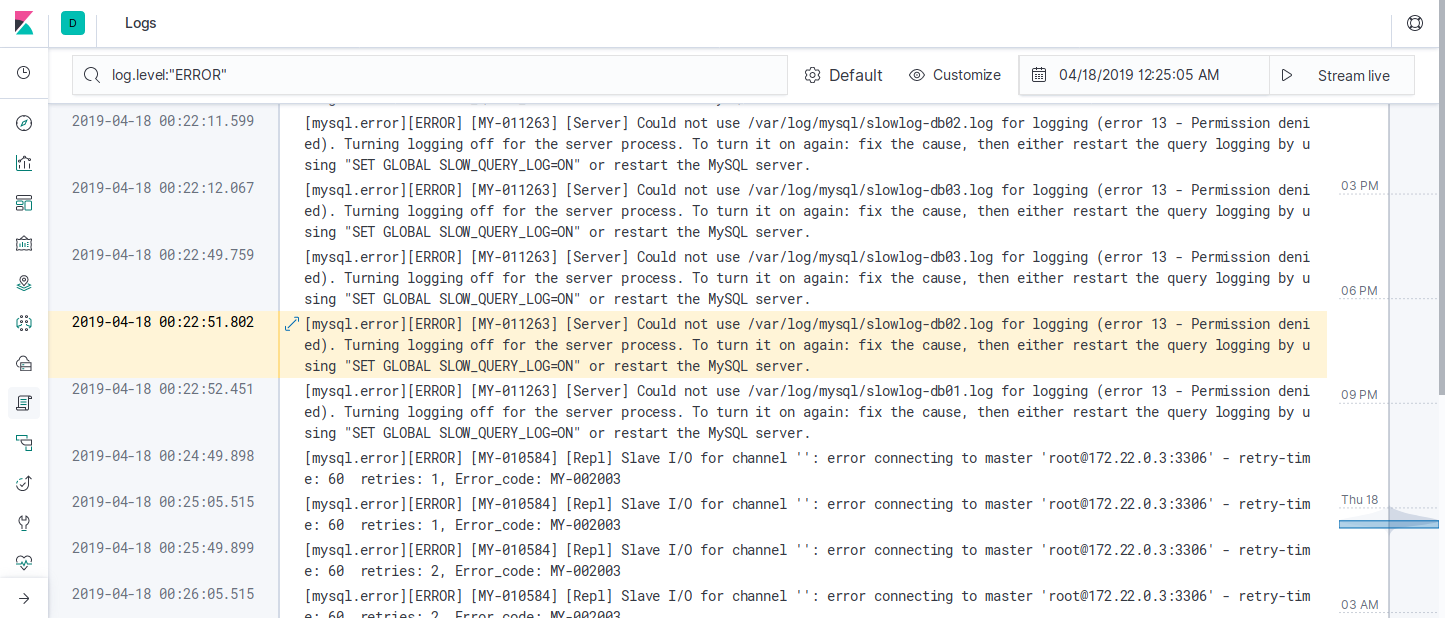
The MySQL error log contains a record of messages about the server startup and stop, and about some events that may happen while the service is running. This log is useful to diagnostic problems, it describes for example the reasons why some options cannot be applied, the causes of a replication failure, and it also informs when a table needs repair and if it could be automatically repaired.
The error fileset parses messages from the MySQL error log to extract the severity of the message and the thread that caused the problem. This information is helpful when monitoring several MySQL nodes, so you can focus on the more problematic messages or you can check how often certain problems occur.

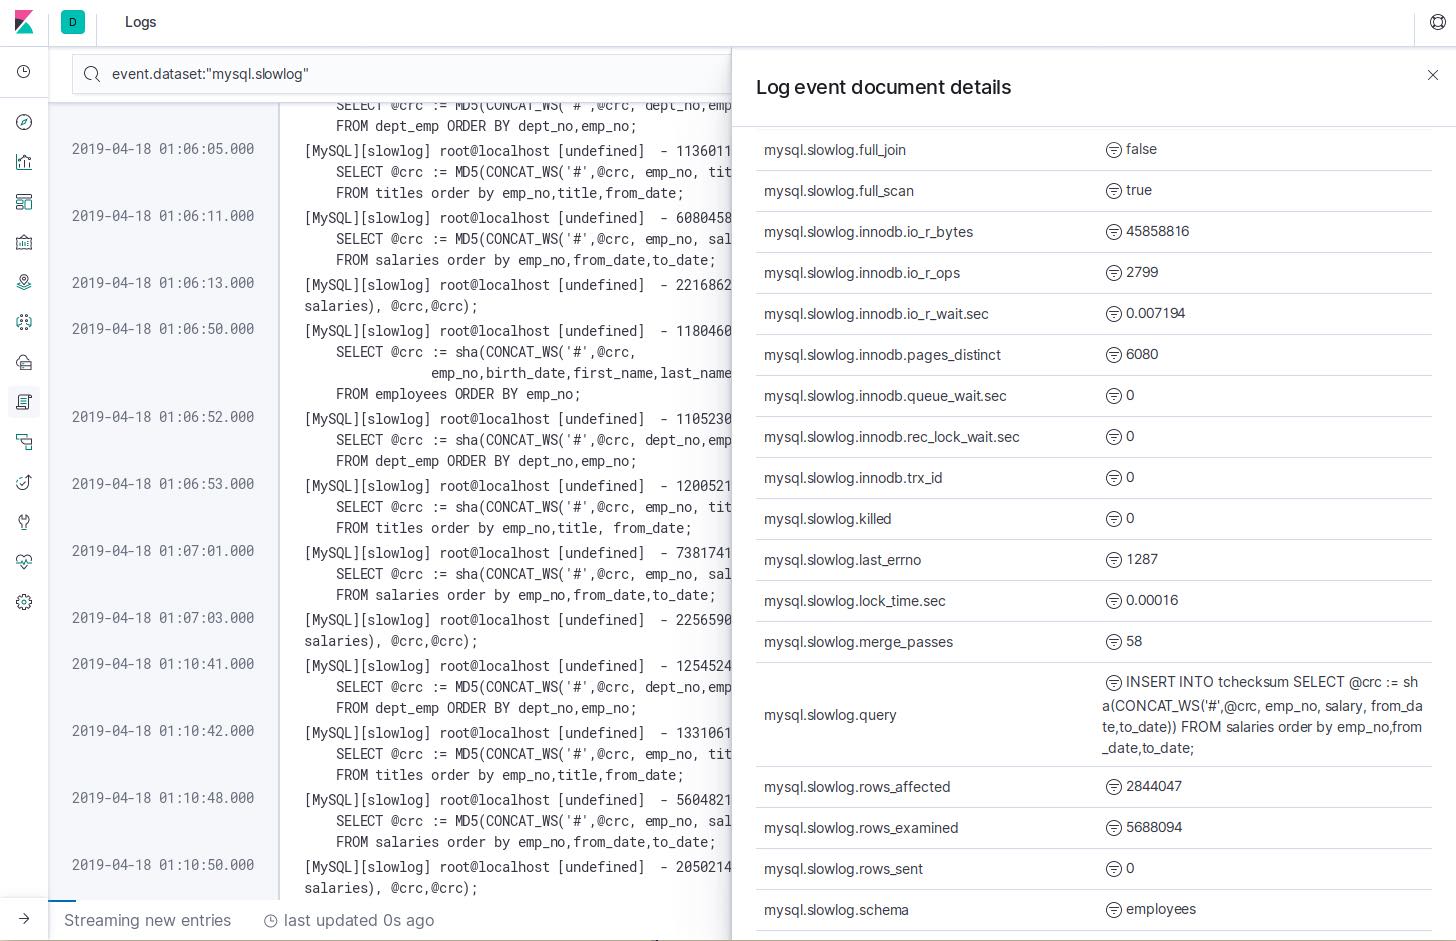
The slowlog fileset is very useful for identifying activities that are consuming a high amount of database resources. The slow query log is a very well known feature for MySQL DBAs, and it includes a lot of information about the most expensive queries, like the query itself, its duration, some basic metrics about rows affected and data transferred, and also detailed information about the optimizations that were applied. This feature can be configured to be more or less detailed and to include different sets of fields. Most of these fields are parsed by the slowlog fileset, giving the possibility of performing advanced analytics on this information, allowing you to detect and take early decisions on specific queries that can be problematic for your applications and your databases.

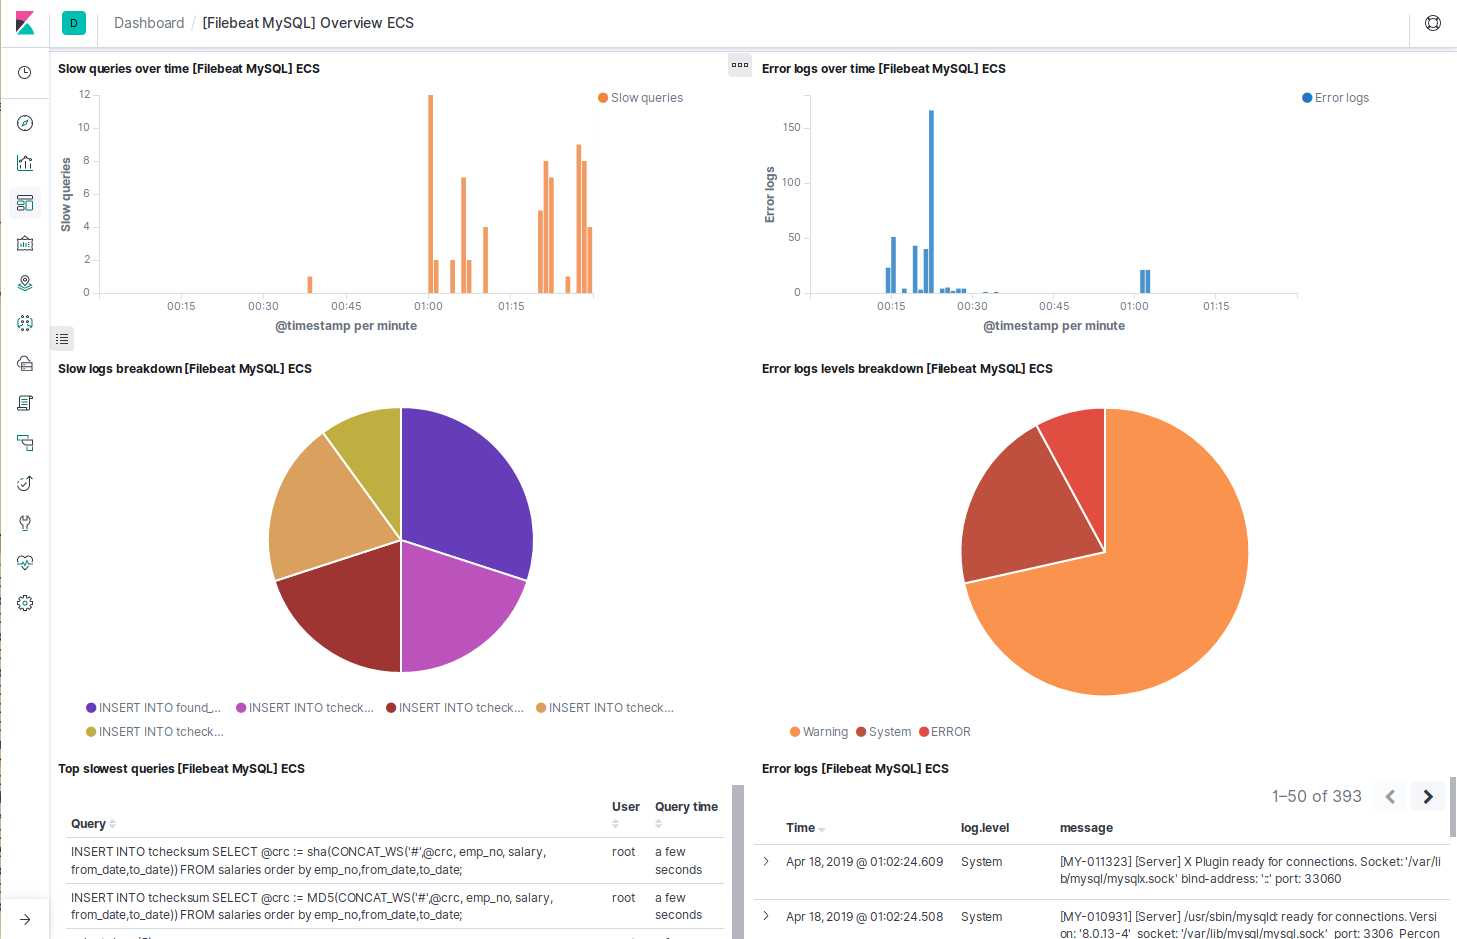
In the preconfigured dashboard, both filesets are combined to give an overview of the messages being reported by all the MySQL instances:

Metricbeat for MySQL
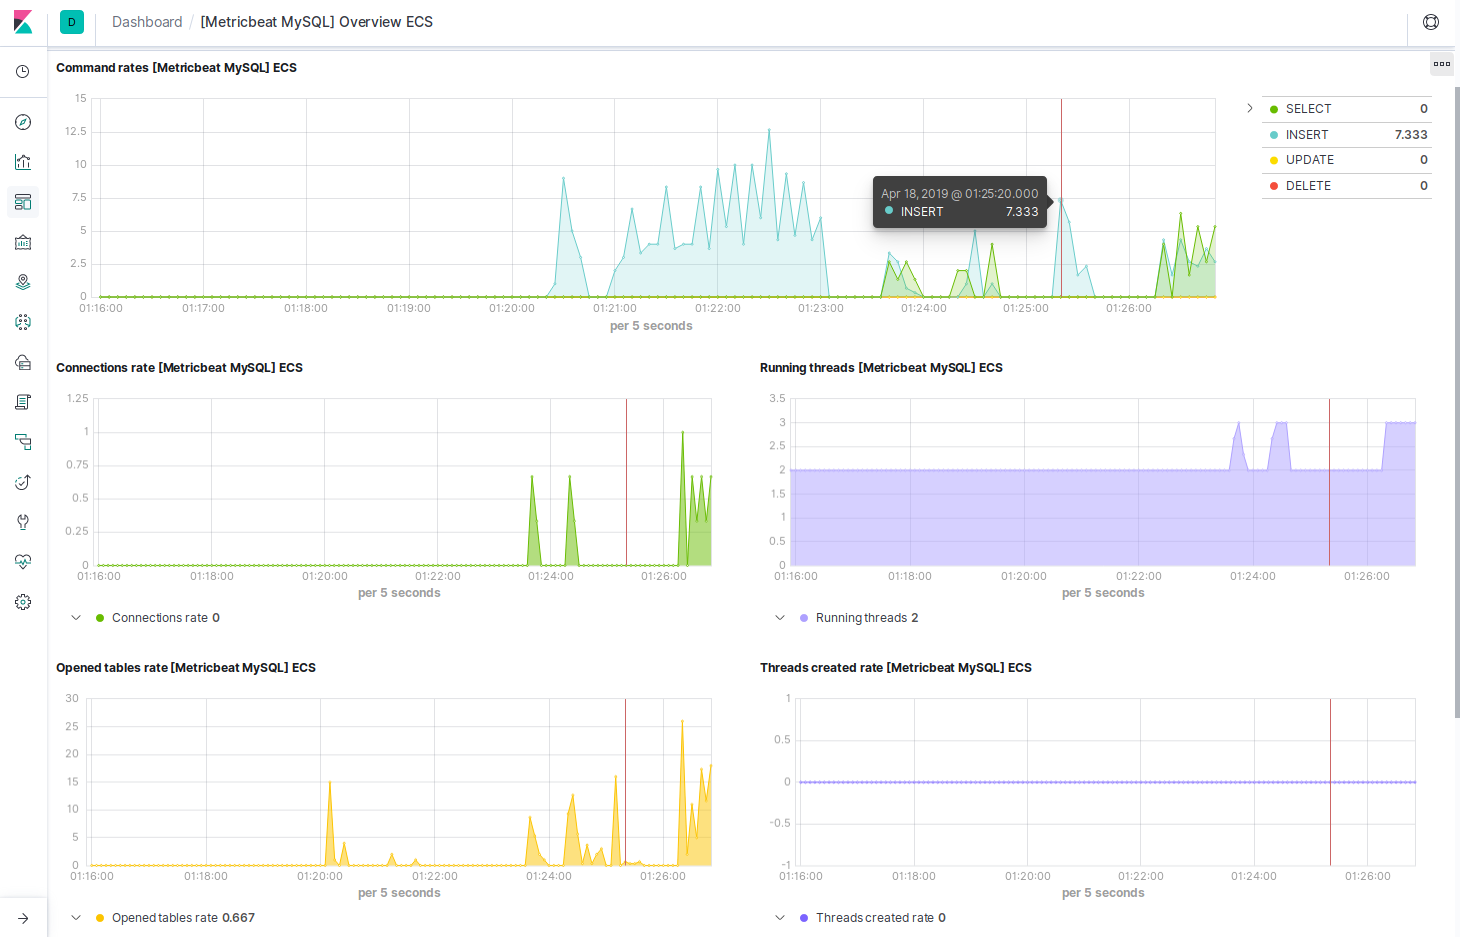
The Metricbeat module for MySQL collects information from the SHOW GLOBAL STATUS; query. This query is the most important provider of information about the status of a server, it includes many metrics about connections, threads, network, replication binlog, types of queries executed, etc. The most important of these metrics are collected by Metricbeat, so they can be used to monitor the status of your servers or take capacity decisions.
It also includes a dashboard that offers a view on time of the most important fields:

MySQL friends: Percona and MariaDB
As mentioned before, MySQL has a story of success. From the original open source project, a whole community and ecosystem of several companies has grown up.
Percona is one of the best known companies in the MySQL ecosystem. It is the developer of many solutions based on MySQL, including their own distribution of MySQL, curated for performance and security. Percona Server for MySQL includes backports of new features and bug fixes, as well as specific features to improve instrumentation and many other things. It is intended to be a drop-in replacement of MySQL server.
MySQL AB, the company behind MySQL was acquired in 2008 by Sun Microsystems, which was later acquired by Oracle Corporation. These movements created some concerns in the community, prompting the creation of MariaDB as a fork of the original project. MariaDB is intended to remain free and open source under the GPL license, and is currently maintained by the MariaDB Foundation. Even if it is still in part compatible with MySQL server, it has completely different implementations of some features and it has its own release cycles. At the moment it is the default MySQL distribution in some Linux distributions and is offered by many cloud providers.
In Metricbeat and Filebeat 6.7, we started to run our tests also on Percona and MariaDB, which allowed us to identify new sources of information. Since then we have increased the number of fields collected by the slowlog fileset, allowing even more insightful analysis of the slow query log.
Metricbeat and Filebeat 7.0 are compatible with MySQL, Percona Server, and MariaDB.
And last but not least, Metricbeat also has experimental support for the collection of Galera-specific metrics. Galera is a solution for multi-master clustering of MySQL servers. Our current implementation, the galera_status metricset, is heavily based on the status metricset but is not very well tested at the moment. Contributions and feedback are very welcome.
MySQL 8 and beyond
Before 6.7 we were only testing the MySQL modules with MySQL 5.7 and with some log cases of MySQL 5.5, since then we have increased the coverage to support also MySQL 8.0, and the same versions of Percona Server. We now include tests on MariaDB 10.2 and 10.3.
Recent versions of MySQL and Percona include stronger authentication methods, so we have updated our MySQL clients to support them.
In the future we have plans to continue updating our modules to follow the latest developments of all these products.
If you want to get more visibility into your MySQL servers with the Elastic Stack also take a look at:
- Elastic APM - Allows you to instrument your applications to know, for example, how much time they spend querying your database servers
- Packetbeat - Ingests MySQL information from network connections
Getting started is easy, simply download an install Metricbeat and Filebeat, enable the appropriate module, and start sending your data to your local cluster, or to your 14-day free trial of Elasticsearch Service on Elastic Cloud. If you have any questions or ideas about how we can improve, reach out on the Discuss forums. Enjoy!