Optimize the cost of storing logs in Elastic Cloud with a hot frozen data tier lifecycle
.jpg)
Collecting data is crucial for observability and security, and ensuring it is quickly searchable with low-latency results is essential for managing and protecting applications and infrastructure effectively. However, storing all of this data incurs ongoing storage costs, creating a key opportunity for cost savings. In Elastic Cloud, you can optimize storage expenses by setting up an index lifecycle policy. This policy allows your data to move from the hot data tier — which provides ultra-fast search results with higher storage costs — to the cost-efficient frozen tier — which remains searchable with reasonably quick results.
For instance, storing 90 days’ worth of logs in a deployment with a single hot tier will give you the best performance, as you would expect from Elasticsearch. But in many cases, you don't need that super fast performance on all data. Sometimes, you just need the first day to be fast; past logs can be just a little slower to retrieve. This approach will significantly reduce your total cost of ownership since the frozen tier can store up to 20 times the amount of data as the hot tier at the same cost.

Let’s dive in. Follow along with this step-by-step guide on creating a hot frozen index lifecycle policy for your logs data.
Prerequisites
An Elastic Cloud deployment with a frozen data tier
A local computer or a Virtual Machine (VM) running in the cloud from which we’ll ingest a logs data stream with the System integration — one of Elastic’s 400+ built-in integrations
Create an Elastic Cloud deployment
Starting with the creation of an Elastic Cloud deployment, we’ll install the System integration on a VM running in Google Cloud to collect the VM’s logs. Then, we’ll walk through the process of configuring the VM’s logs stored in Elastic Cloud to use the hot and frozen data tiers. Log in to Elastic Cloud to begin.
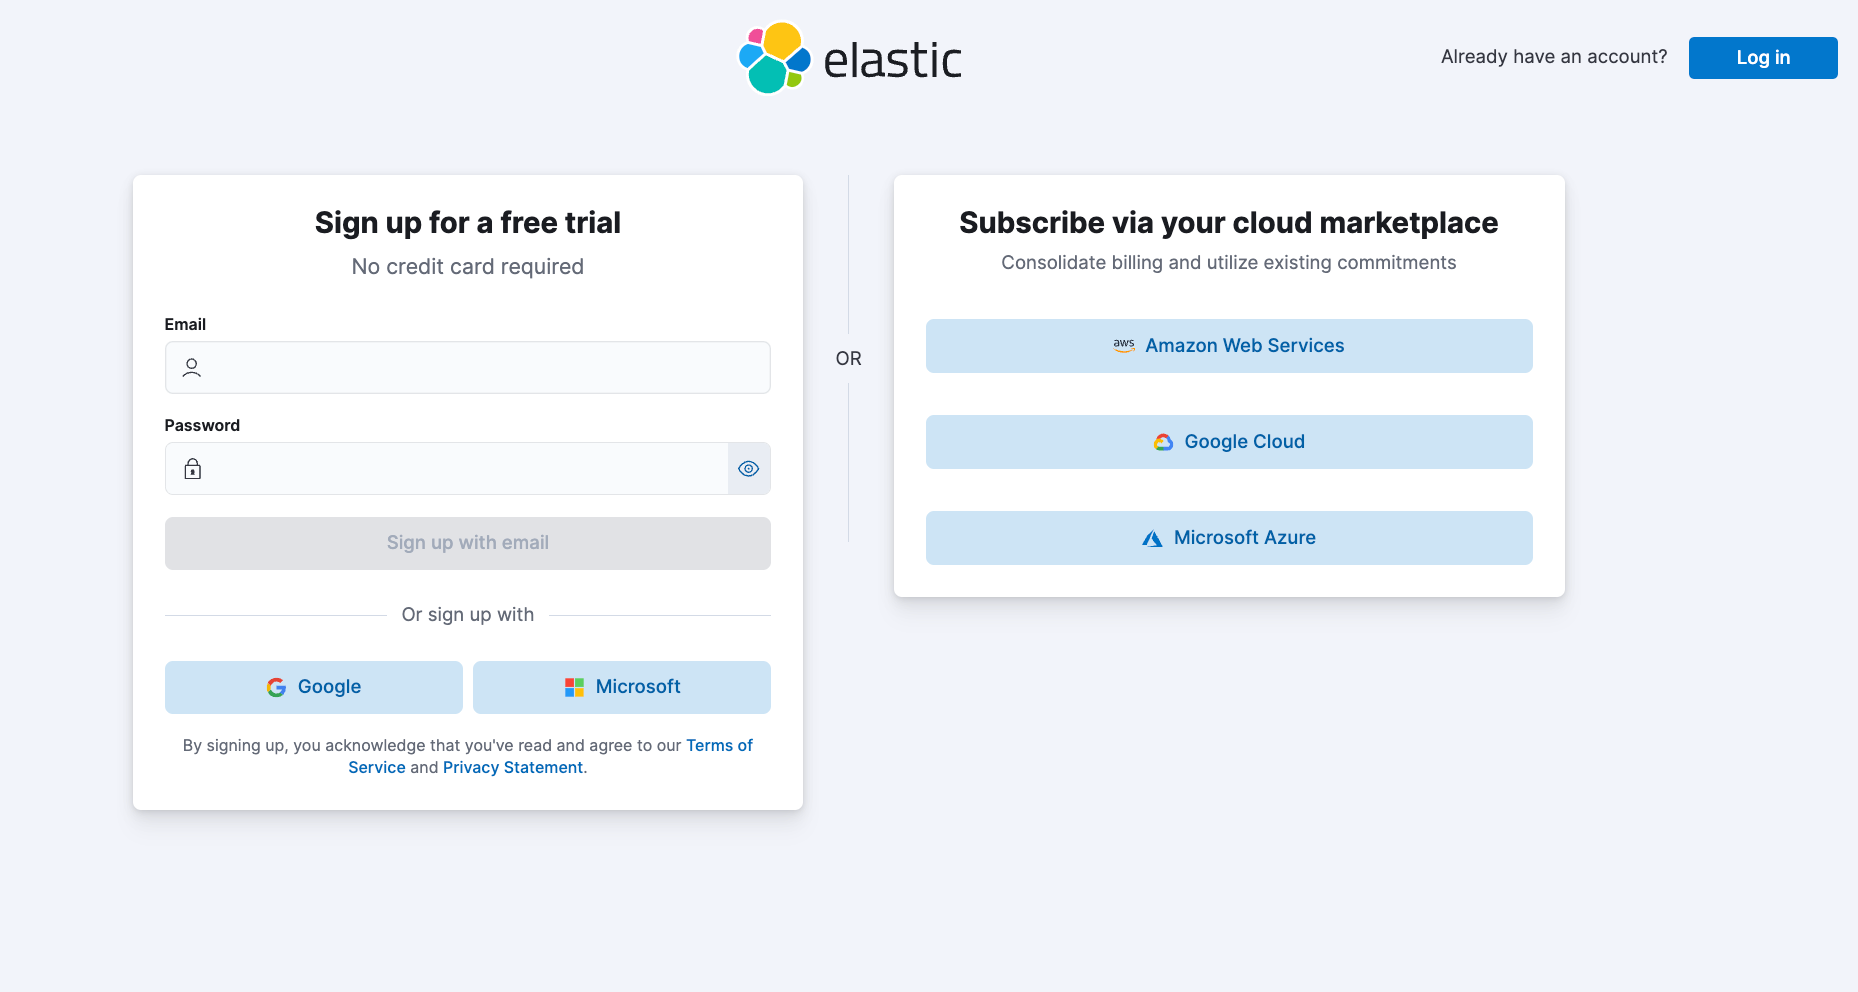
Click Create deployment.

Enter a name for your deployment and expand the Advanced section.
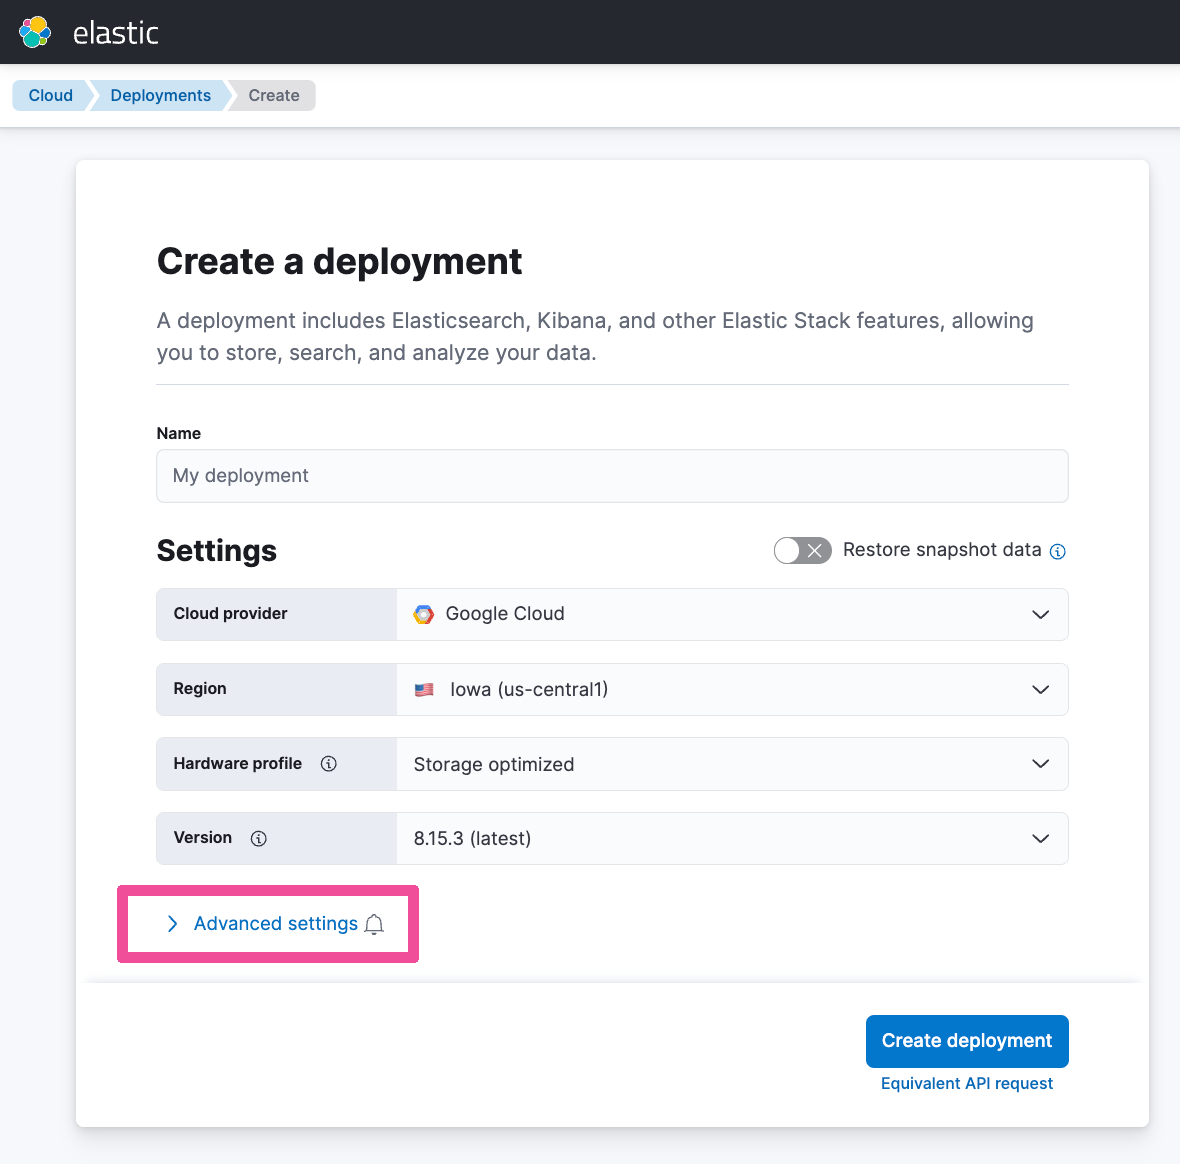
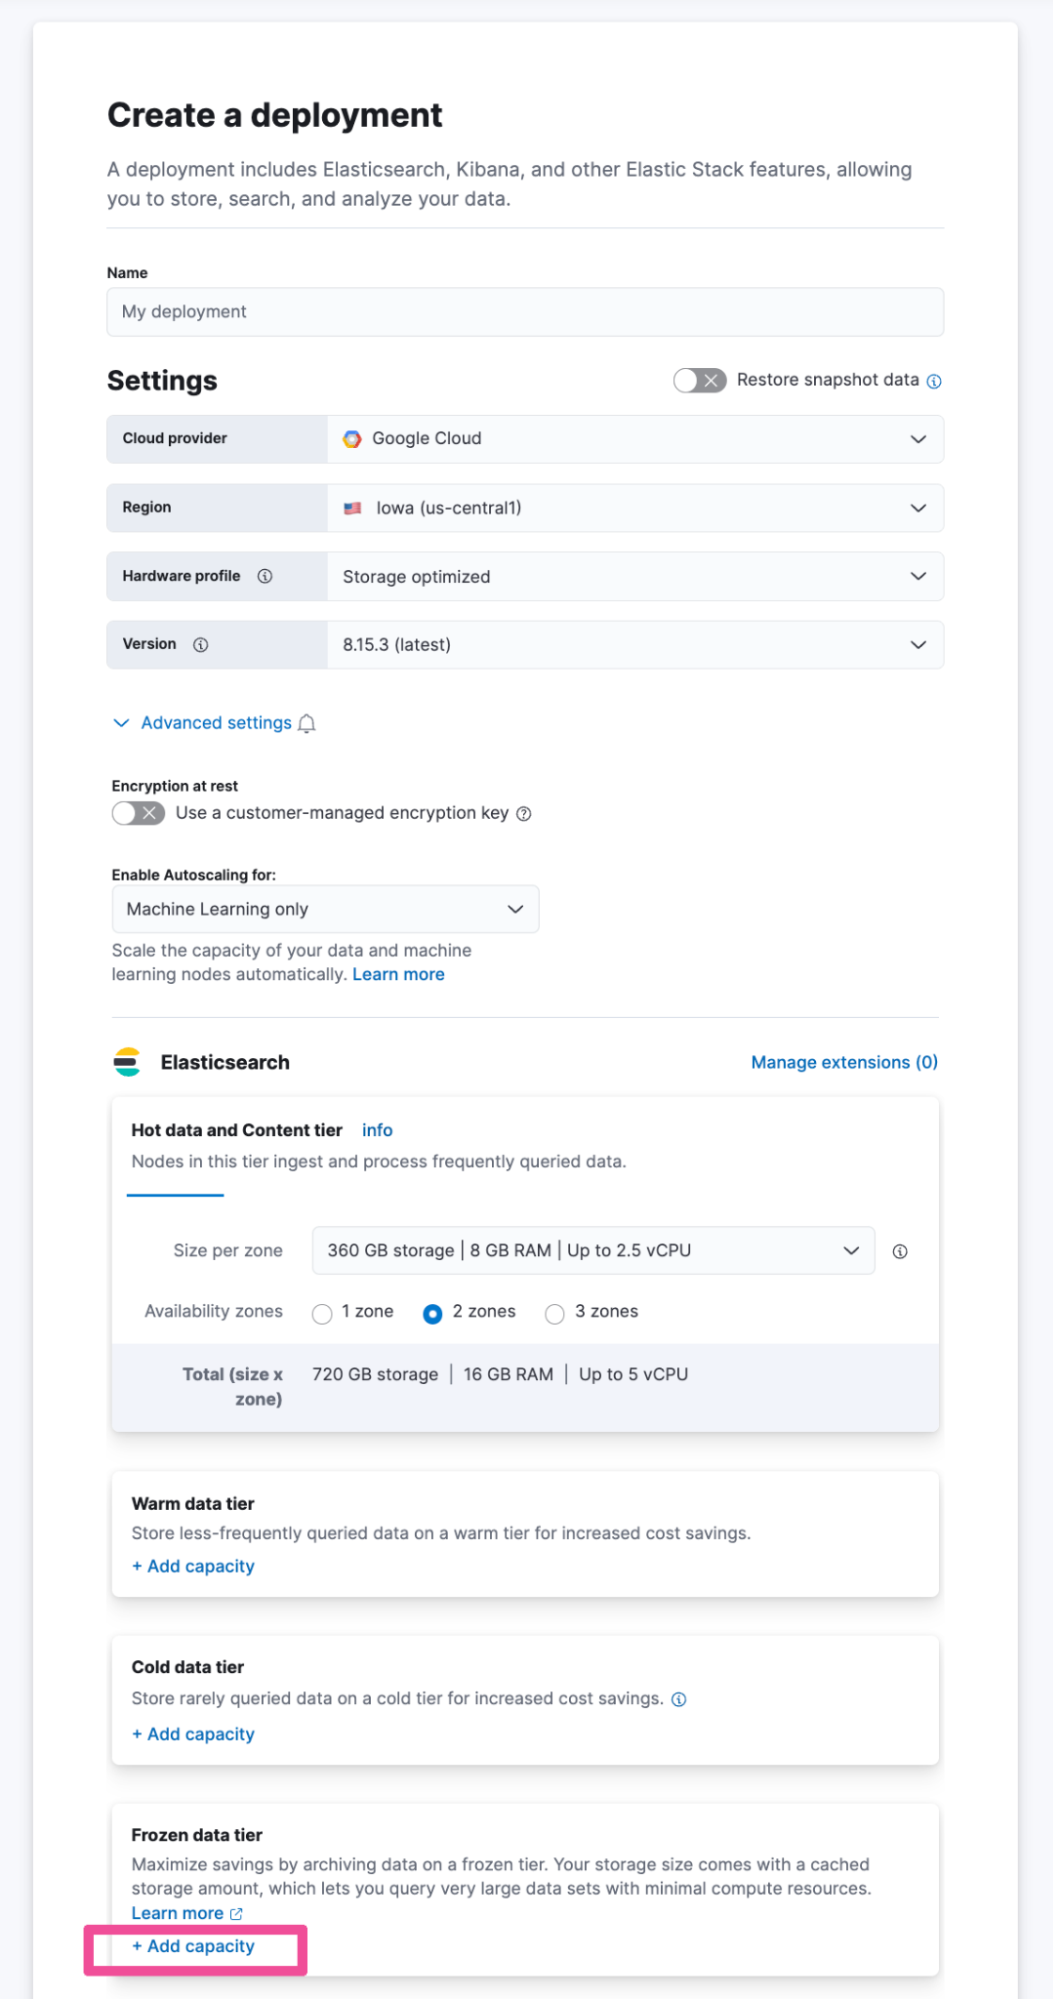
Click the +Add capacity for the Frozen data tier.
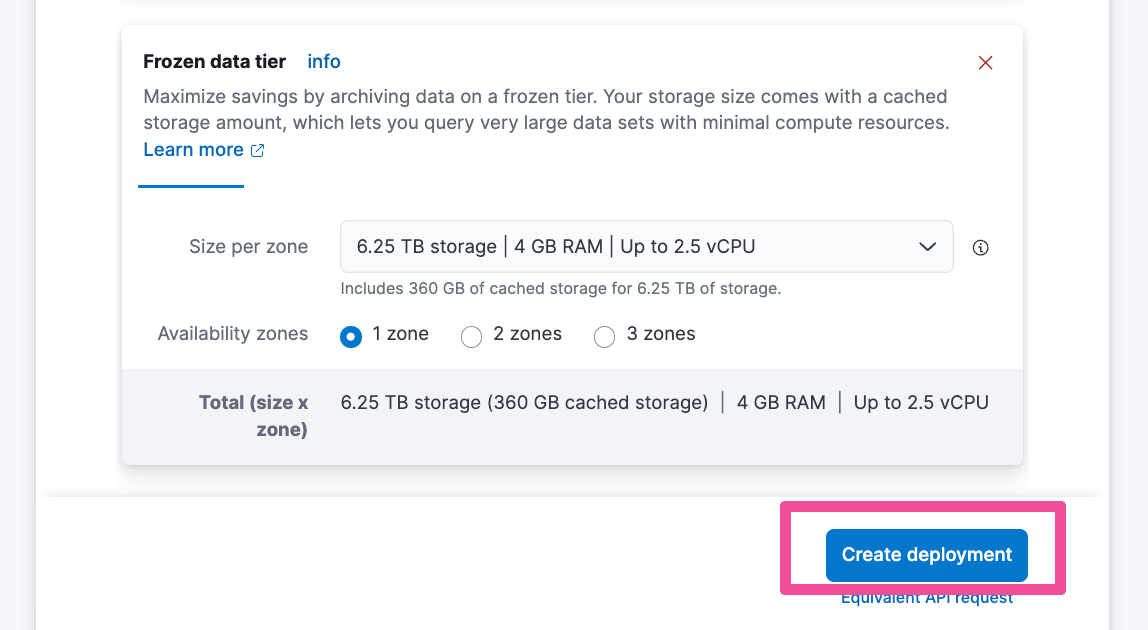
Click Create deployment.
Collect logs
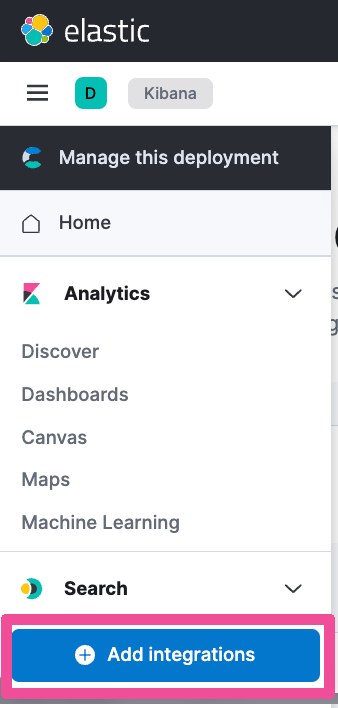
Now that you’ve got an Elastic Cloud deployment with the frozen data tier enabled, let’s collect some logs. We can do this using the Systems integration. Inside your deployment, click the top-level menu and select the Add integrations button.
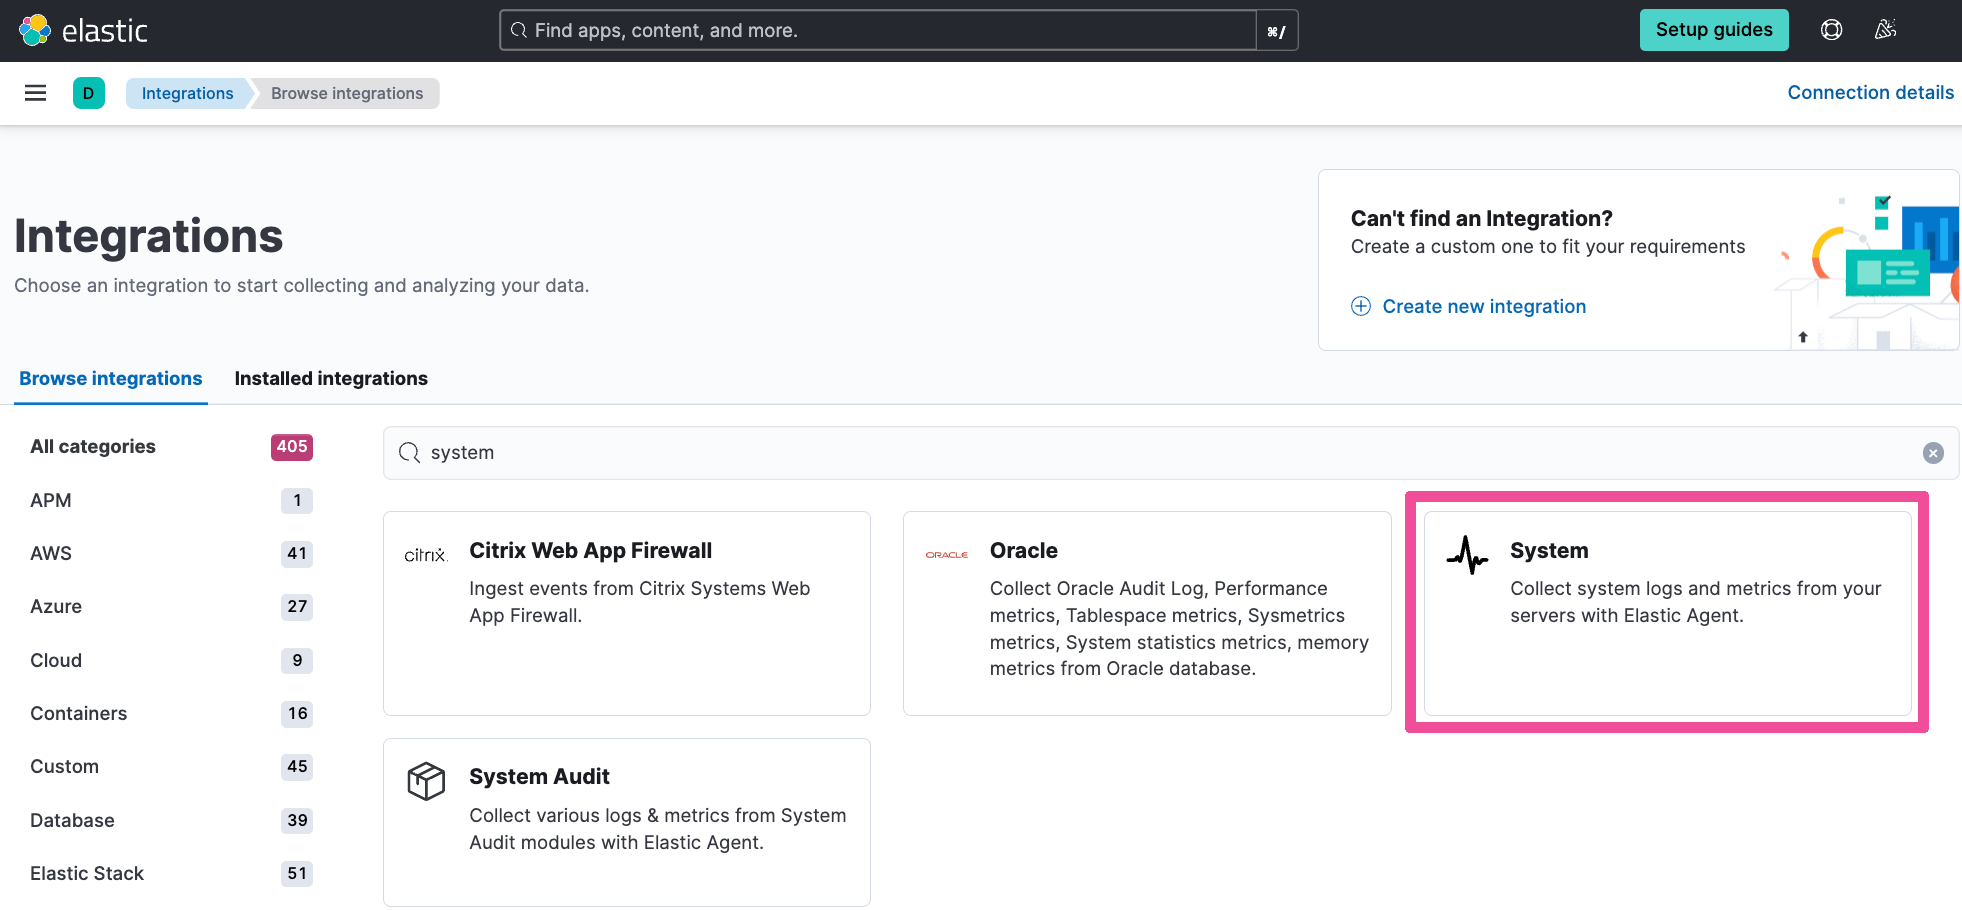
Here, on the Integrations page, you can see that I’ve searched for the System integration.
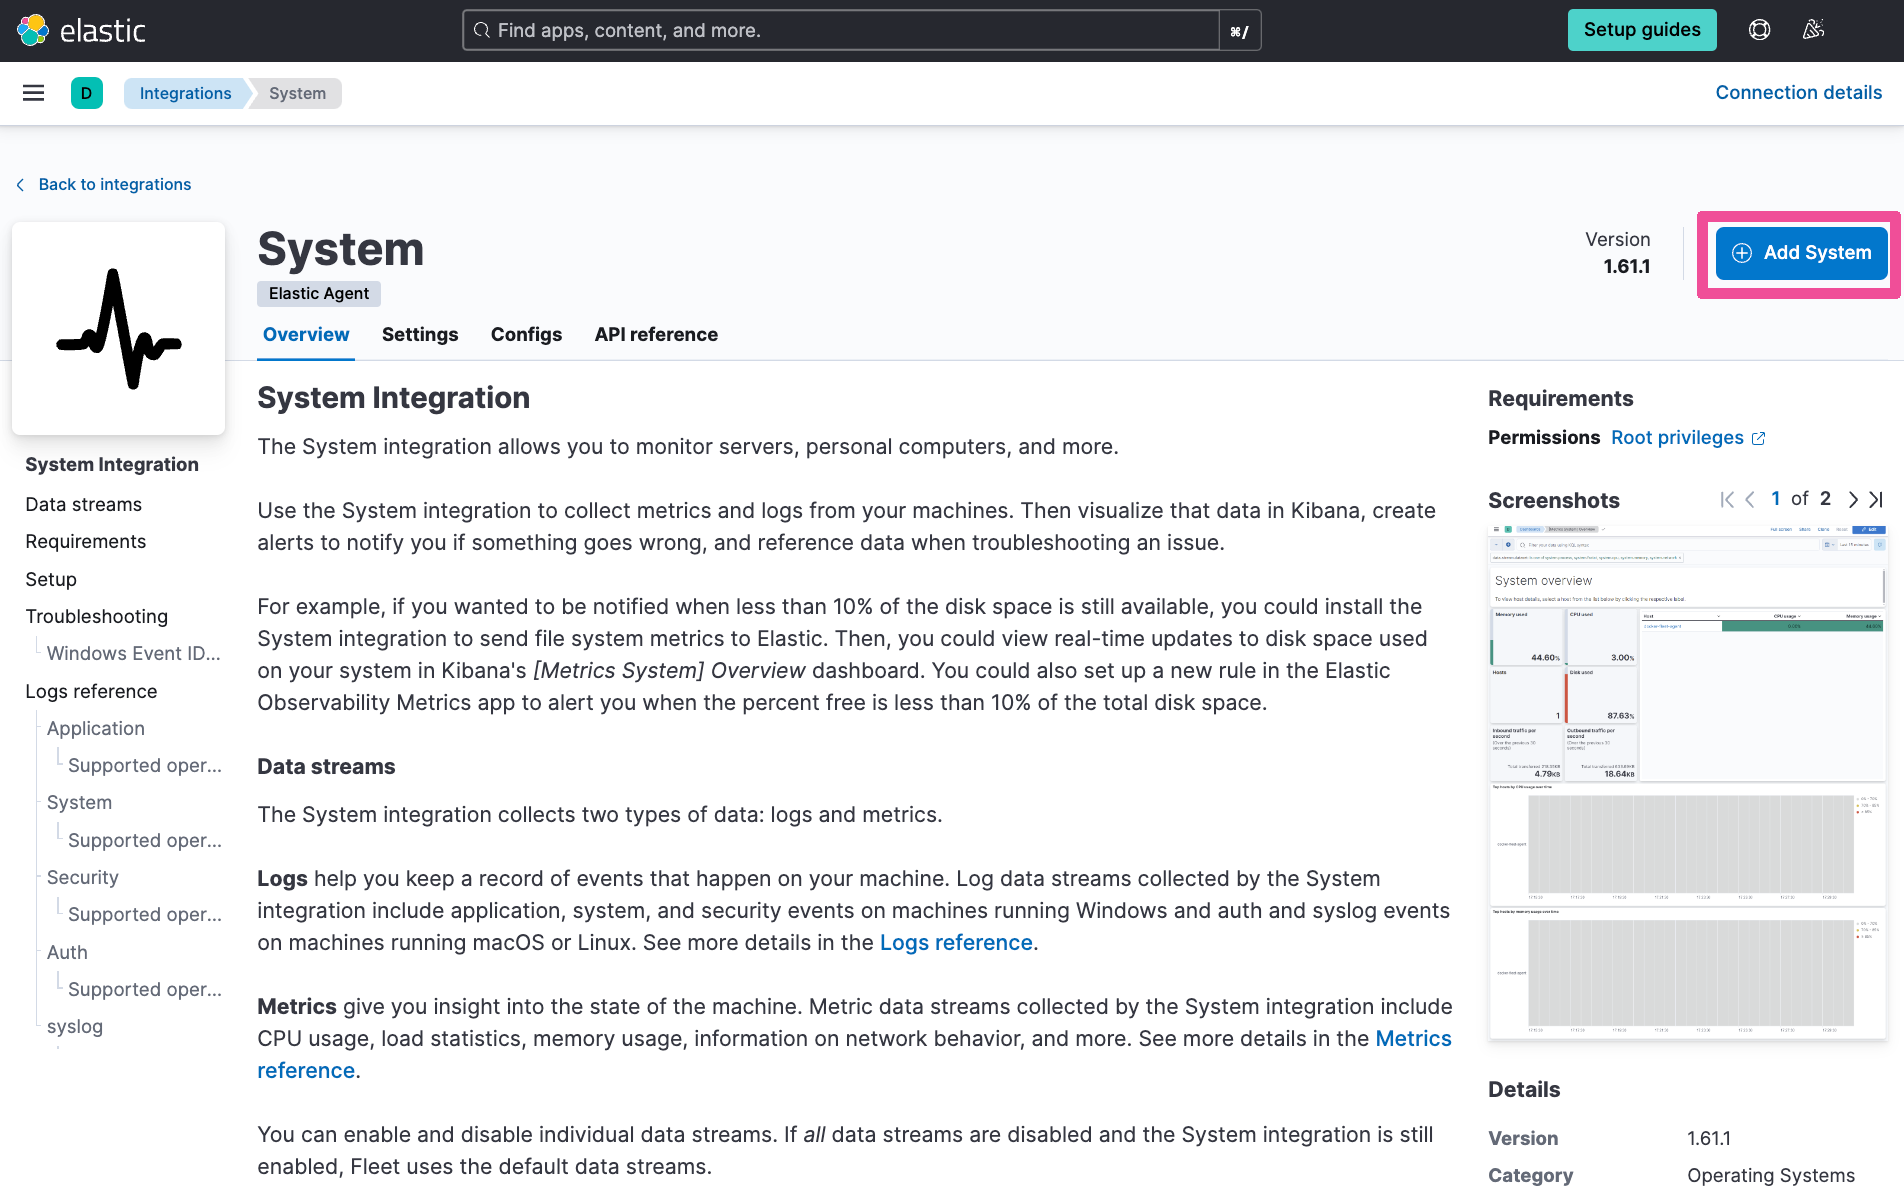
Selecting the System integration shows its overview page. To add this integration to a client host computer, you can click on Add System.
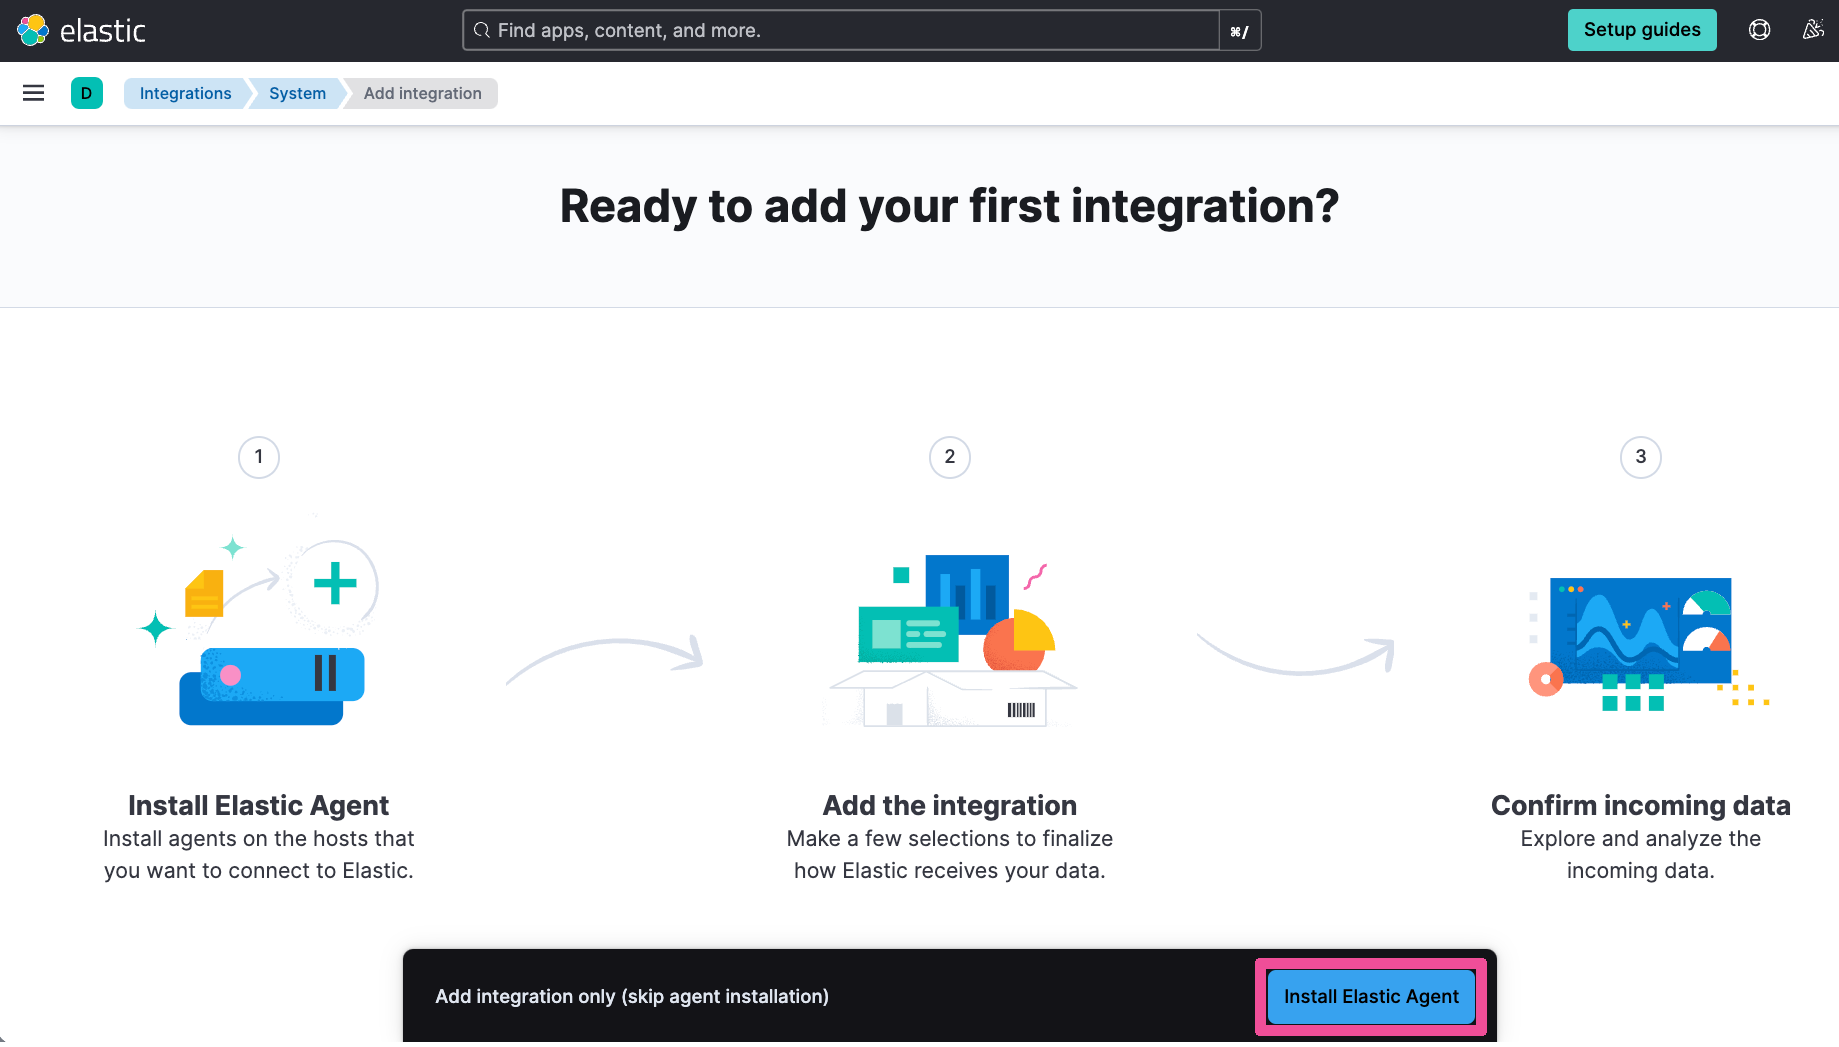
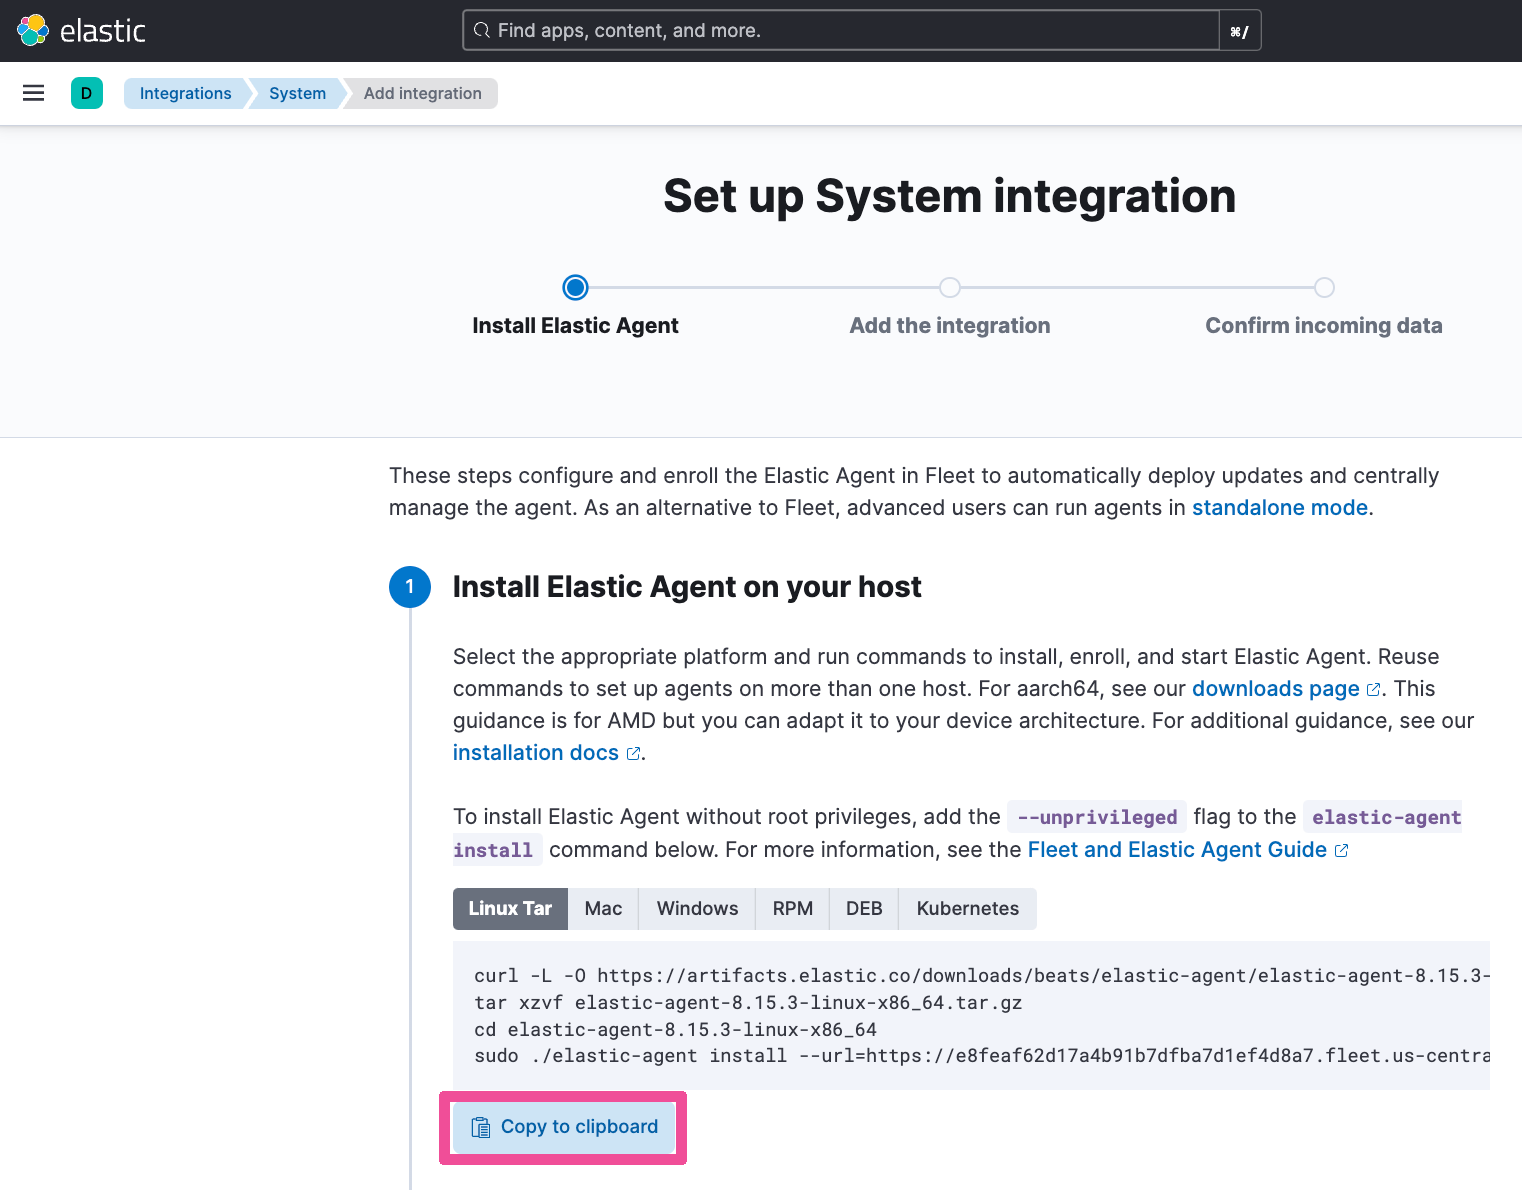
Click Install Elastic Agent.
Copy the Agent installation code. We’ll copy the code under the Linux Tar tab since our cloud VM is running a version of Linux.
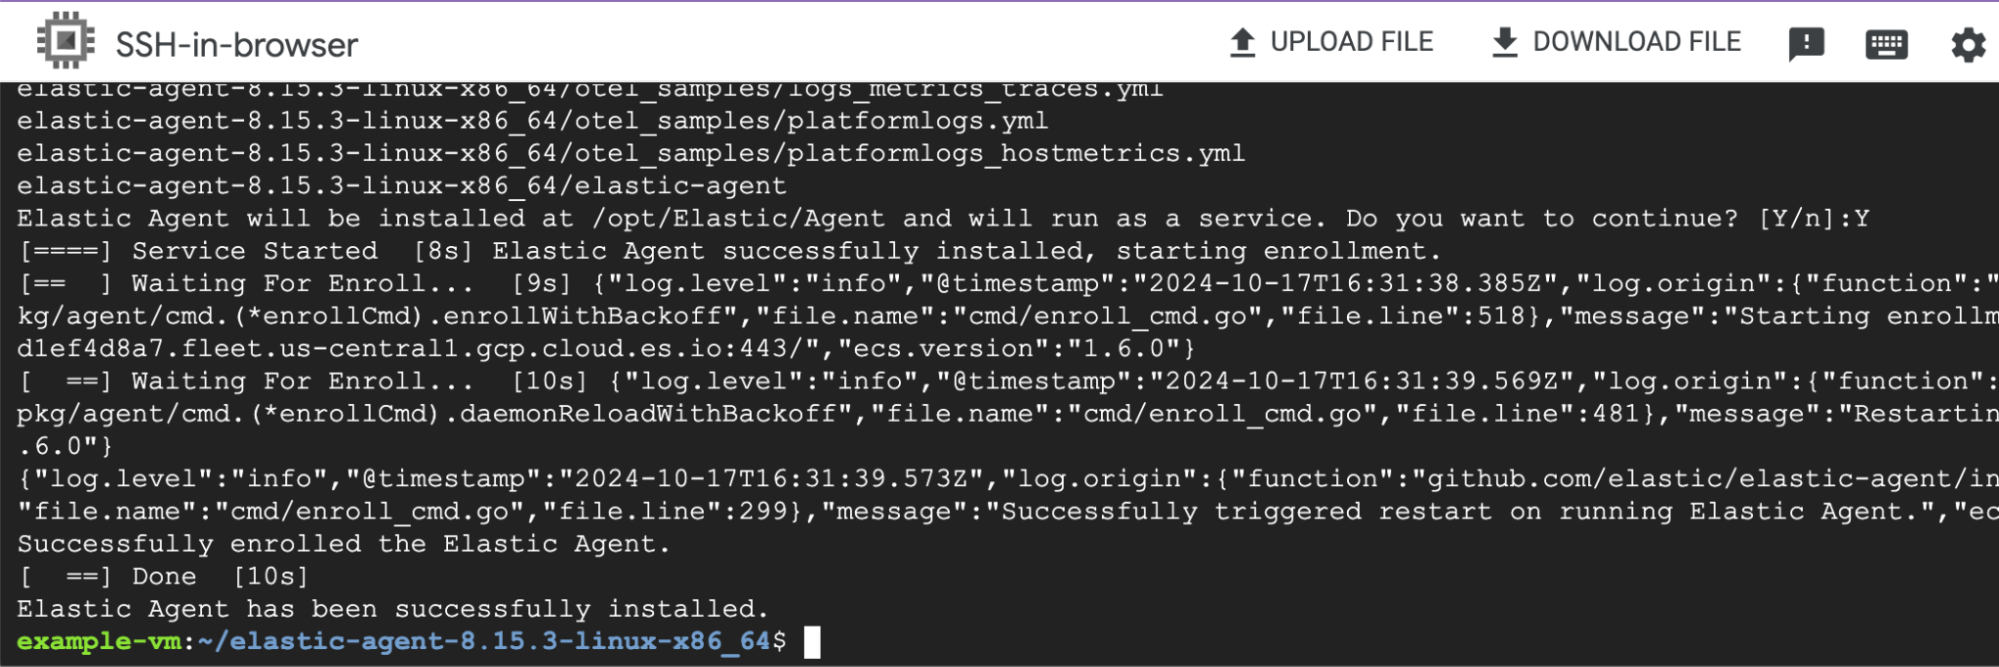
In an SSH Cloud Shell connected to a VM, paste and run the command you just copied.


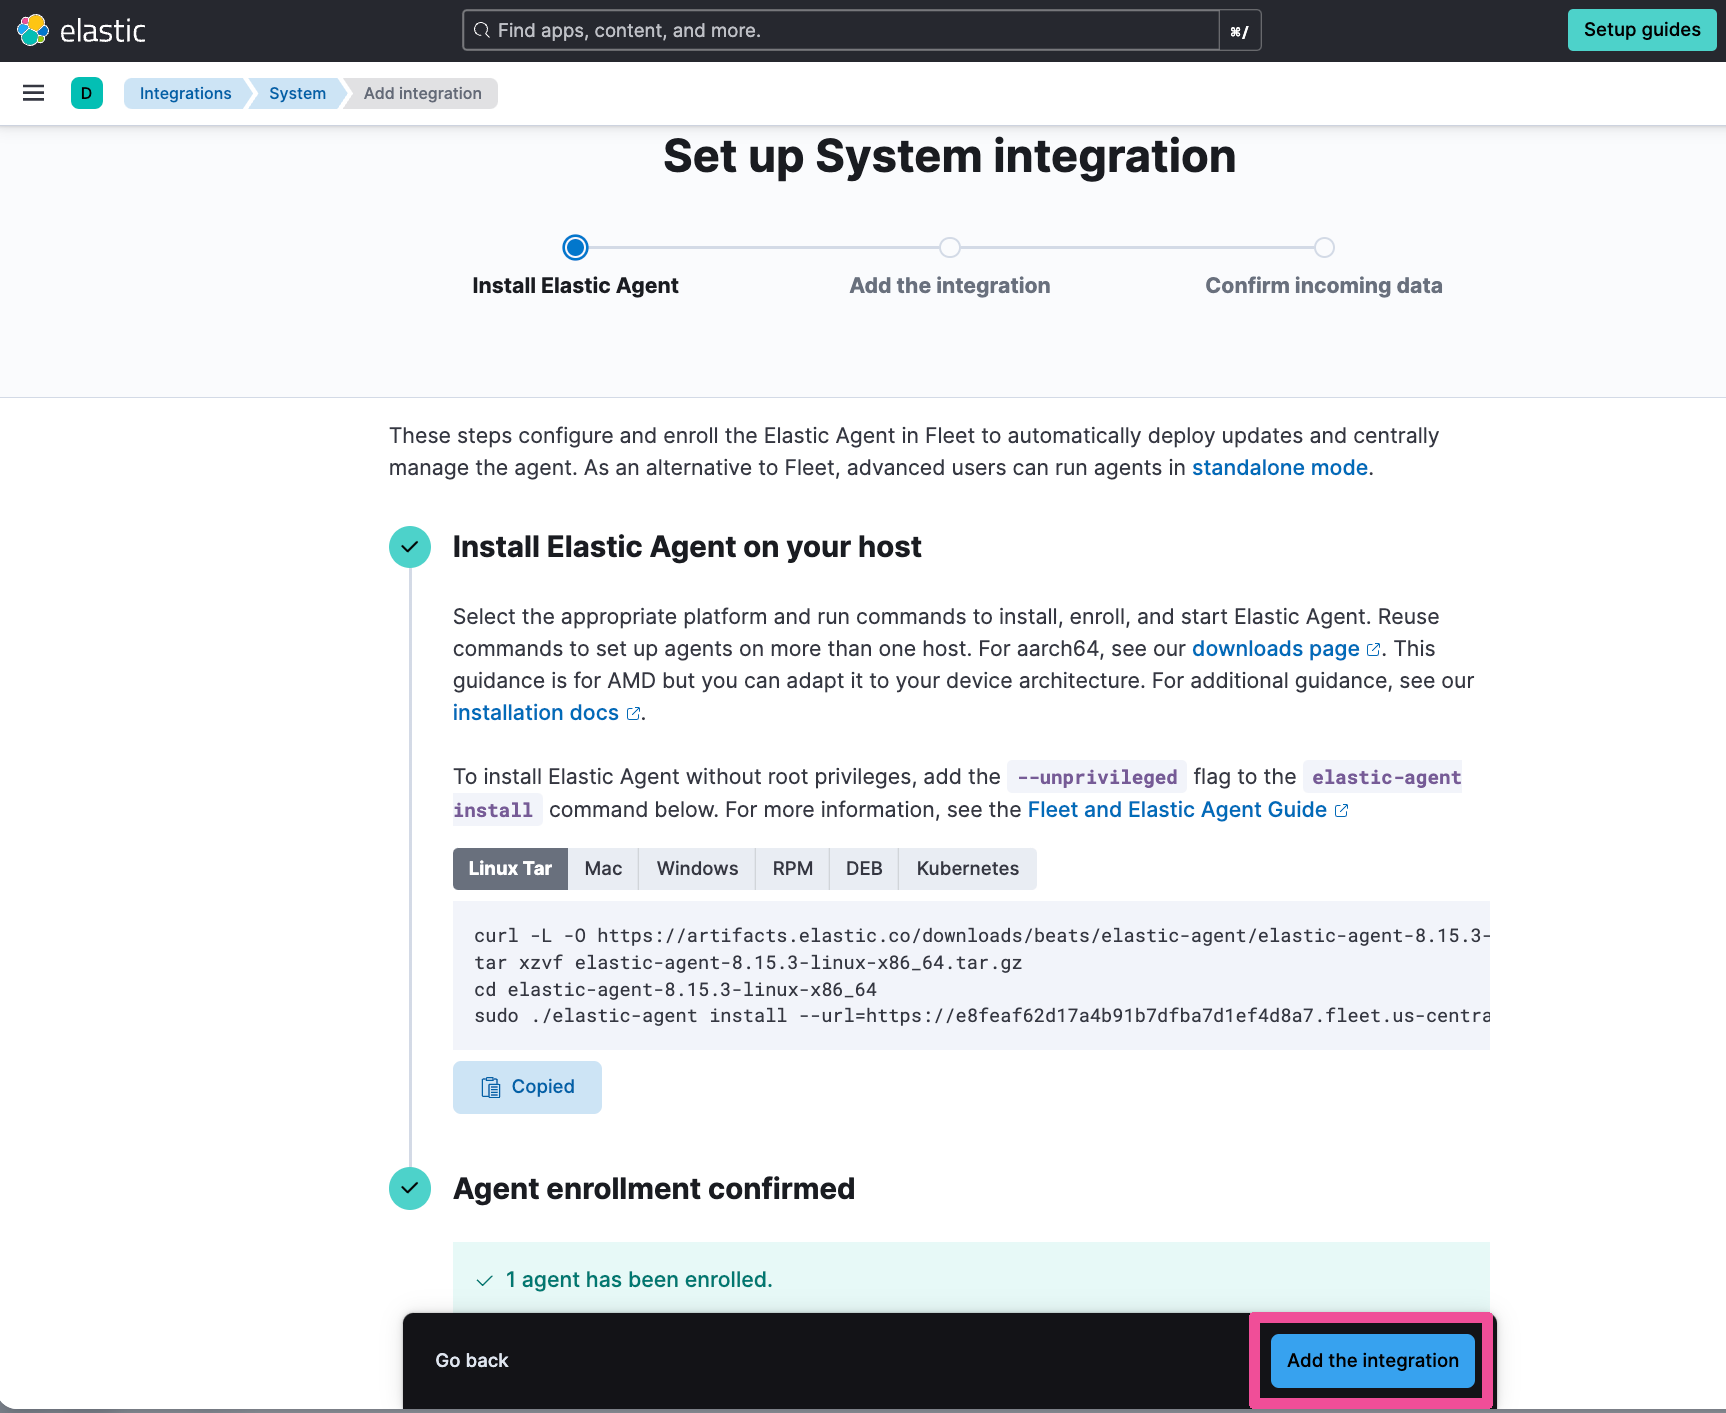
Back in Elastic Cloud on the System integration page, you should see a confirmation that the agent was installed successfully. Click Add the integration.
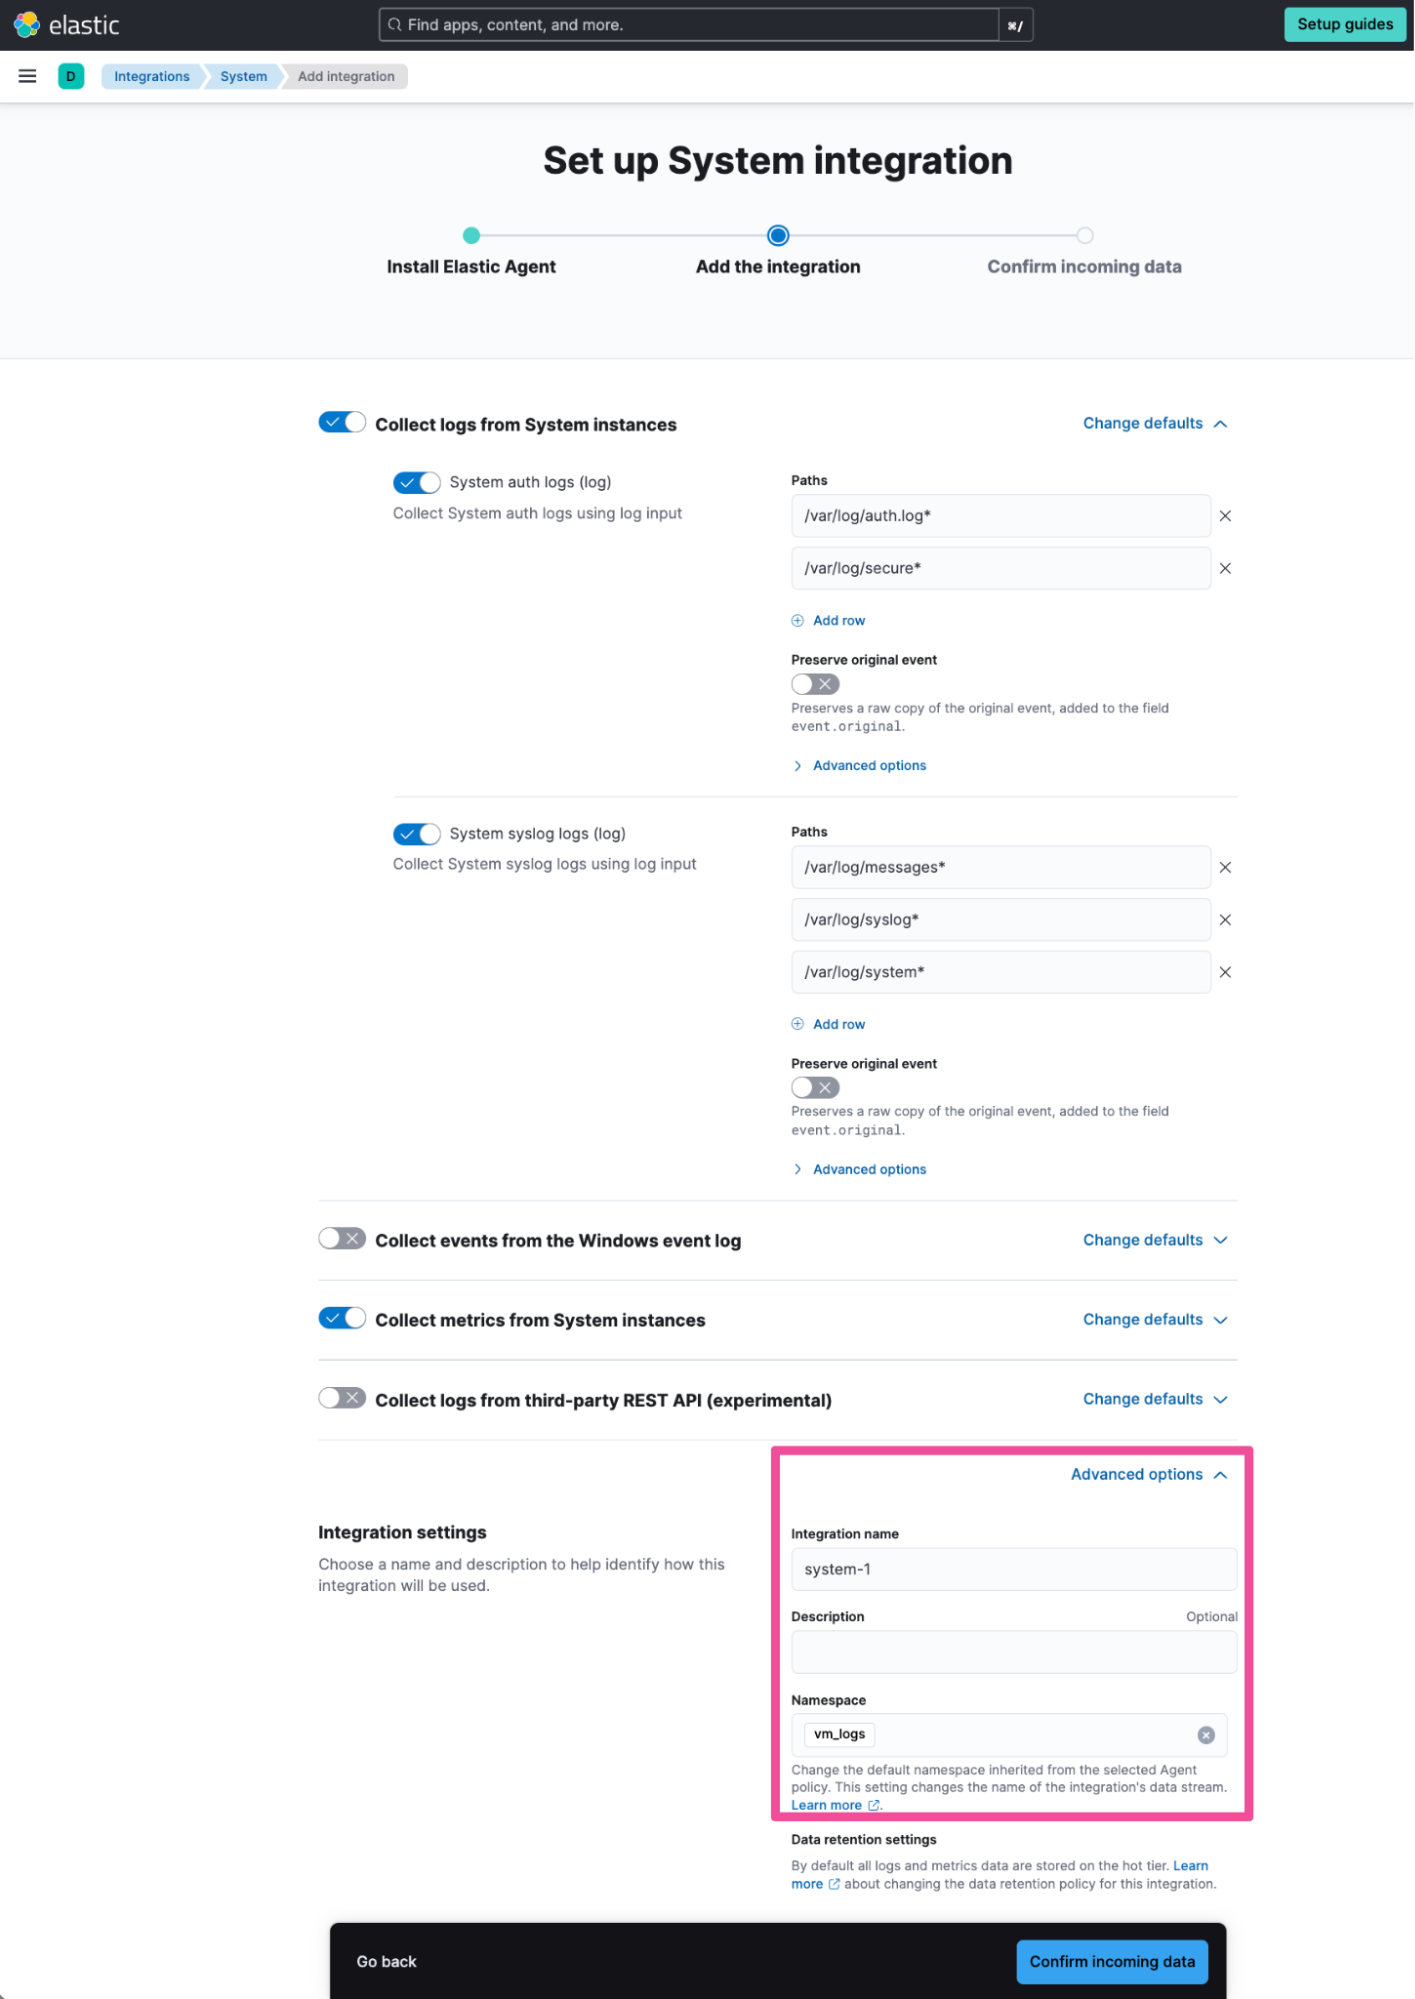
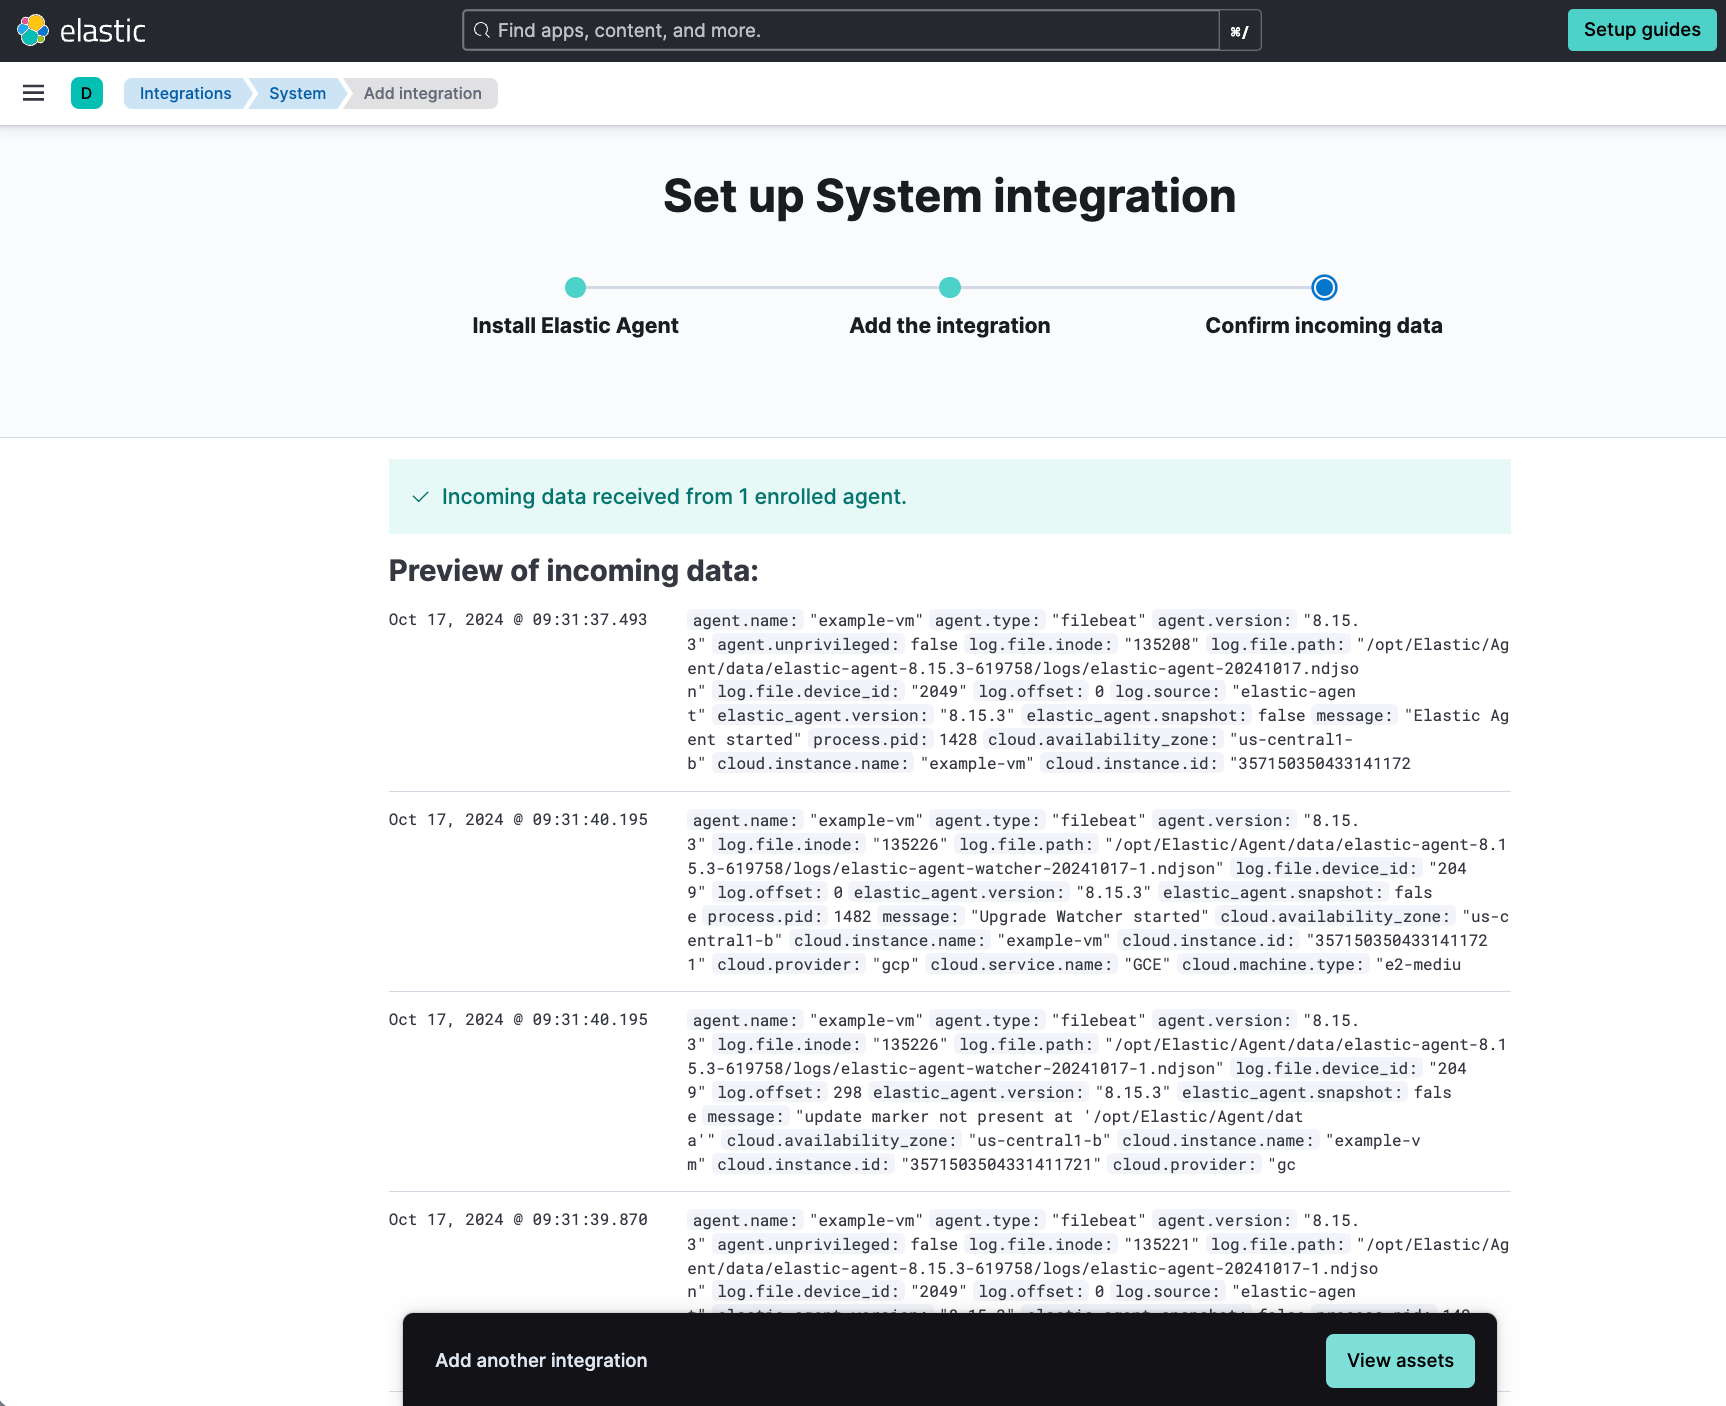
On the Set up System integration page, click Advanced options and enter a Namespace of your choice. For this blog post, we’ll enter “vm_logs” as the Namespace. Click Confirm incoming data.
You’ll see a confirmation page with a preview of the incoming data being sent by the Elastic Agent running on the VM.
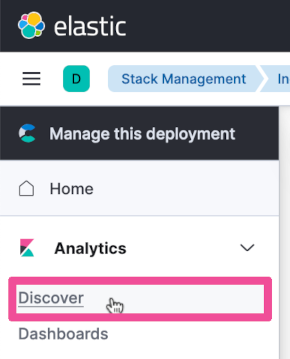
Now, click the top-level menu and select Discover so that we can see the logs now being collected.
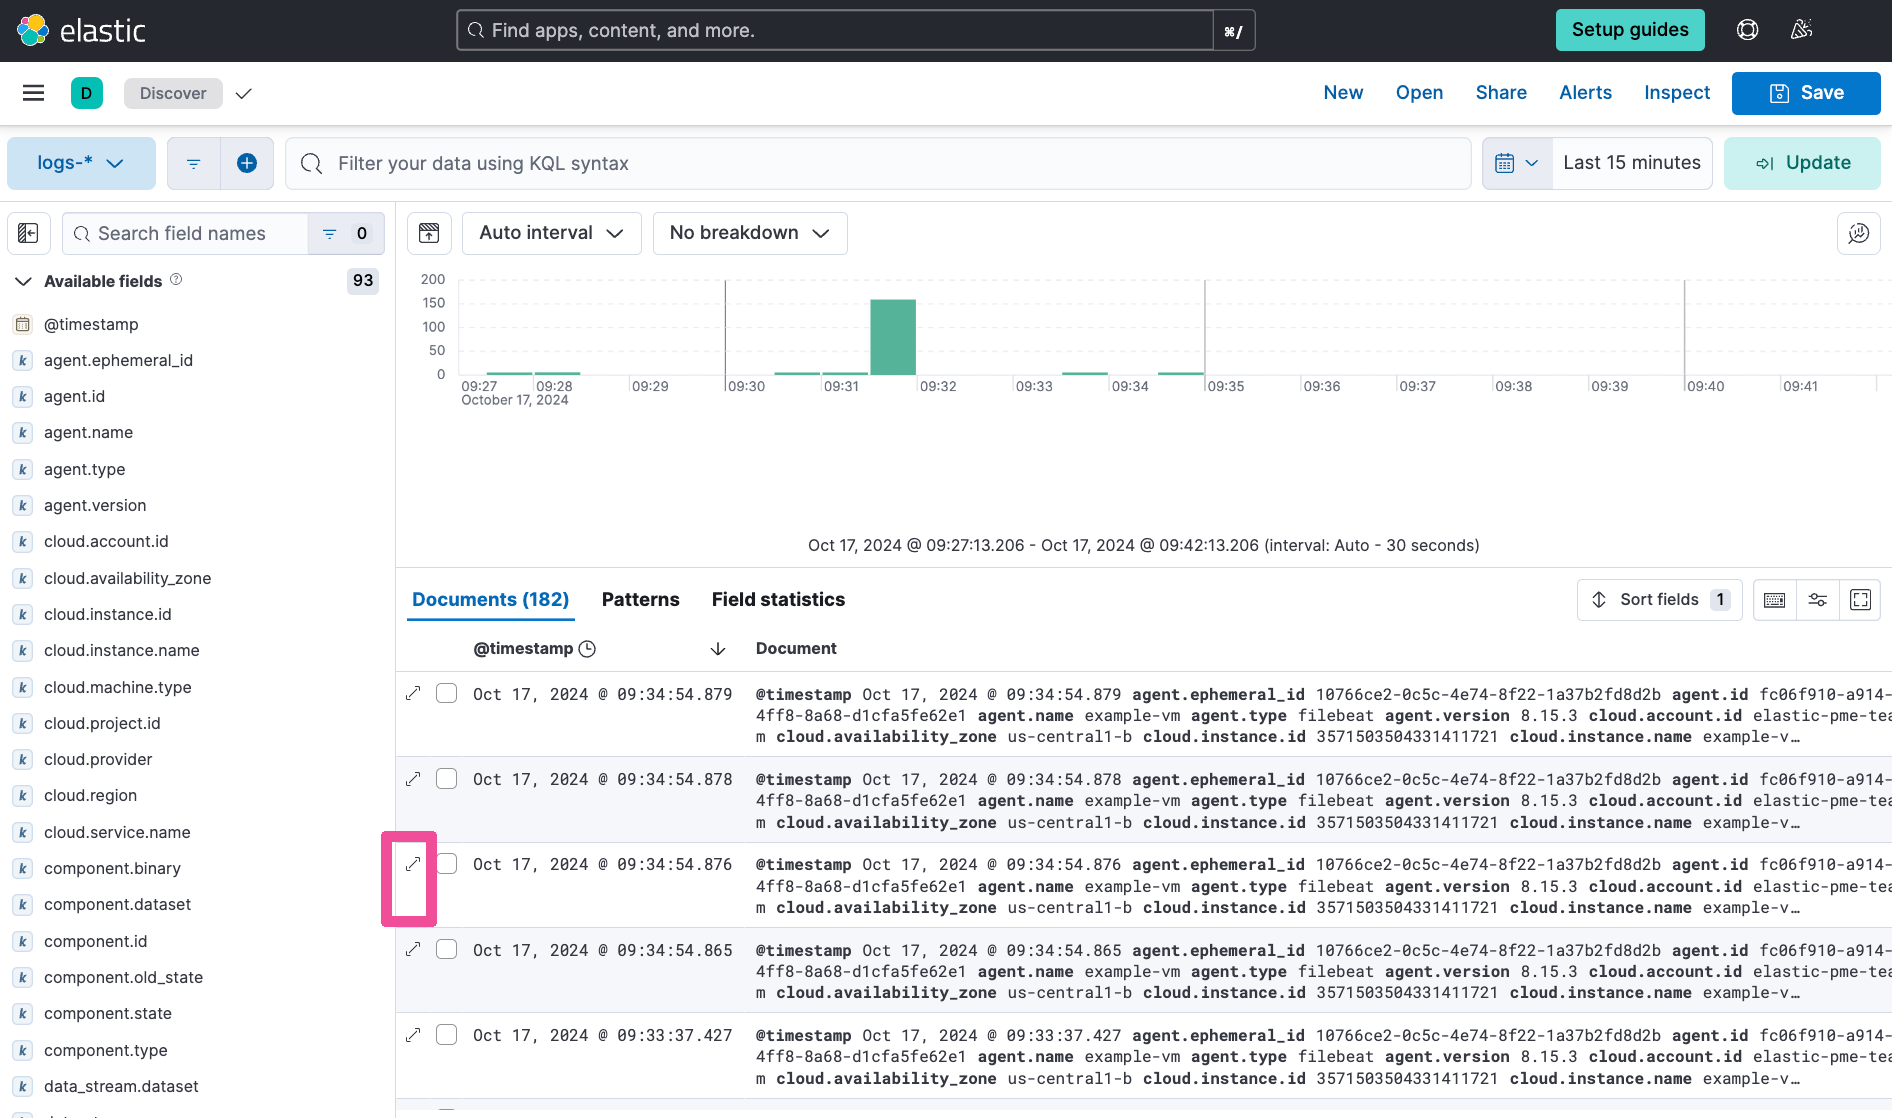
On the Discover page, click the data stream selector to change from metrics-* to logs-*.

Expand one of the log entries to see its details.
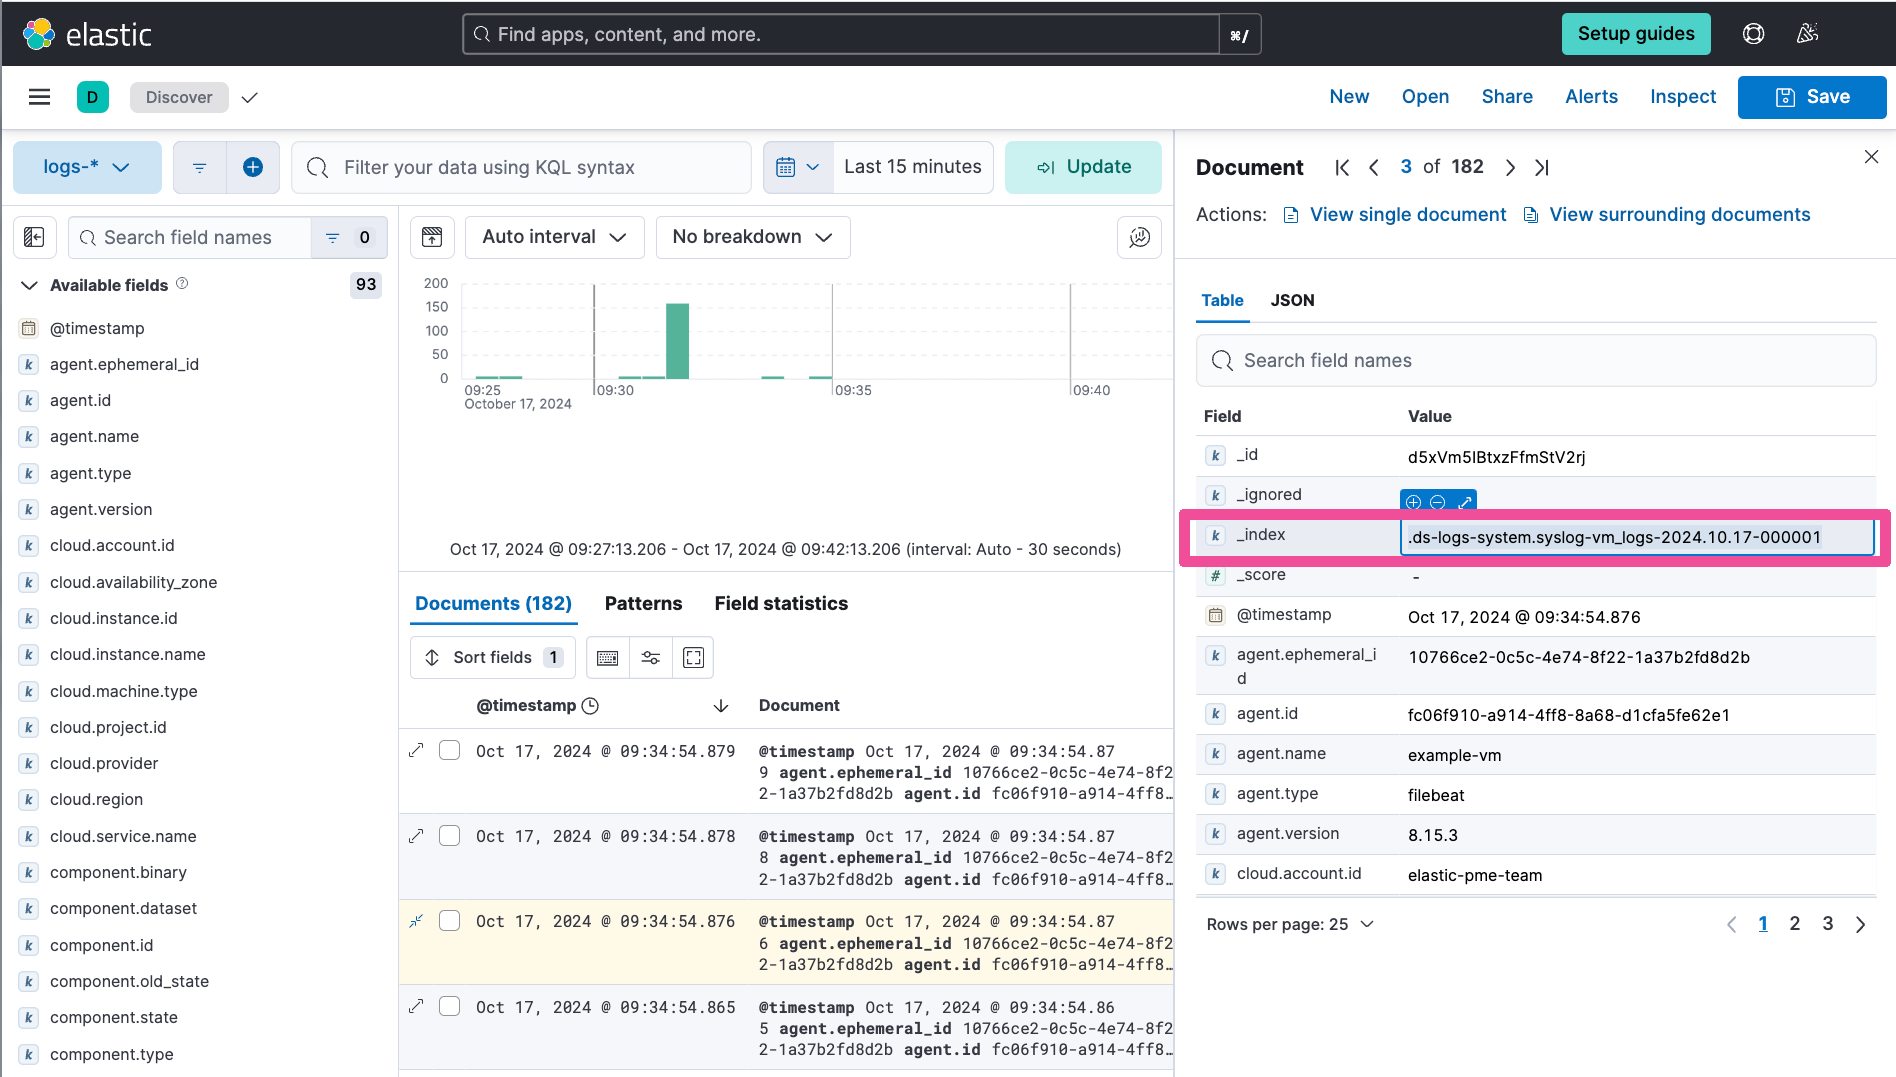
Copy the log entry’s index name, which is displayed as the value of _index in the log entry’s details.
Create an index lifecycle policy
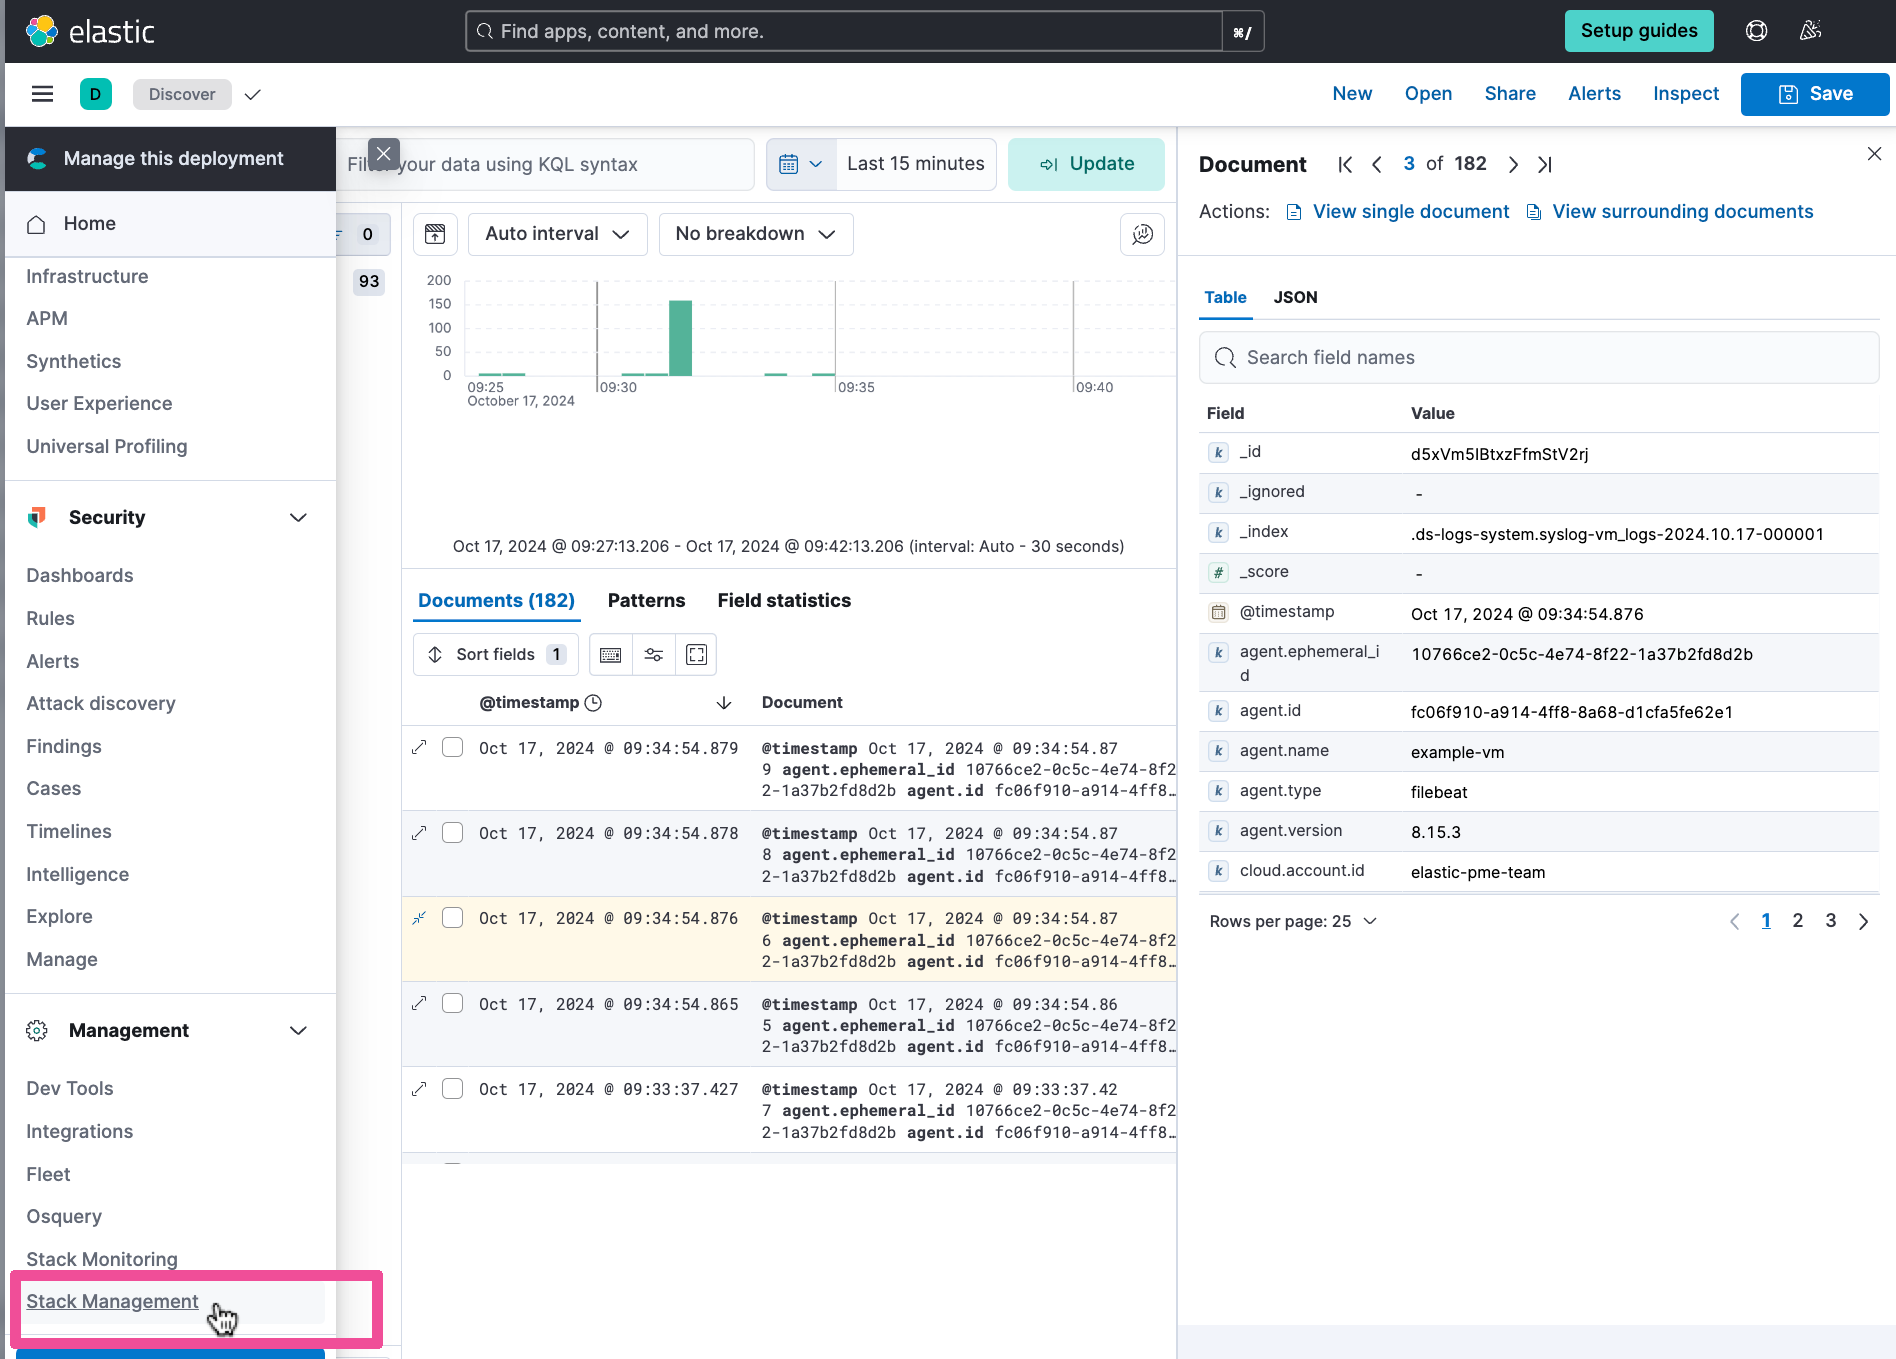
Click the top-level menu and select Stack Management.
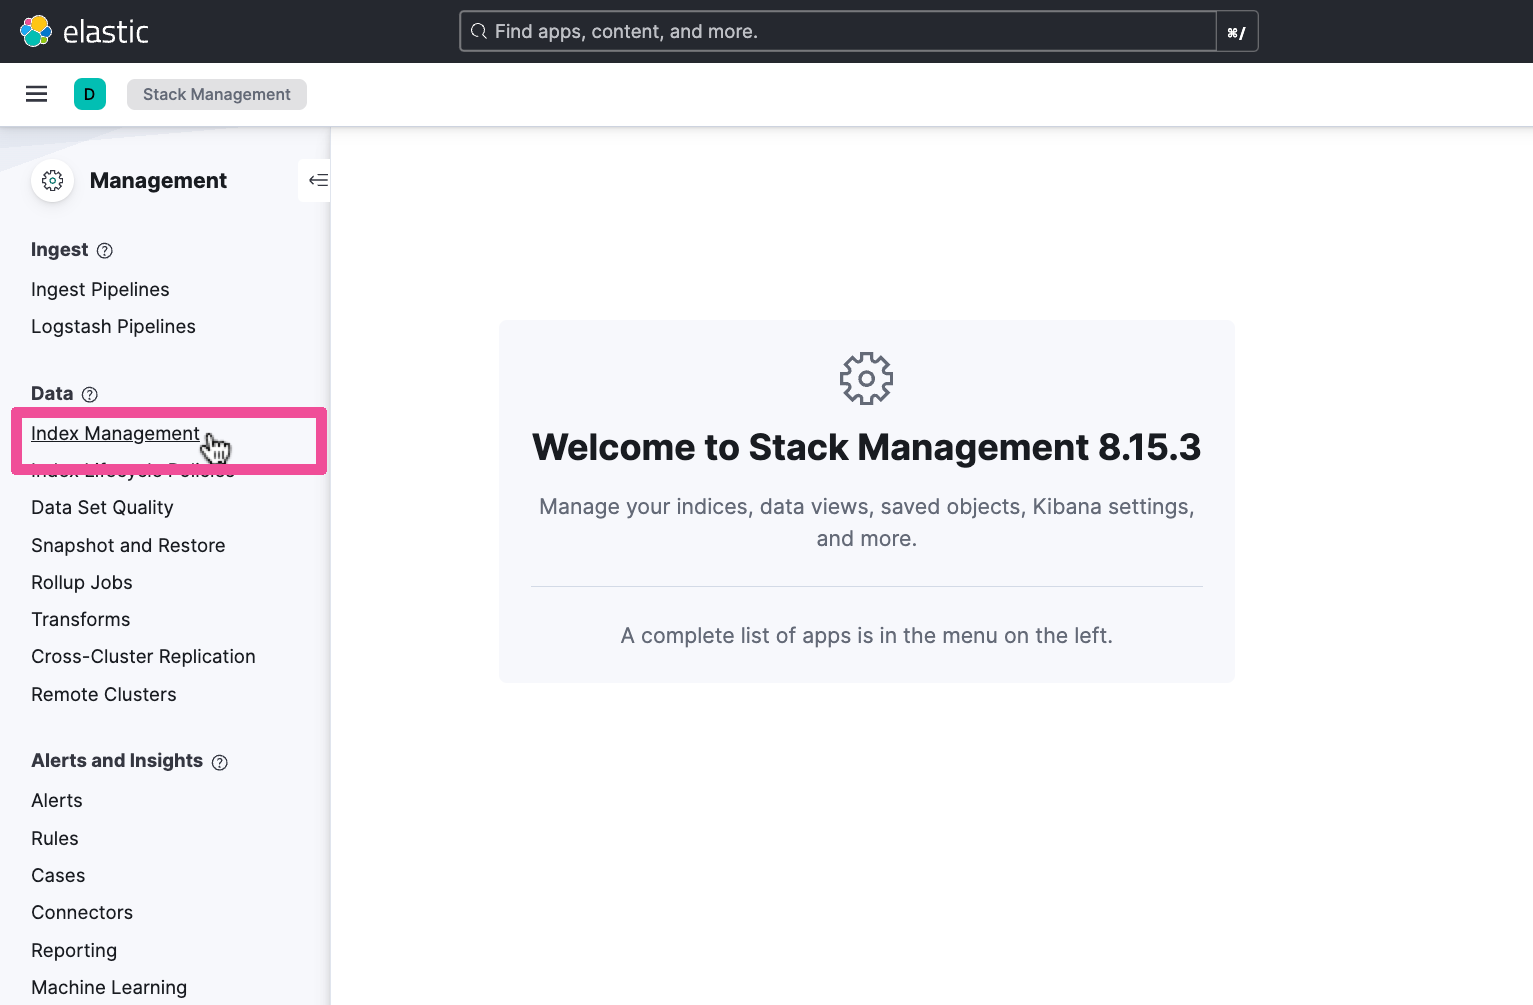
Select Index Management from the left navigation menu.
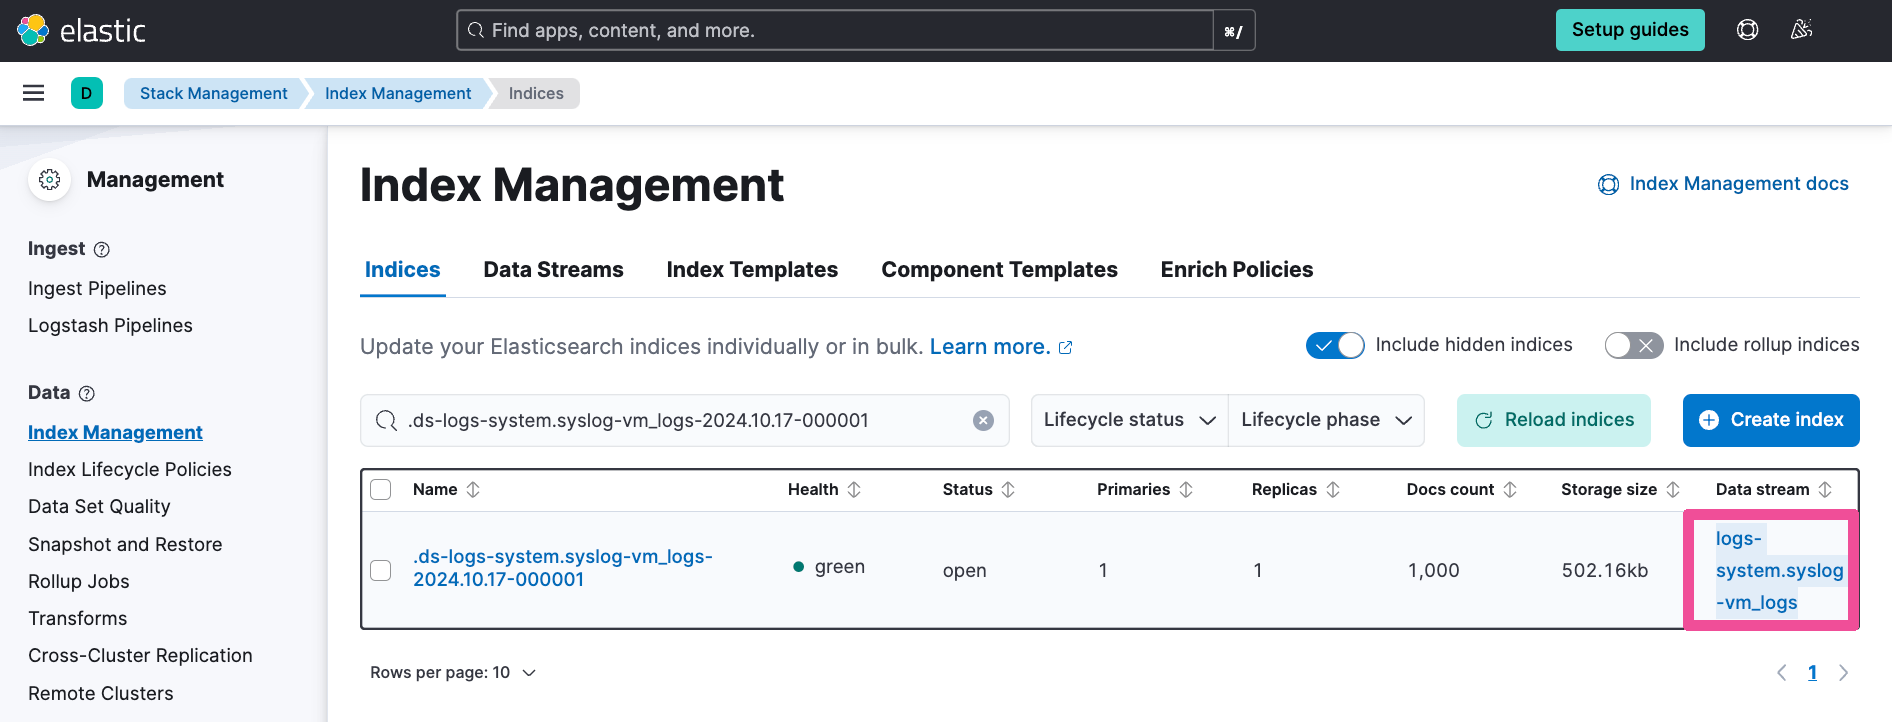
On the Indices tab of the Index Management page, click Include hidden indices.

Search for the index name you copied in a previous step from the Discover page’s log entry details. Copy the Data stream value, which we’ll use to create the hot frozen index policy in the next step.
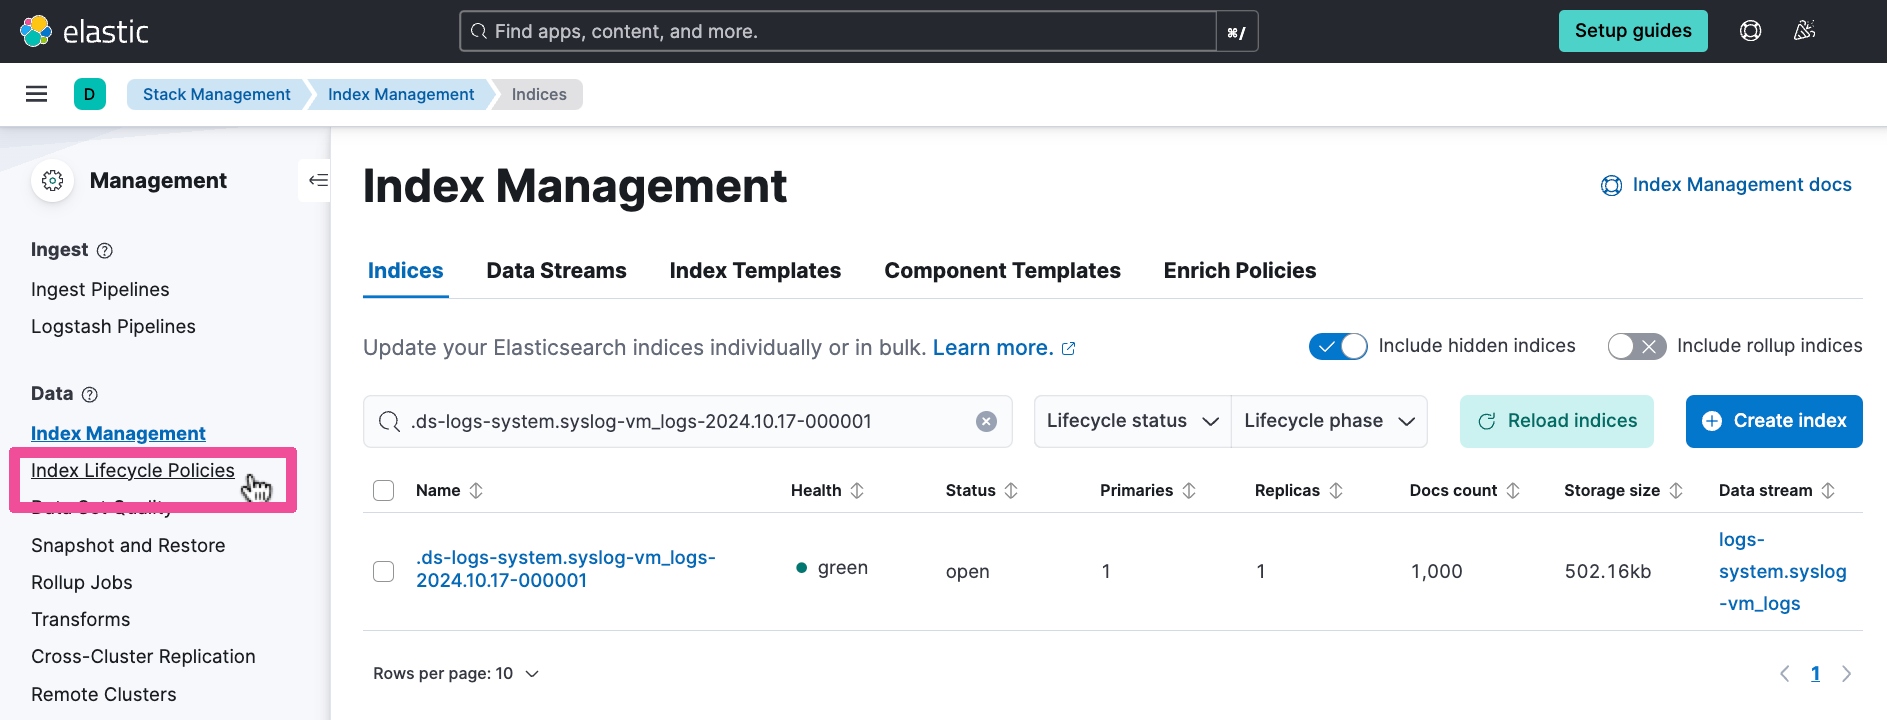
Select Index Lifecycle Policies from the left navigation menu.
Click Create policy.

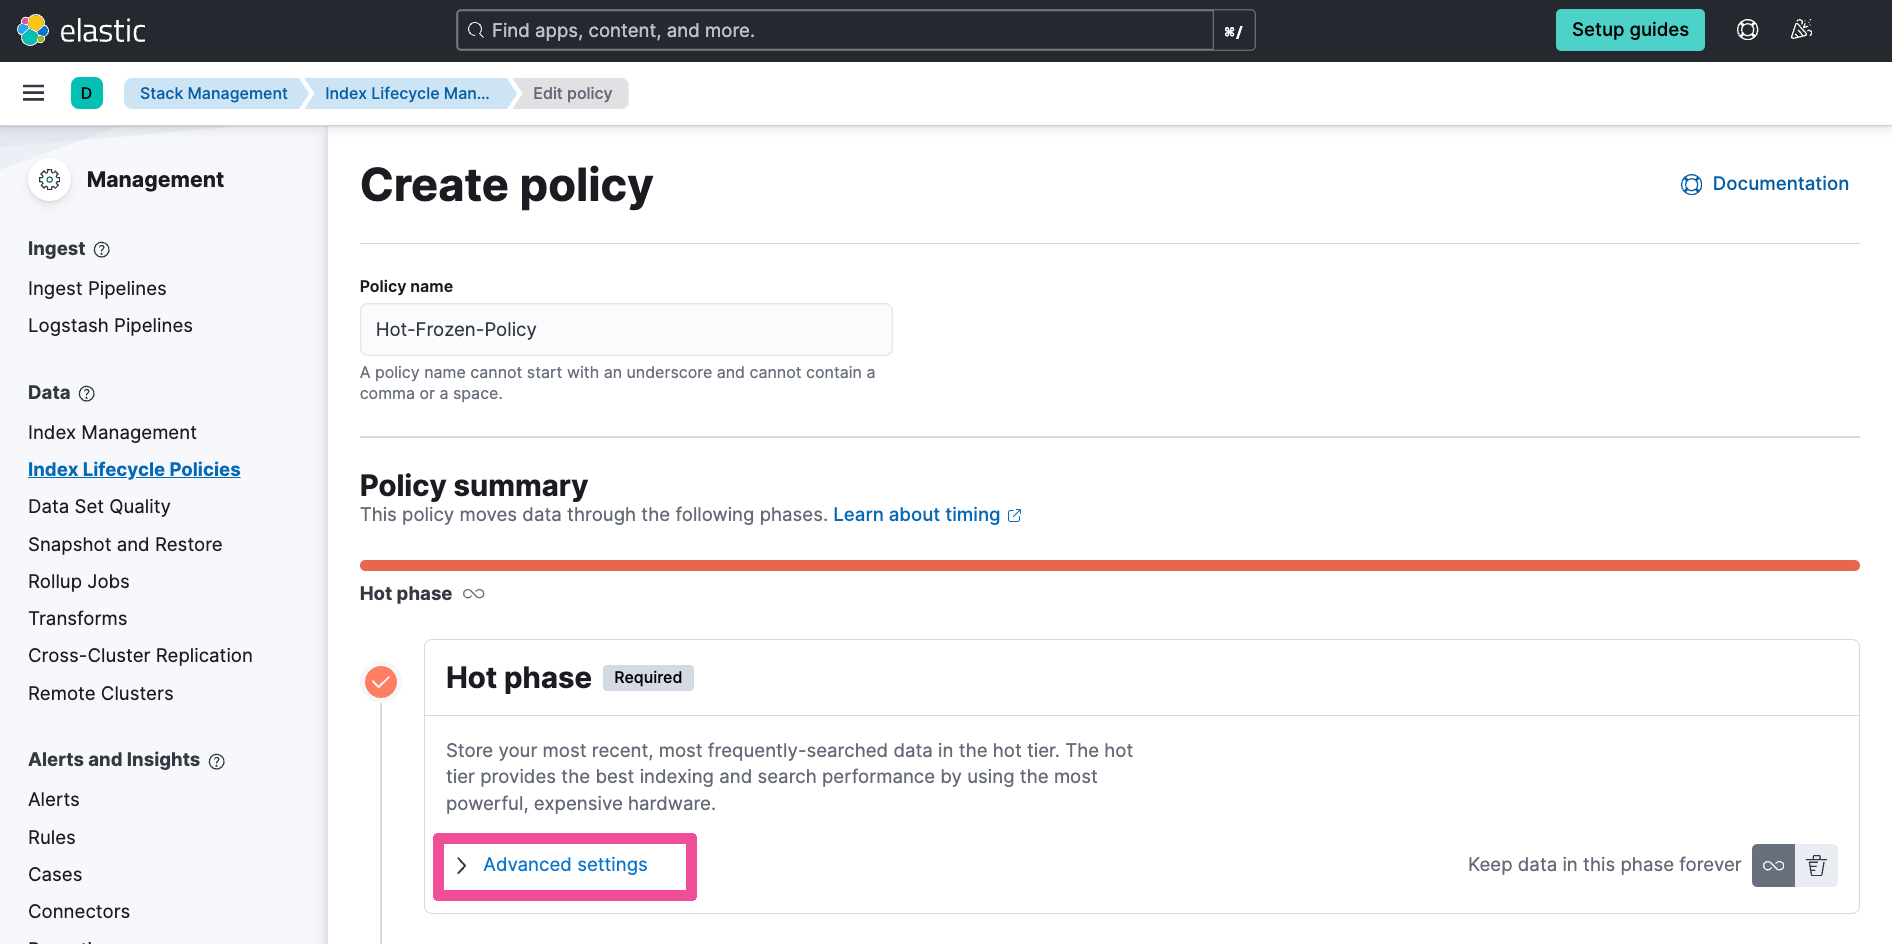
On the Create policy page, click Advanced settings under the Hot phase section.
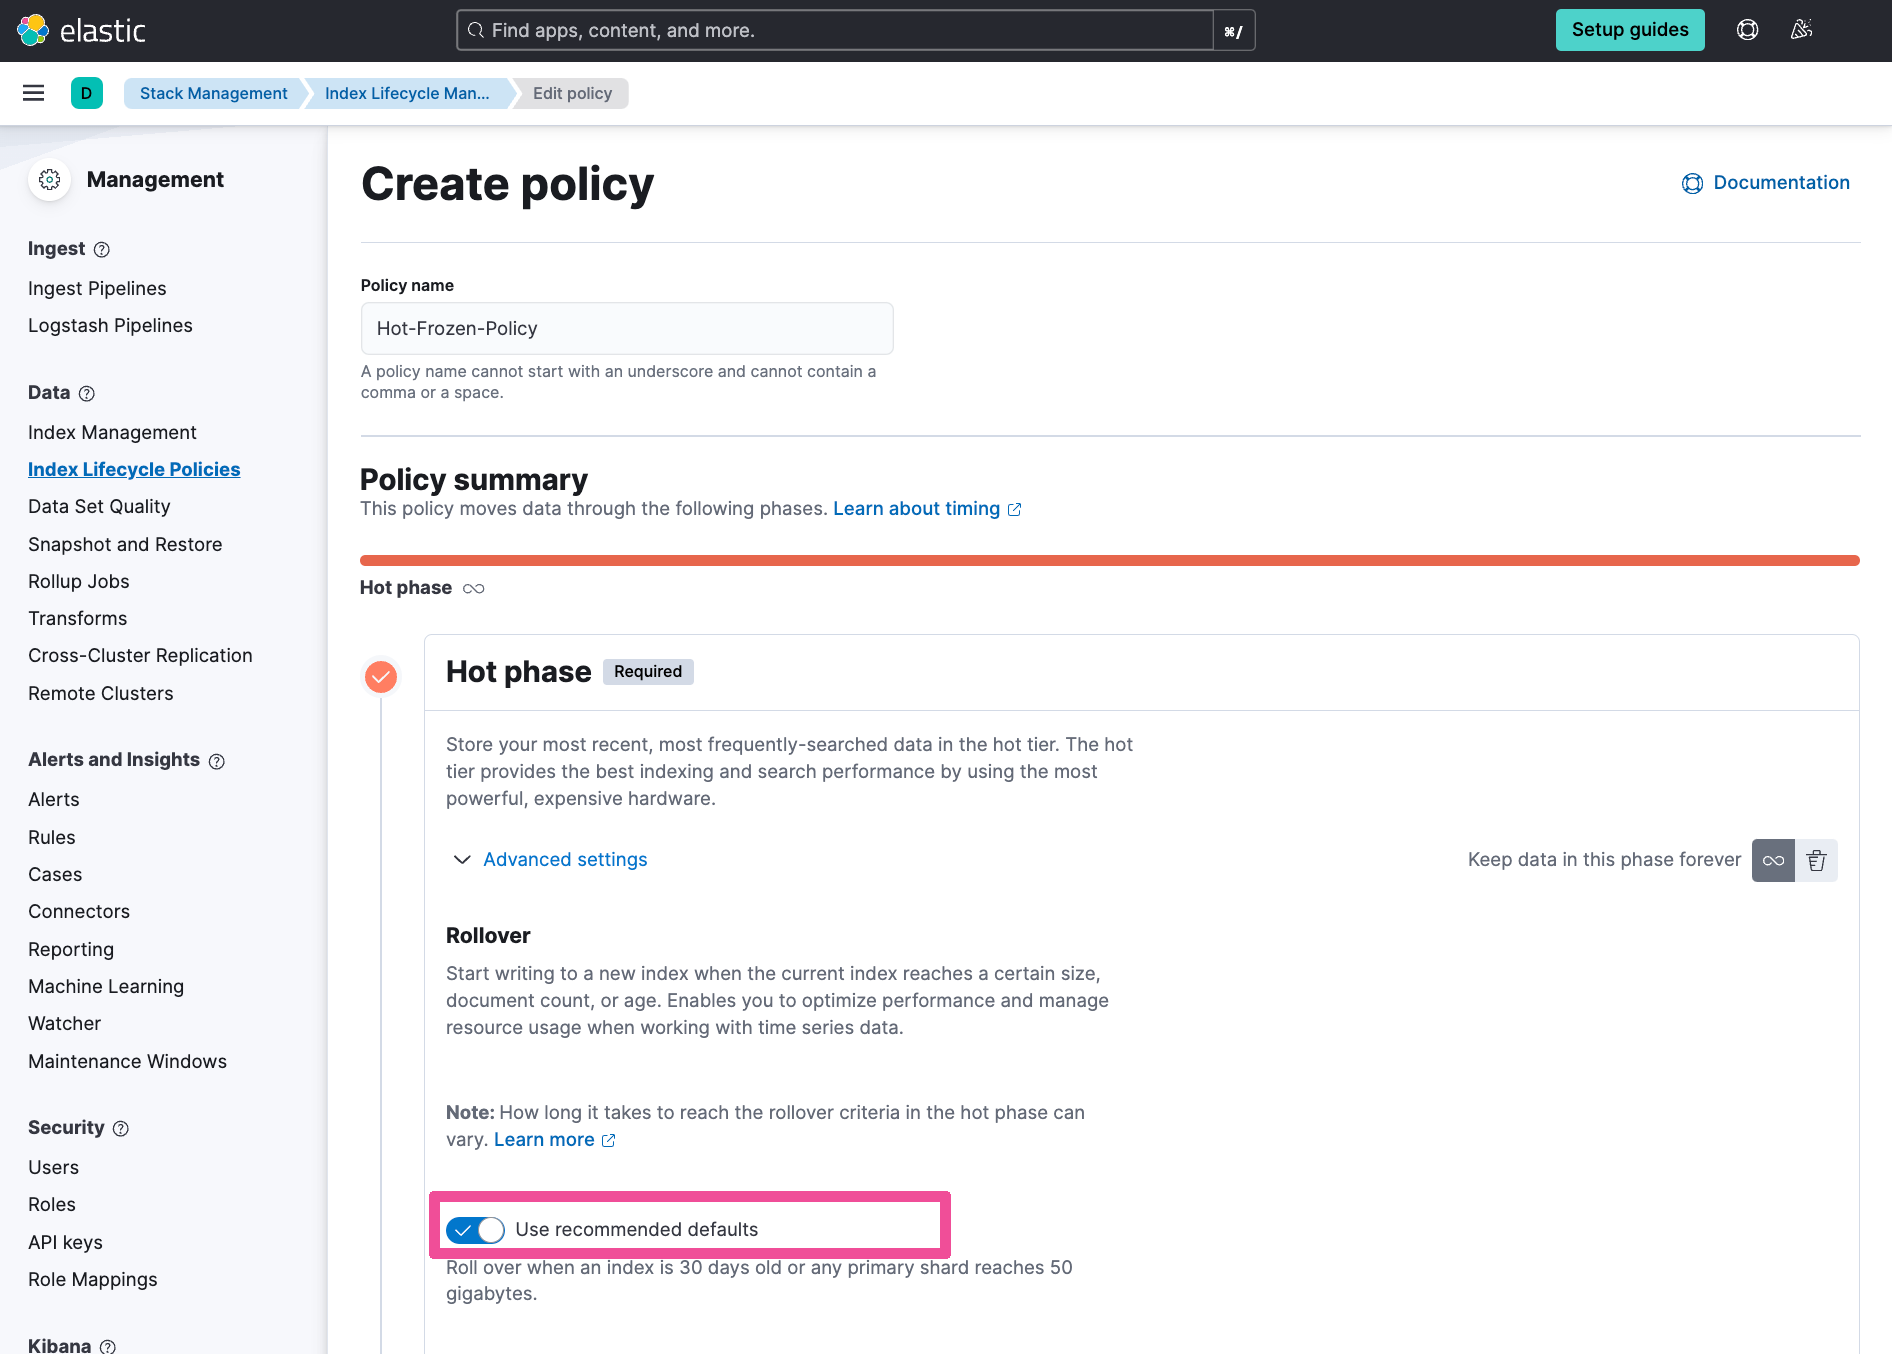
Click the Use recommended defaults toggle in order to edit the customization options. The default duration for the hot phase is 30 days.
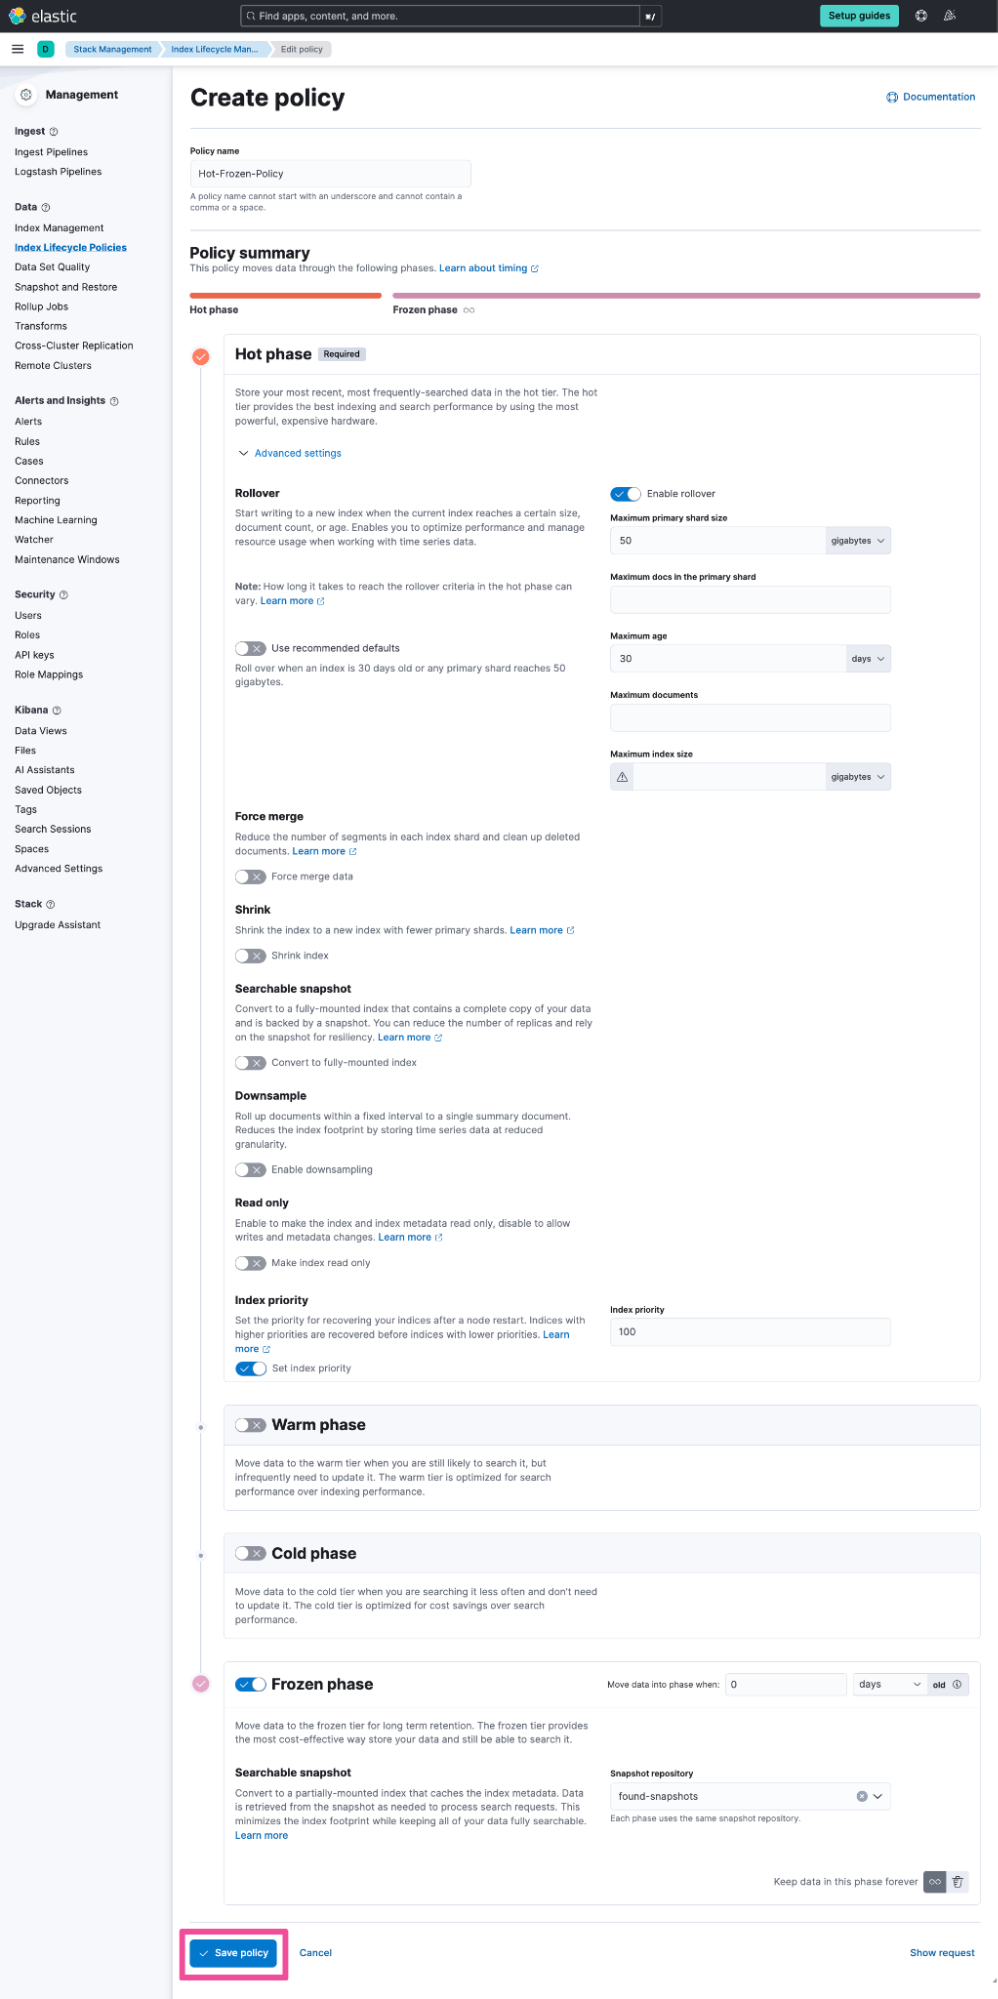
Enable the Frozen phase and enter the number zero in the Move data into phase when input box so that the value is “0 days old.” This means that after the 30 days of hot phase, data controlled by this policy will be moved to the frozen phase immediately. Your Create policy form should look something like the following completed form. Click Save policy to create the new index lifecycle policy.
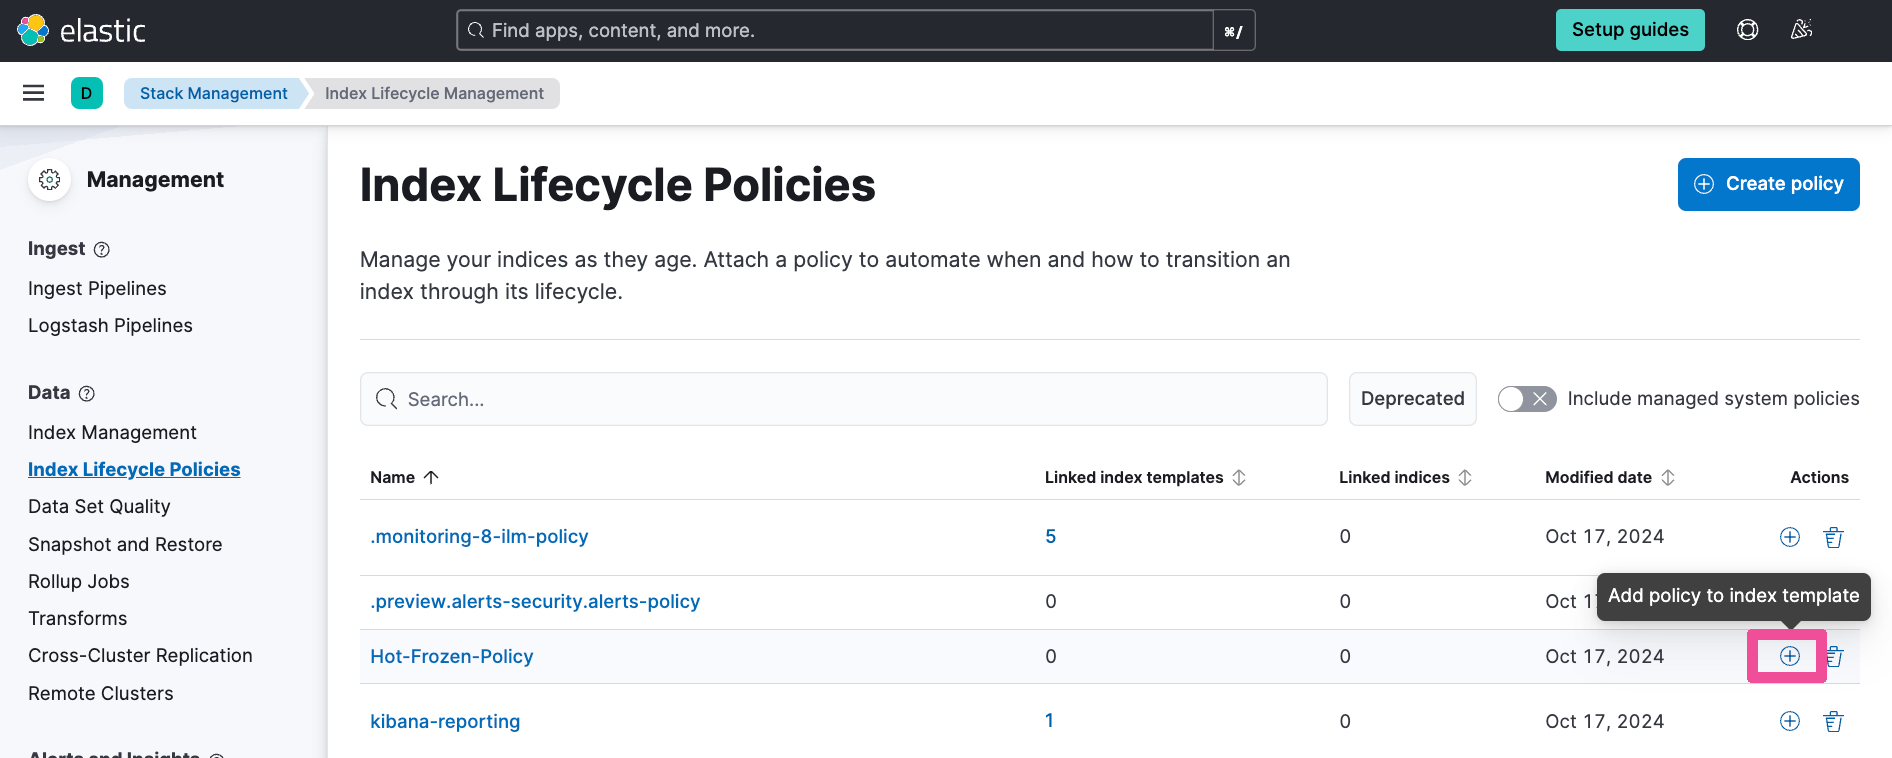
On the Index Lifecycle Policies page, find the newly created Hot-Frozen-Policy index life cycle policy and click its Add policy to index template button.
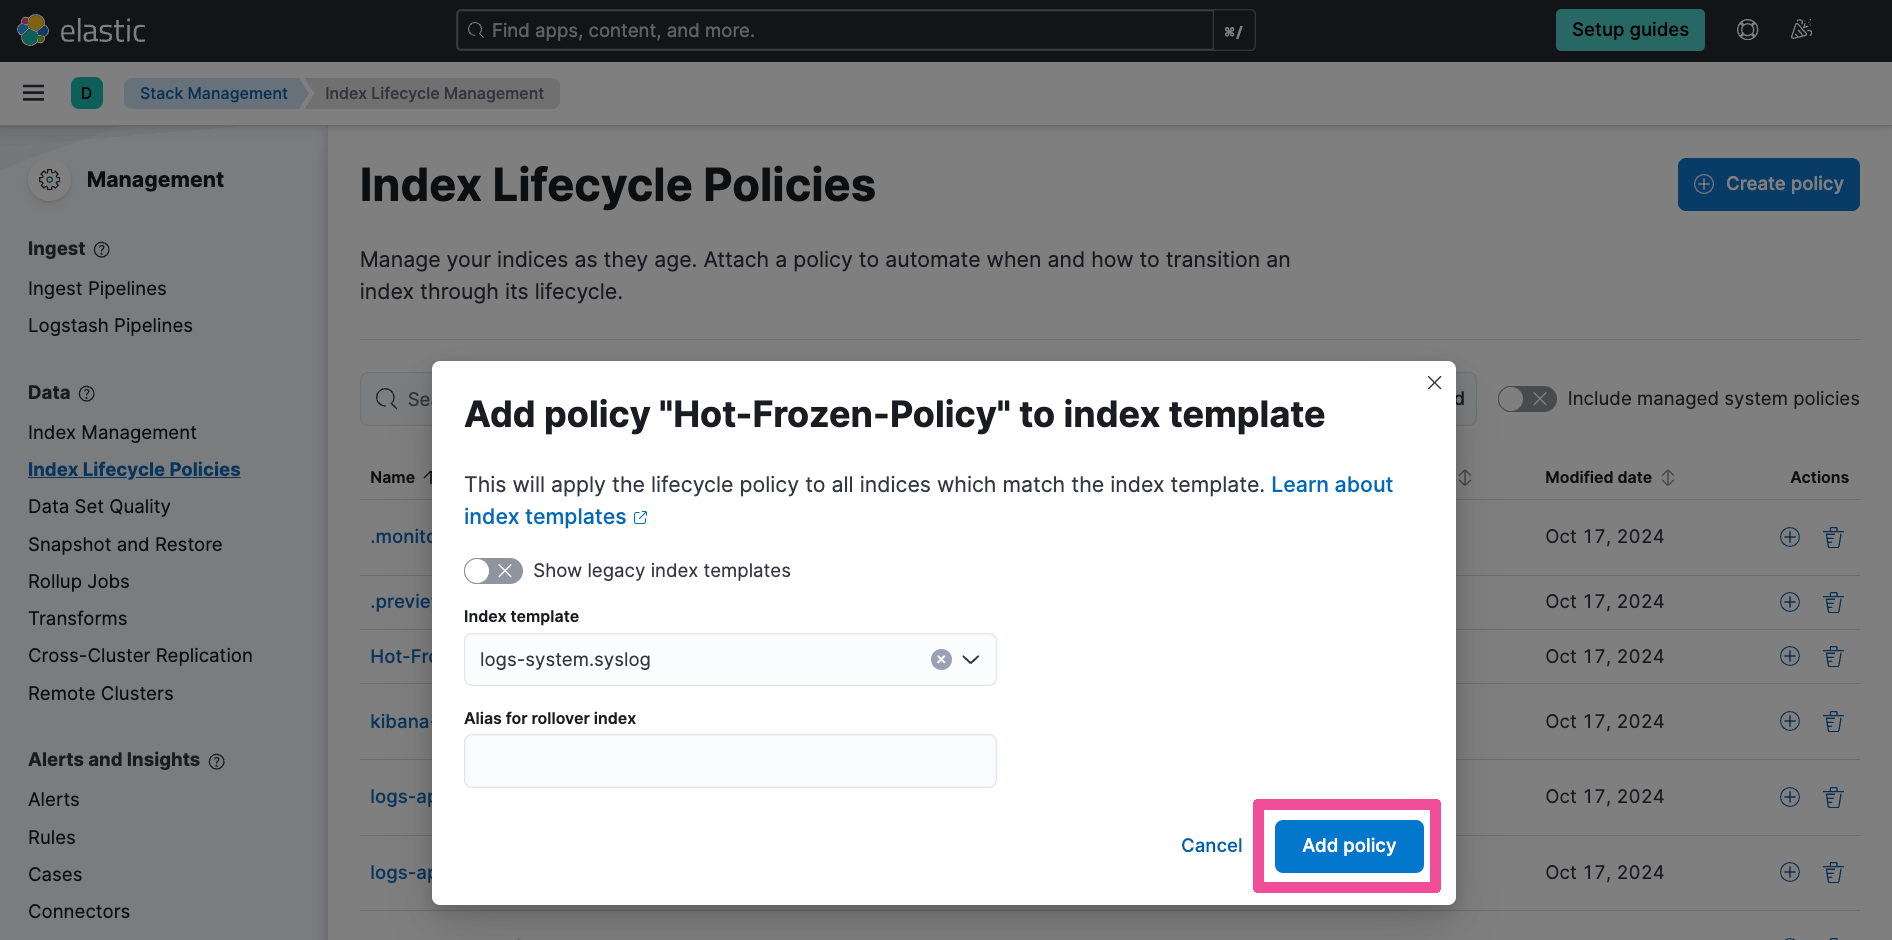
For index template, enter “logs-system.syslog,” which is the prefix of the data stream that is ingesting our System integration logs as we saw in an earlier step. Click Add policy.
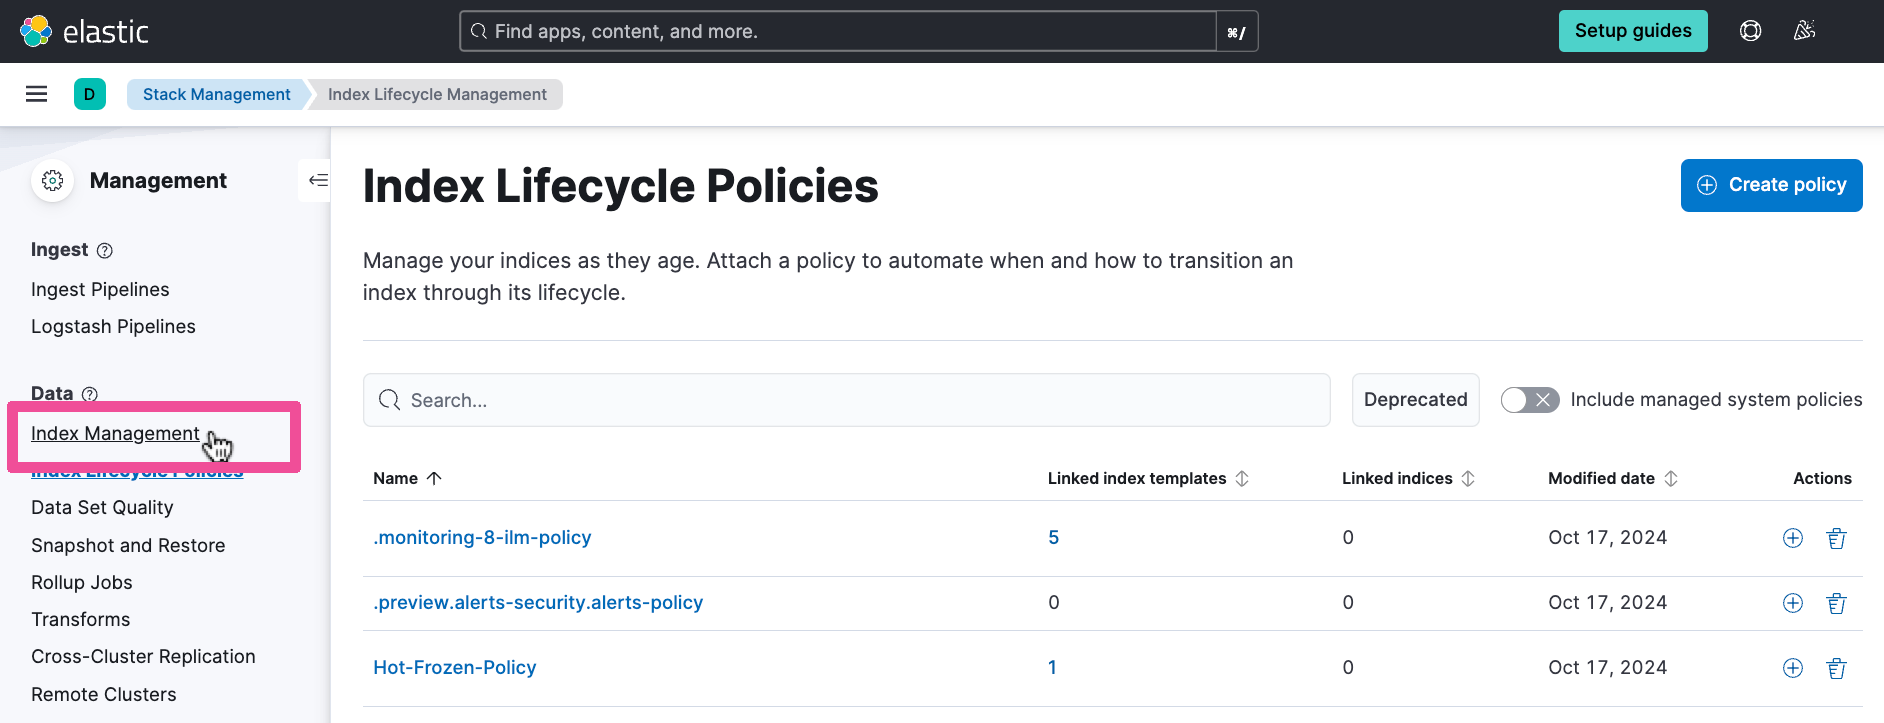
Let’s confirm that we’ve now gotten our index lifecycle policy set to be applied to our logs data stream. Select Index Management from the left navigation menu, which is where we can confirm that the index containing our ingested logs is running under the new hot frozen index lifecycle policy.
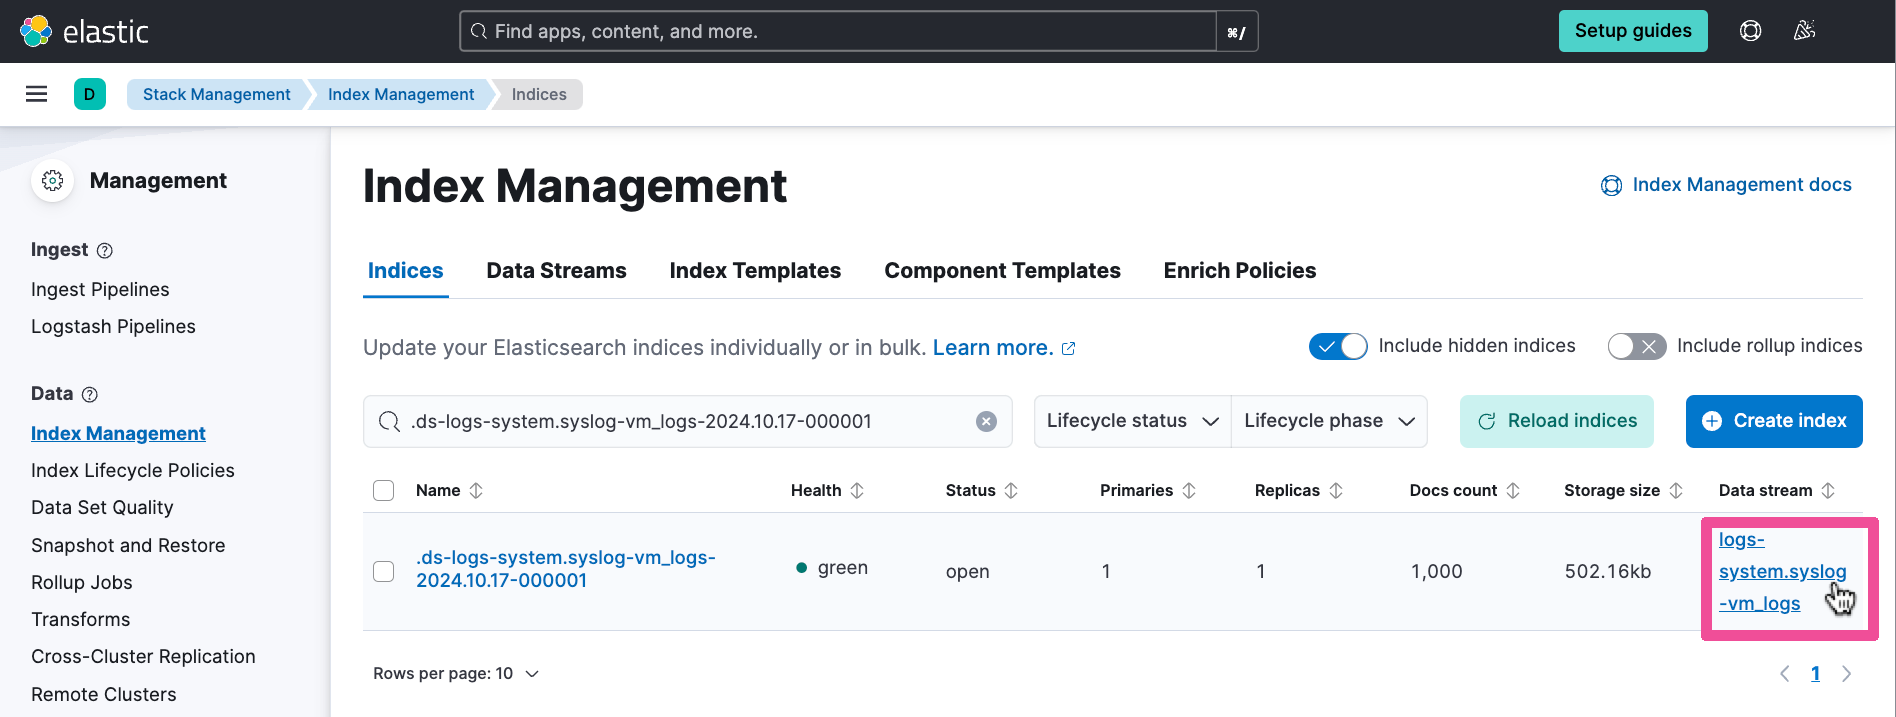
On the Index Management page, click the Include hidden indices toggle to enable it and search again for the index name containing the logs as you did previously. You should have one index returned in the search results. Click its Data stream link.
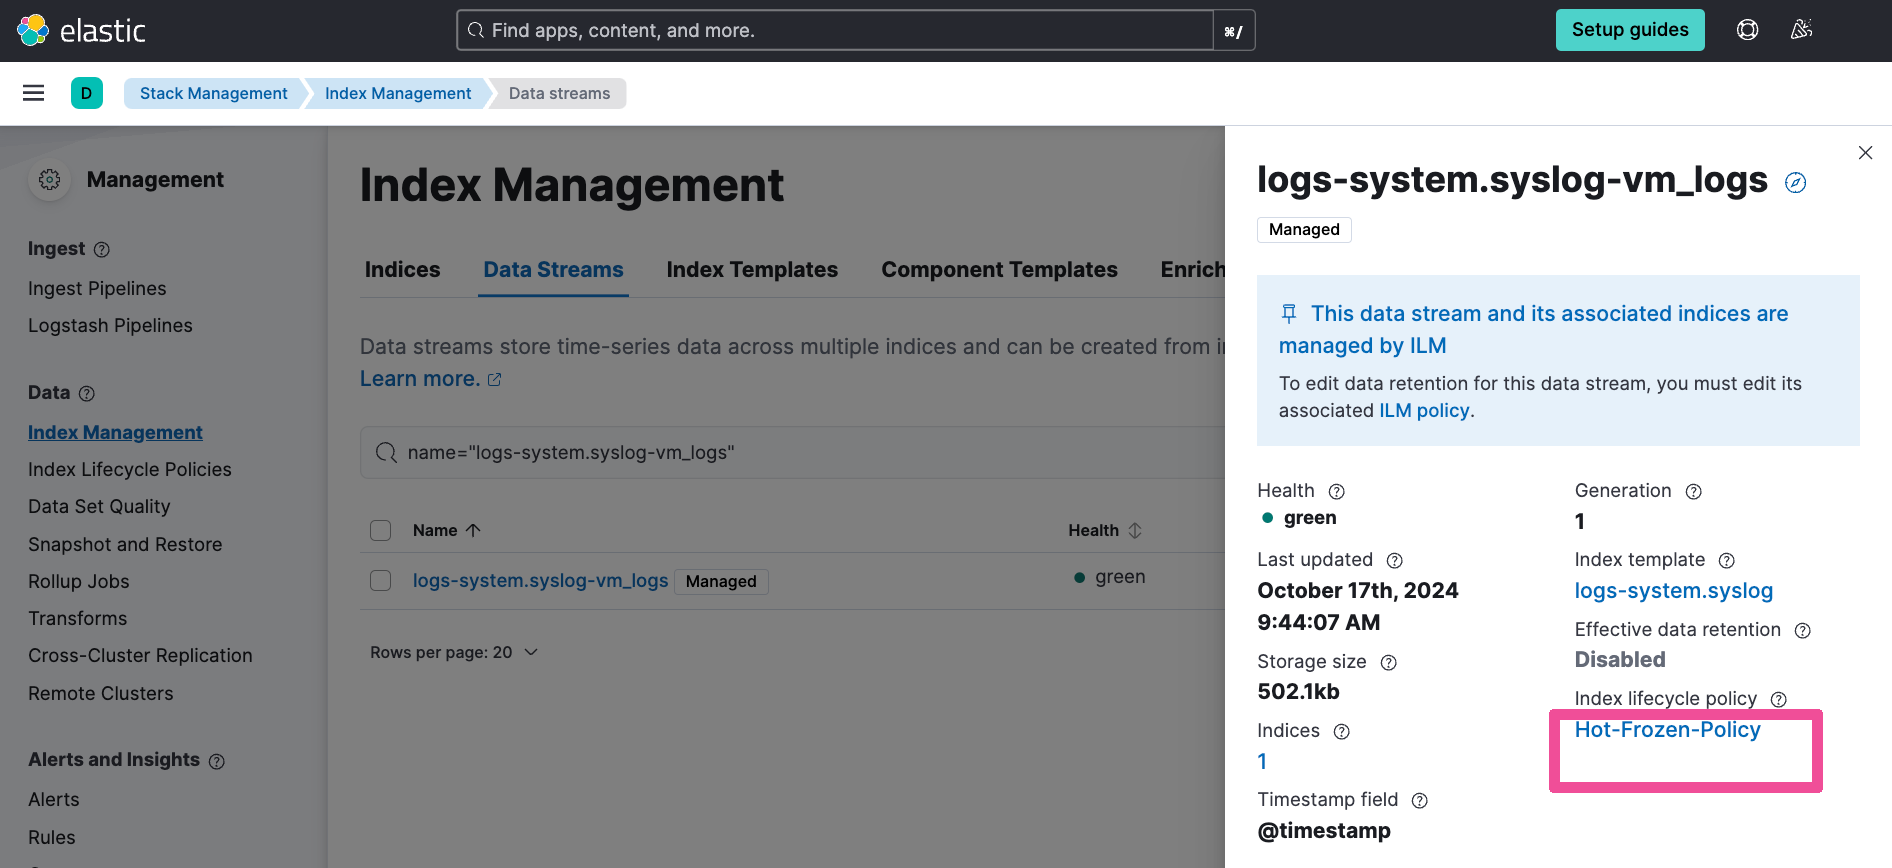
In the Data Streams tab, you should see that this data stream of logs is being managed by the hot frozen policy we just created. Well done!
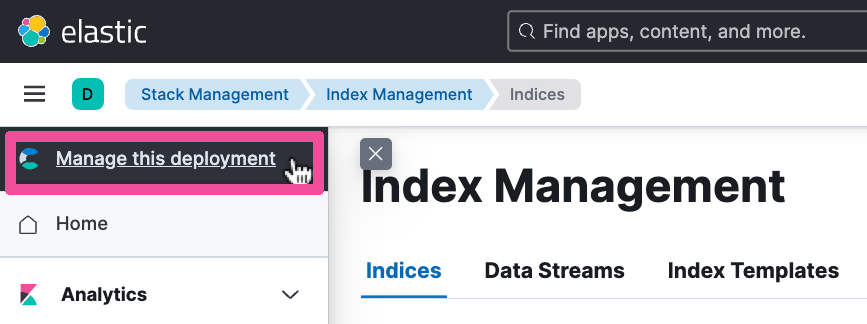
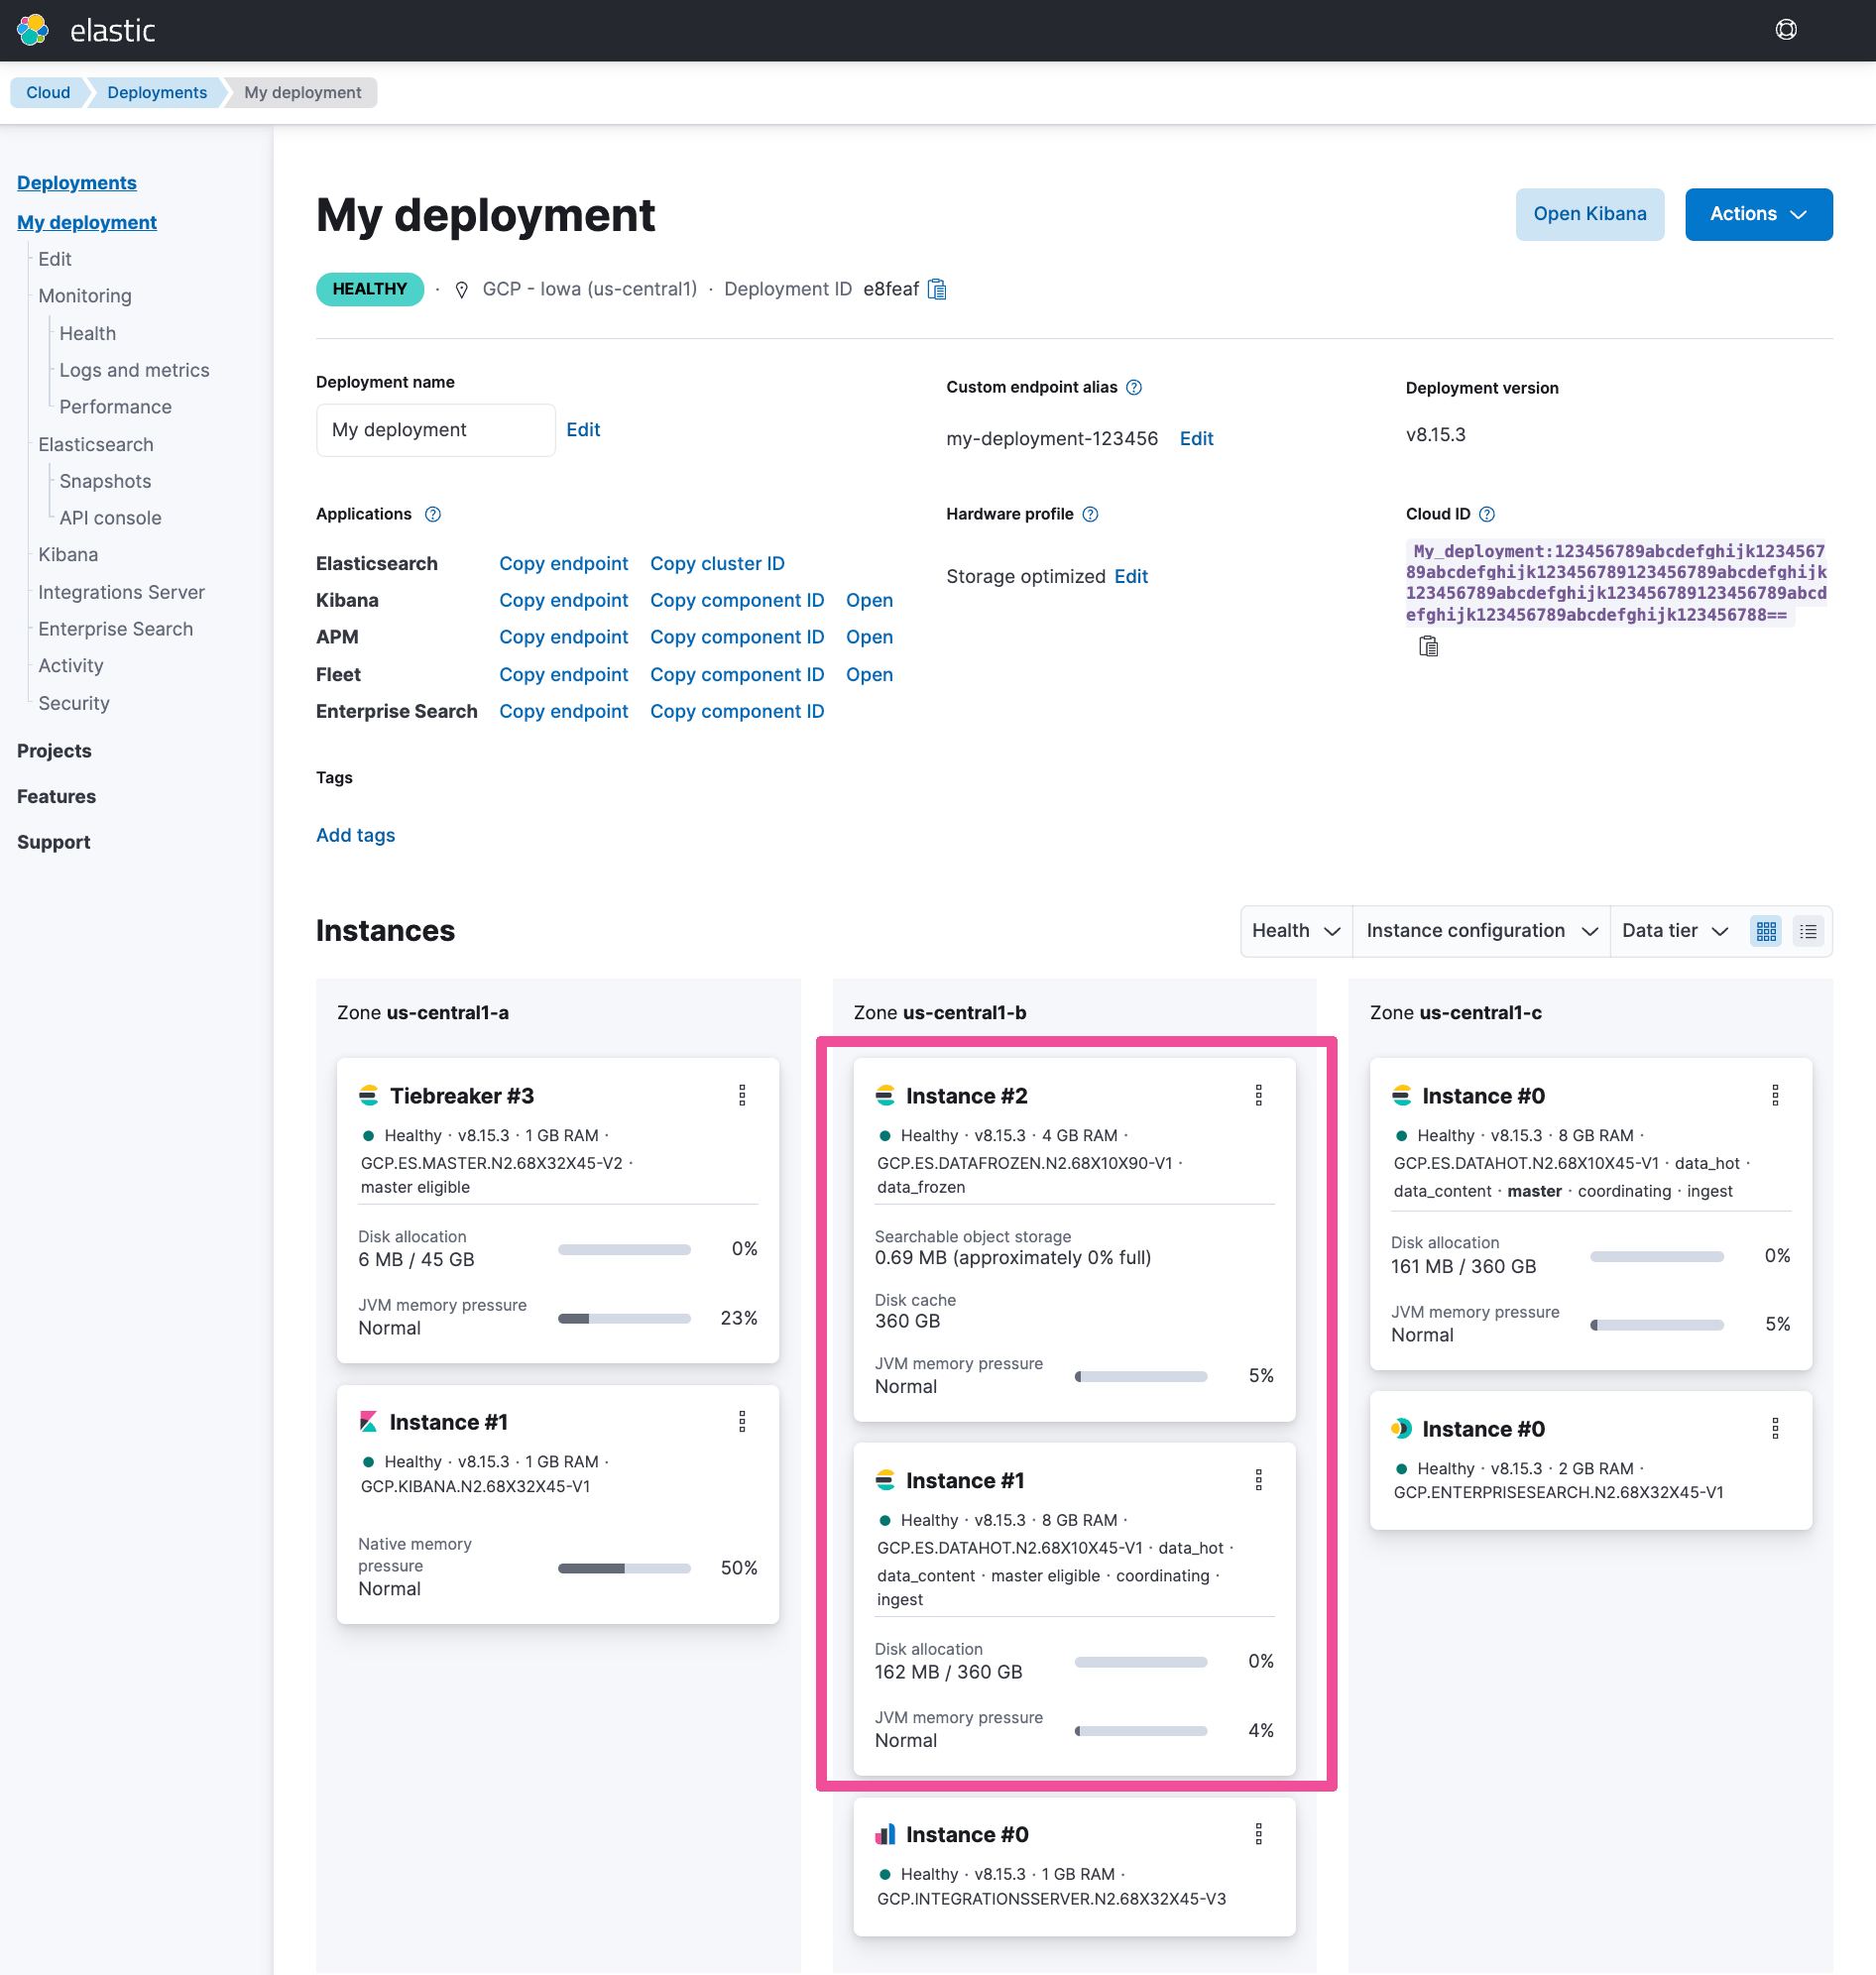
To see an overview of the total storage amount of each data tier and its current state, click the top-level menu and select Manage this deployment.
Optimize your logs storage costs today
Now, you’ve seen the process of creating an index lifecycle policy, which will reduce the storage cost of your data as it ages in Elastic Cloud. Give it a try for yourself. Get your logs into Elastic Cloud, where you can give your data a customized lifecycle policy that’s optimized for your preferred levels of availability and affordability.
To learn more, see a guided tour or check out the docs for index lifecycle management.
The release and timing of any features or functionality described in this post remain at Elastic's sole discretion. Any features or functionality not currently available may not be delivered on time or at all.