Elastic Security in the open: Empowering security teams with prebuilt protections

Detection content for detection engineers
Elastic Security now comes with 1,100+ prebuilt detection rules for Elastic Security users to set up and get their detections and security monitoring going as soon as possible. Of these 1,100+ rules, more than 760 are SIEM detection rules considering multiple log-sources — with the rest running on endpoints utilizing Elastic Security for Endpoint.
Elastic is committed to transparency and openness with the security community, which is the primary reason why we build and maintain our detection logic publicly in collaboration with all who are interested. We find it important to share our research, rules, and other findings back to the security community to allow learning from them and foster further improvement.
In addition to all of this content being built-in and immediately available in Elastic Security, it’s also provided via public GitHub repositories (SIEM detection rules, endpoint rules).
We do not shy away from comparisons with other products focused on detection, so you can find Elastic Security on Tidal Cyber platform.
Why do we provide security content?
We are keenly aware that not every company has resources to research new threats and come up with the detections using the latest technologies and features available. This is where Elastic Security steps in and serves as an extra resource for your security team.
The Elastic TRADE (Threat Research and Detection Engineering) team performs research on emerging and commodity threats, developing and maintaining detection and prevention rules for our users. The team also provides feedback for improving the various query languages used to support security use cases. The TRADE team works closely with our internal InfoSec team, as well as various other engineering teams, ensuring integration of feedback for consistent improvements.
The remainder of this blog post will focus on how to take advantage of the SIEM detection rules and accompanying security content, and how those are created. Let’s dive in!
Elastic rules creation process
1. Identify the topic
The rule development process starts with identifying the topic we want to focus on based on research initiatives, current threat landscape, intelligence analysis, and coverage analysis. We also take into account available and popular integrations, user demand, and trends.
2. Study the topic
Once the technology, threat, or tactic we want to focus on is identified, we study it. See an example of such analysis for Google Workplace. We go in depth understanding the architecture and services provided and identify potential adversary techniques usually mapped to the MITRE ATT&CK framework®.
3. Create the lab
To work on the rules, we may need a lab environment to be able to simulate the threat, generating the data necessary to create and test the detection logic. The above example gives you a peek behind the scenes of such lab creation for Google Workplace. The same approach goes into creating and maintaining lab environments for all of the data sources we create rules for.
4. Work on the rules
Generally, the rule author determines the rule type to use; follows best practices to create a performant, low-false-positives detection logic; tests it; and creates the rule file with all the necessary metadata fields. TRADE’s philosophy is at the core of proper rule development and testing.
5. Conduct a peer review
Next, the rule is up for a peer review. Of course, reviewers also need to understand the technology and threats addressed by the new detection. It is critical for colleagues to assess the existing detection logic to identify edge cases where the logic may potentially be flawed. Rules have the capability to be bypassed by a threat or become noisy in customer environments, so identifying a balance is important.
6. Coverage considerations
When looking to improve our detection coverage, we also check if any existing rule could be adjusted to accommodate the new detection and if it would be reasonable from the security analyst perspective when they investigate the generated alerts. This allows rule authors to focus more on qualitative versus quantitative rule production.
Sometimes in this process, we determine the rule would generate too many false-positives and end up putting it on the shelf to release as a building block rule. Other times, we spot the gaps in the data coverage that prevent us from creating effective detection logic and work with the other teams in Elastic to address the gaps, postponing the rule creation.
We understand and expect that out-of-the-box detection rule coverage might not be a perfect environmental fit for everyone, which is why the rules are forkable in Kibana, in case you need to modify it. A simpler approach is tuning the rule by adding exceptions to update it based on your threat model and the specifics of your environment. You can read more about our approach to rule development so you know what to expect from our rules.
You can follow our rules development in the detection rules repo. If you have a rule you want to share with other Elastic users, consider opening it up to the community via our repo like others have done.
Wait! It’s not only new rules!
Apart from the rule creation work, the team spends a considerable amount of time monitoring and tuning the existing rules. From time to time we will also deprecate rules that no longer match our standards.
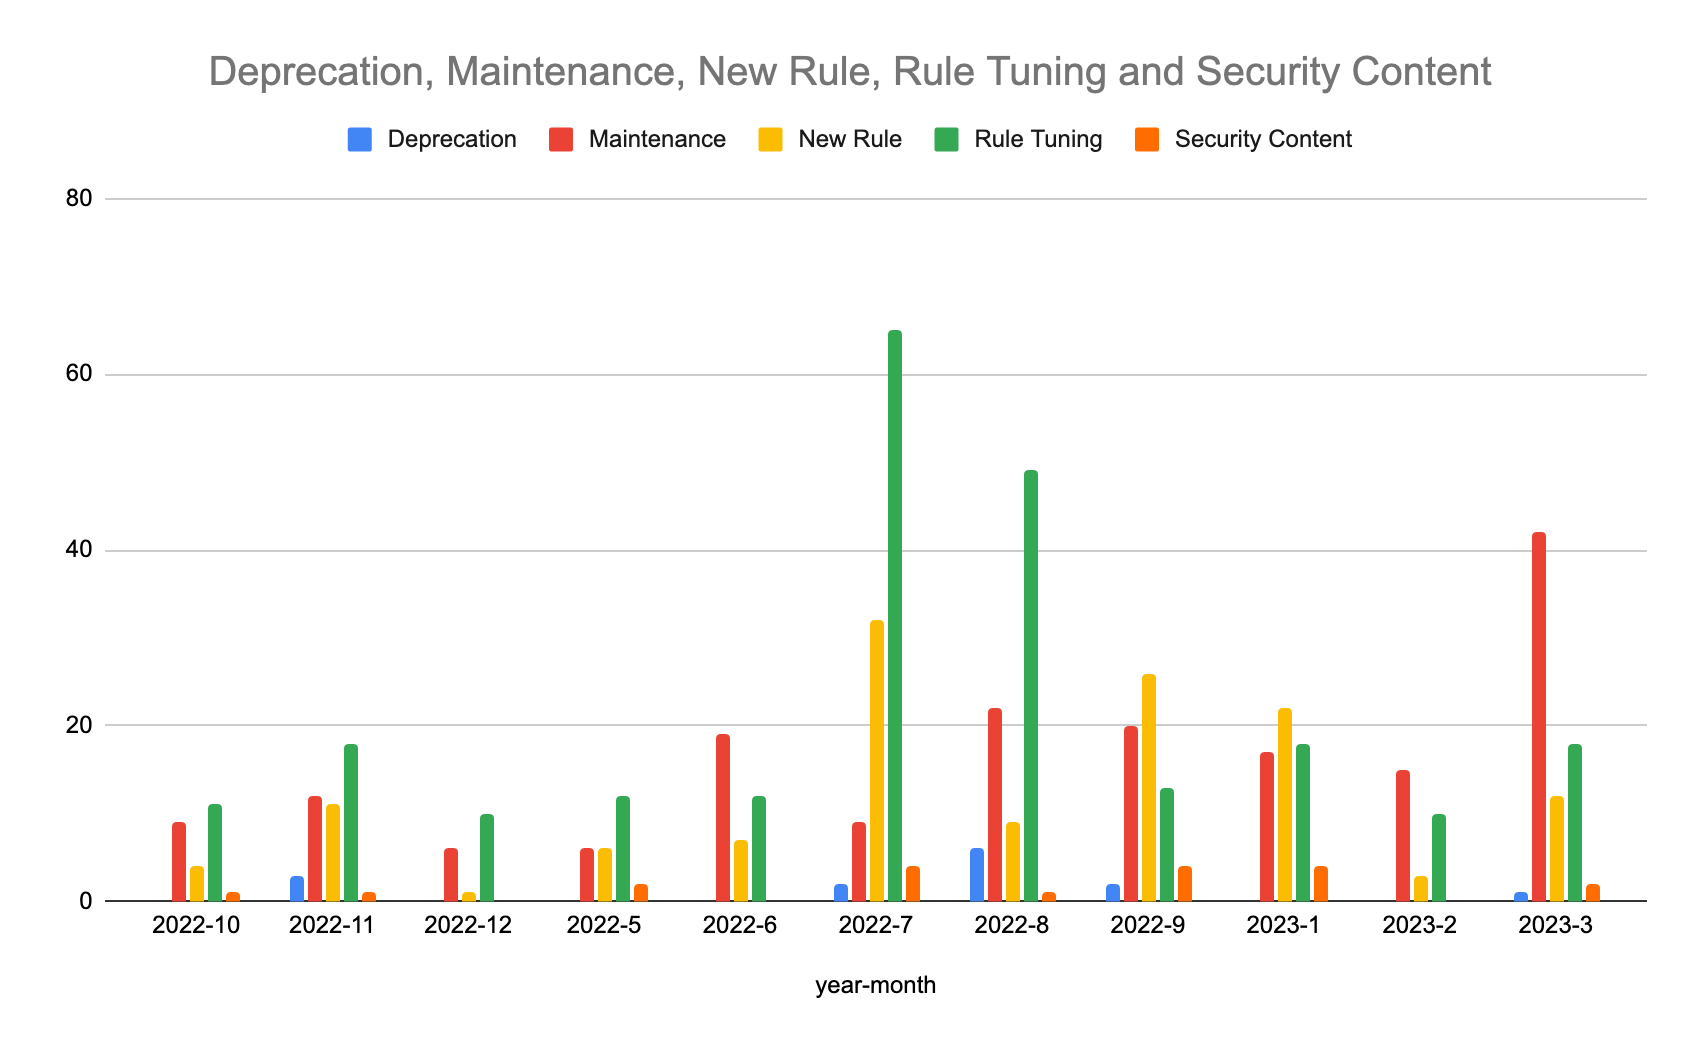
We love data, and we looked at the last 600 pull requests to the detection rules repo to see what types of work we’ve done on detection rules. As you can see in the chart below, tuning and maintenance are outnumbering the new rules creation, since we want to keep our detection high quality and up to date.

Elastic Security Labs researchers are regularly reviewing the telemetry data to see which rules need tuning based on the prevalence of alerts and rule-specific parameters.
Elastic Security telemetry is voluntarily shared by our users and used to improve product performance and feature efficacy. By the way, the recent Elastic Global Threat Report is based on the data shared by our users. In the threat report, we shared our global observations and context for the threat landscape you can use to guide your custom rules creation.
While reviewing telemetry for rule efficacy, threat identification is prioritized as well where engineers put on their research hats and review true-positive (TP) alerts. TP telemetry requires its own separate triaging workflow but potentially leads to new rule development or deeper investigation. TRADE also contributes research and advanced analysis to Elastic Security Labs, especially with the more technical analysis such as malware reverse engineering, adversary profiling, infrastructure discovery, and atomic indicator collection. We often collaborate with other internal research teams on this research.
Detection content for security analysts
Detection rules are not only for the detection engineers to use, but also for security analysts who work on alert triage and investigations.
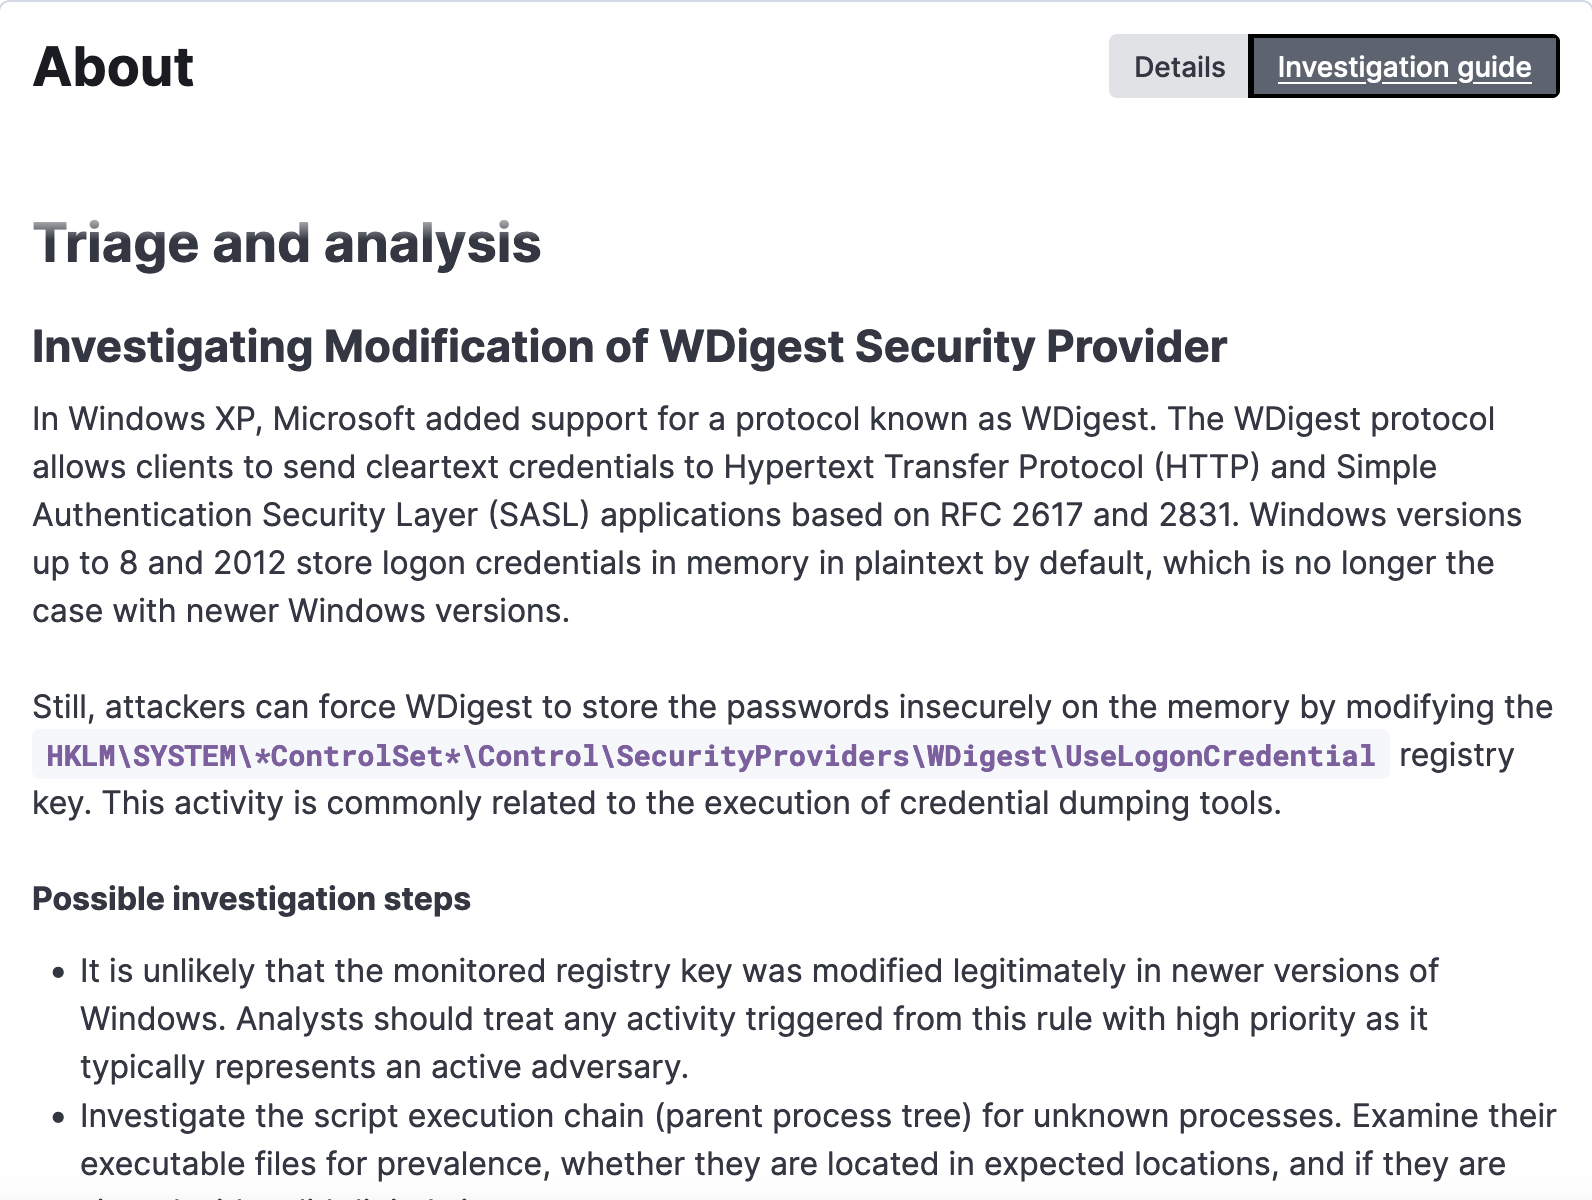
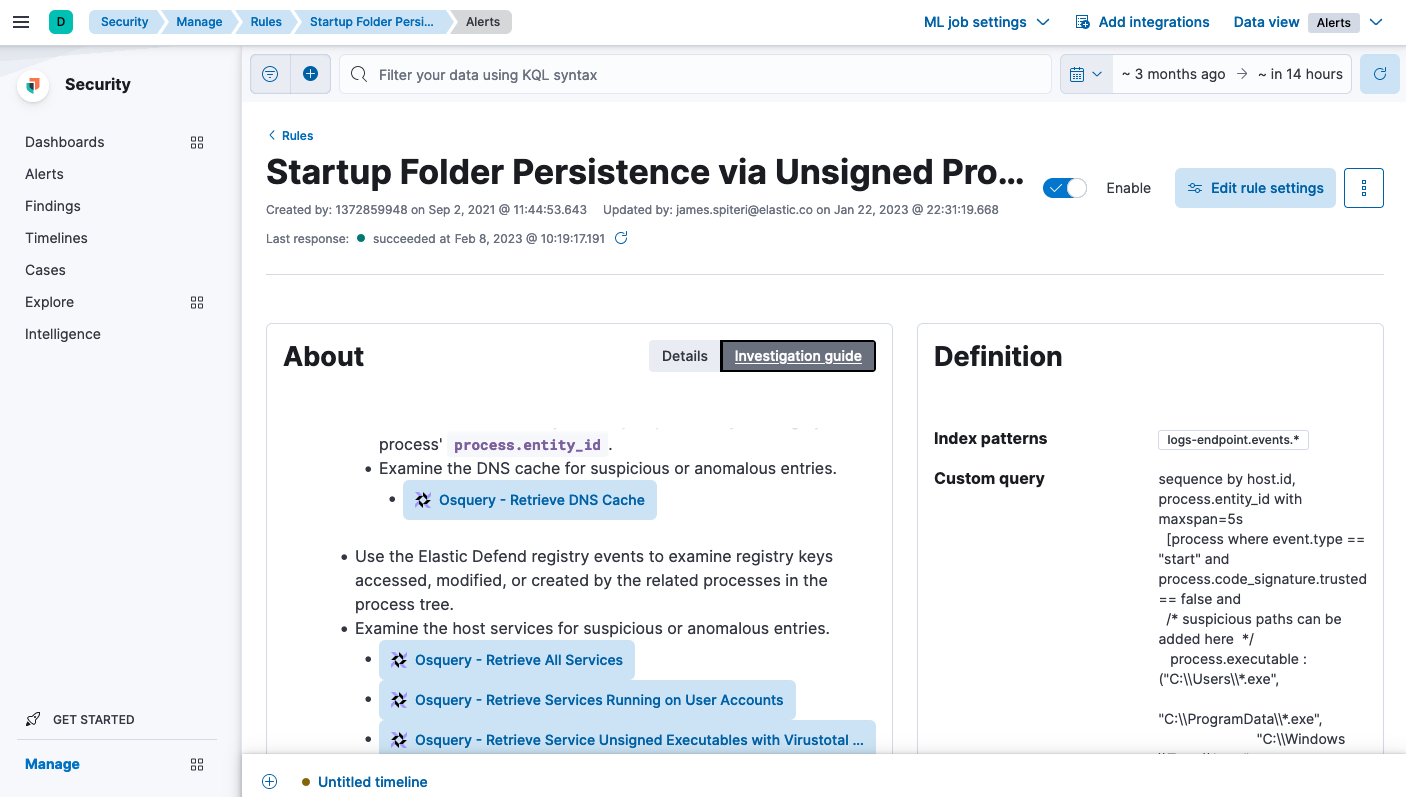
For security analysts, we provide operational threat context by enriching rules with additional information like investigation guides. The rule authors add information about the attack/behavior, pointers for investigation, false positives, analysis, and remediation steps. This information is very useful for the analysts who view the alert and need to quickly understand why the alert was triggered and define the next steps. The investigation guide can also be viewed within the alert interface in the Elastic Security solution.
We recommend creating investigation guides for your custom rules as well — those prove to be a valuable resource to the security teams.

We are working toward a full coverage of threat detection rules with investigation guides. At the time of this publication, about 30% of all prebuilt rules come with investigation guides. You can easily filter for prebuilt rules with the guides using the “Investigation Guide” tag.
Product telemetry is also used for prioritization of the guides development. We look for the most used rules by our users and provide information where it will be most useful for our customers.
Our roadmap consists of continuous improvement to investigation guides with regard to triaging and remediation recommendations, as well as feature improvements. For example, in Elastic Stack versions 8.5+, investigation guides may contain custom usable Osquery searches that will query endpoints for additional telemetry that may prove helpful during analysis or triage.

If you have feedback or suggestions for the investigation guides, let us know by opening a GitHub issue. We value community contributions!
While quality detection logic is at the core of helping identify potential threats, we also understand the importance of additional context regarding a specific threat that may prove useful for analysts. With prebuilt detection rules, Elastic strives to provide as much context about the rule itself.
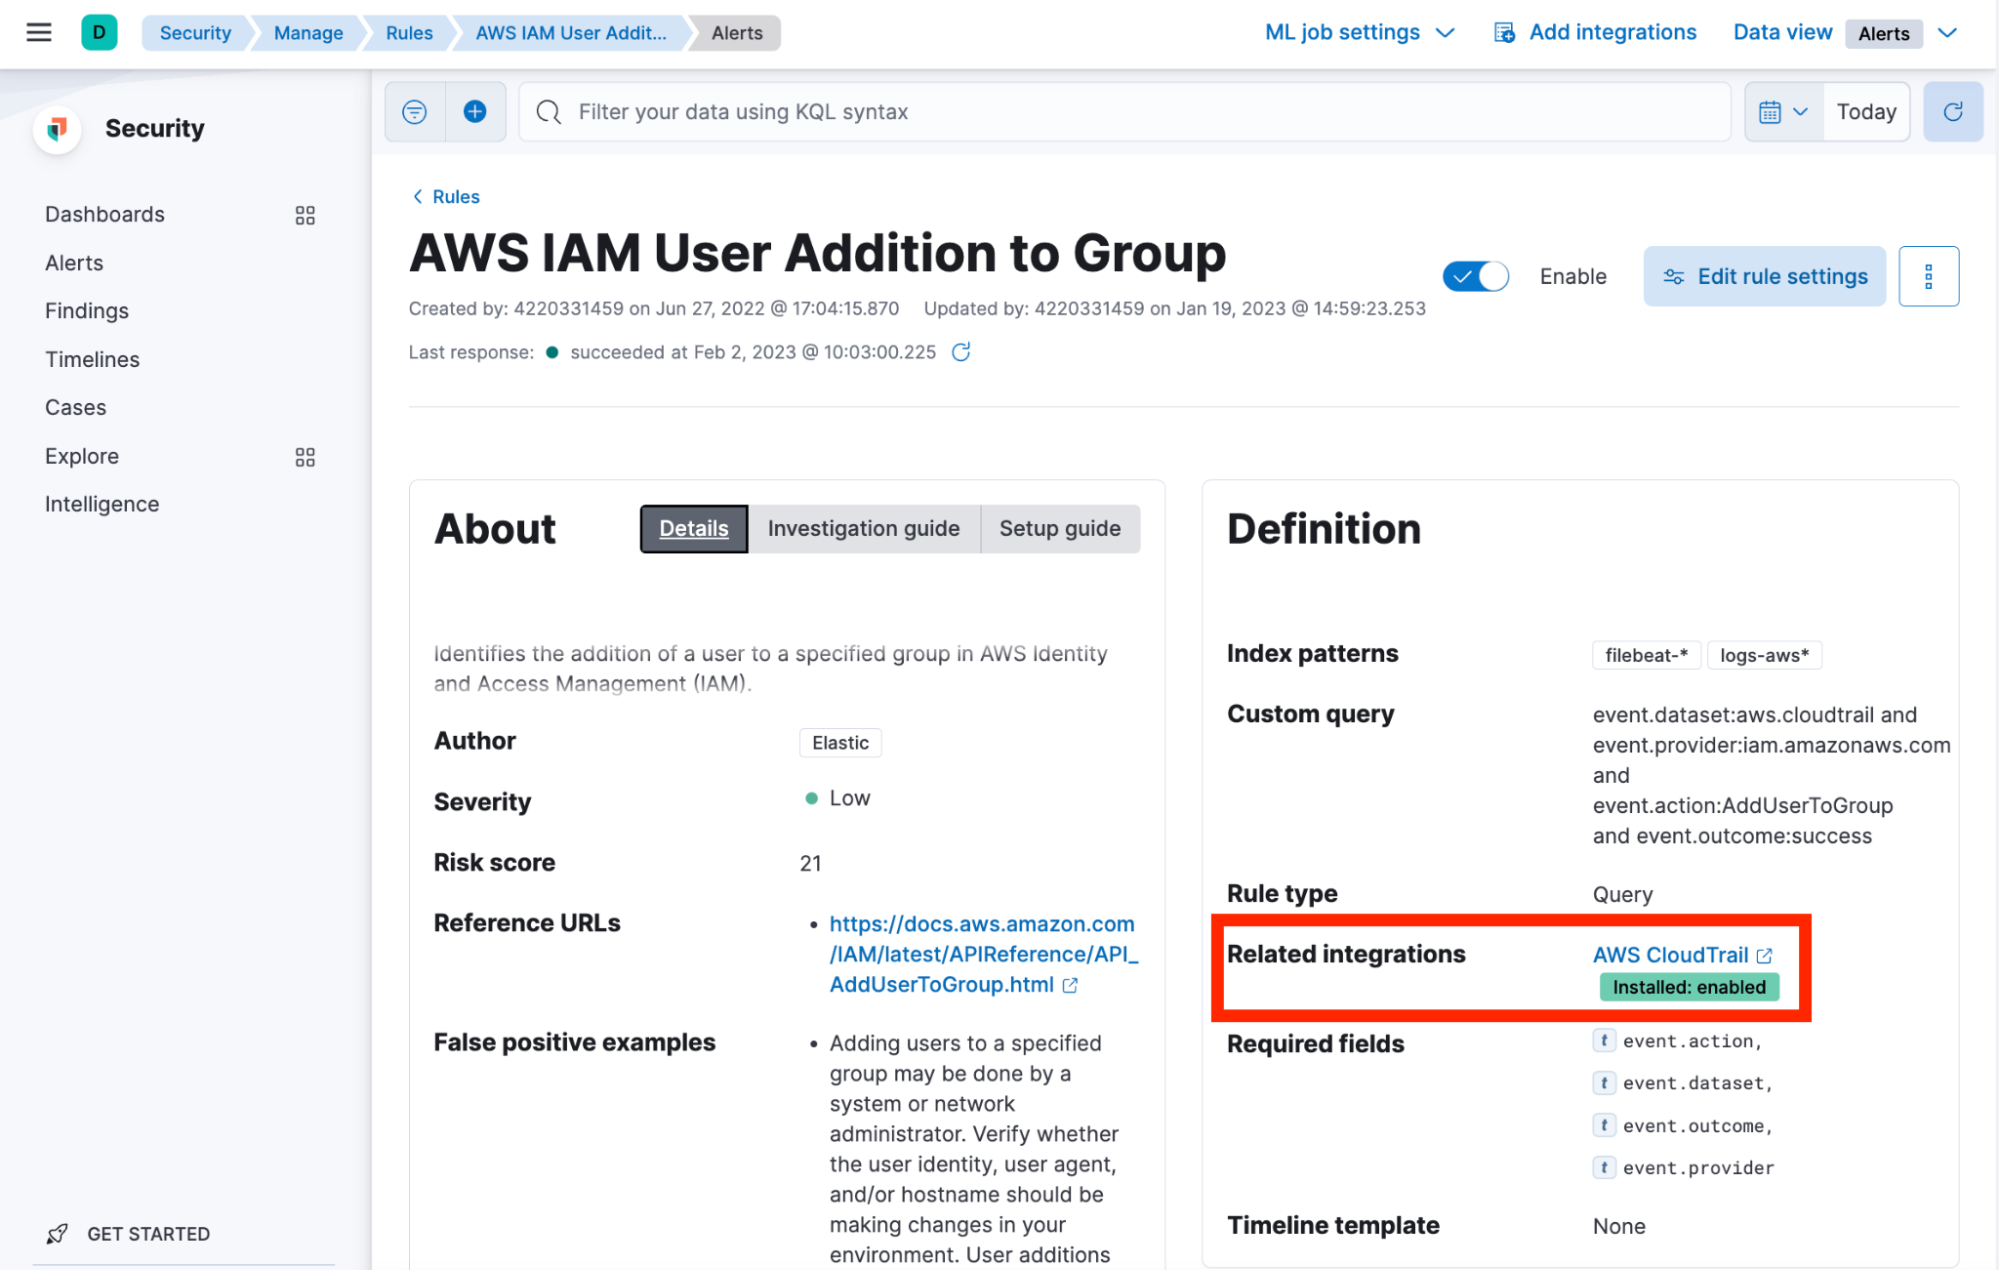
Aside from investigation guides, we map all rules to their specific MITRE ATT&CK matrix and identify severity and risk of the alert for you. Additionally, while ingesting various data sources may be confusing when choosing which rules are applicable, we help identify which integrations are necessary for specific rules. You can use the Related Integrations field to navigate to a relevant integration, set it up, and (if needed) enable the related rule to ensure that you have the right data sets ingested.

Rule updates including additional context are released regularly out of band and provided to the users directly in the Elastic Security solution. We recommend upgrading your Stack to the recent versions, so that the rules that rely on the new security features can be used to their fullest.
Anything else?
The TRADE team also works on and publishes a feature of Detection Rules called Red Team Automation (RTA). This feature, written in Python, aids the rules testing. RTA scripts are used to generate benign TPs and help the team automate regression testing of the Detection rules against multiple versions of the Elastic Security Solution. You can also use the published RTA scripts for your testing purposes or create the new ones for your custom rules.
For the deeper dive on RTA and other tools the team provides, read this blog.
Stay tuned for more
As you can see, we aim to provide prebuilt content throughout all of the detection workflow and rules lifecycle — from rule creation, to usage, to maintenance, and testing. And again, all of this content is provided in-product and openly shared with the community via GitHub.
We’re always striving to make our customers’ systems more secure and their teams’ lives easier. Feel free to reach out to us to share your ideas and pains. We can be reached via our Slack community or by posting on our Discuss forum.