Threat modeling: As easy as OATMEAL


 Share on Twitter
Share on Twitter

 Share on LinkedIn
Share on LinkedIn

 Share on Facebook
Share on Facebook

 Share by Email
Share by Email

 Print this page
Print
OATMEAL makes threat modeling less threatening
Threat actors are constantly evolving their tactics, techniques, and procedures (TTPs), which often makes understanding and mitigating potential threats a daunting task. Traditional threat modeling frameworks can fall short or even be seen as intimidating to defenders trying to model potential threats. This is often due to the complexity or amount of effort and knowledge required to build threat models. Additionally, many threat models limit the potential audience due to overly complex or detailed presentations, limiting the overall effectiveness of the model.
To bridge this gap, we have developed the OATMEAL threat modeling framework. OATMEAL stands for Overlays And Threat Modeling Events And Limitations, and it is designed to provide a comprehensive, yet straightforward and unintimidating approach to threat modeling.
Keeping threat actors out of our breakfast
The primary goal of OATMEAL is to produce a clear and concise model that depicts an environment or process in a simple, clear format. Anyone should be able to view the output of the OATMEAL process and think, “OK, that makes sense to me.” The model is used to draw conclusions and present recommendations to improve the overall security posture. At the end of the day, OATMEAL exists to understand the environment or process and how threat actors may try to abuse or attack them.
OK, but why OATMEAL?
The core of OATMEAL is built on the concept of overlays, which are meant to be viewed individually or in conjunction with each other to arrive at some conclusion. Overlays can be thought of as different layers on a map that show specific things. As an example, think of a weather map that shows the area (base layer) with potential wind (layer 1), temperature (layer 2), and precipitation (layer 3.) While each of these layers contains valuable information on their own, the real analytical power lies with seeing them together, potentially identifying hazardous situations due to a combination of temperature and precipitation.
What are the “ingredients”?
High-level overview
Controls
Detections
Gaps
Threat scenarios
Mitigations
Recommendations
So, how do we make OATMEAL?
Define the thing (environment or process)
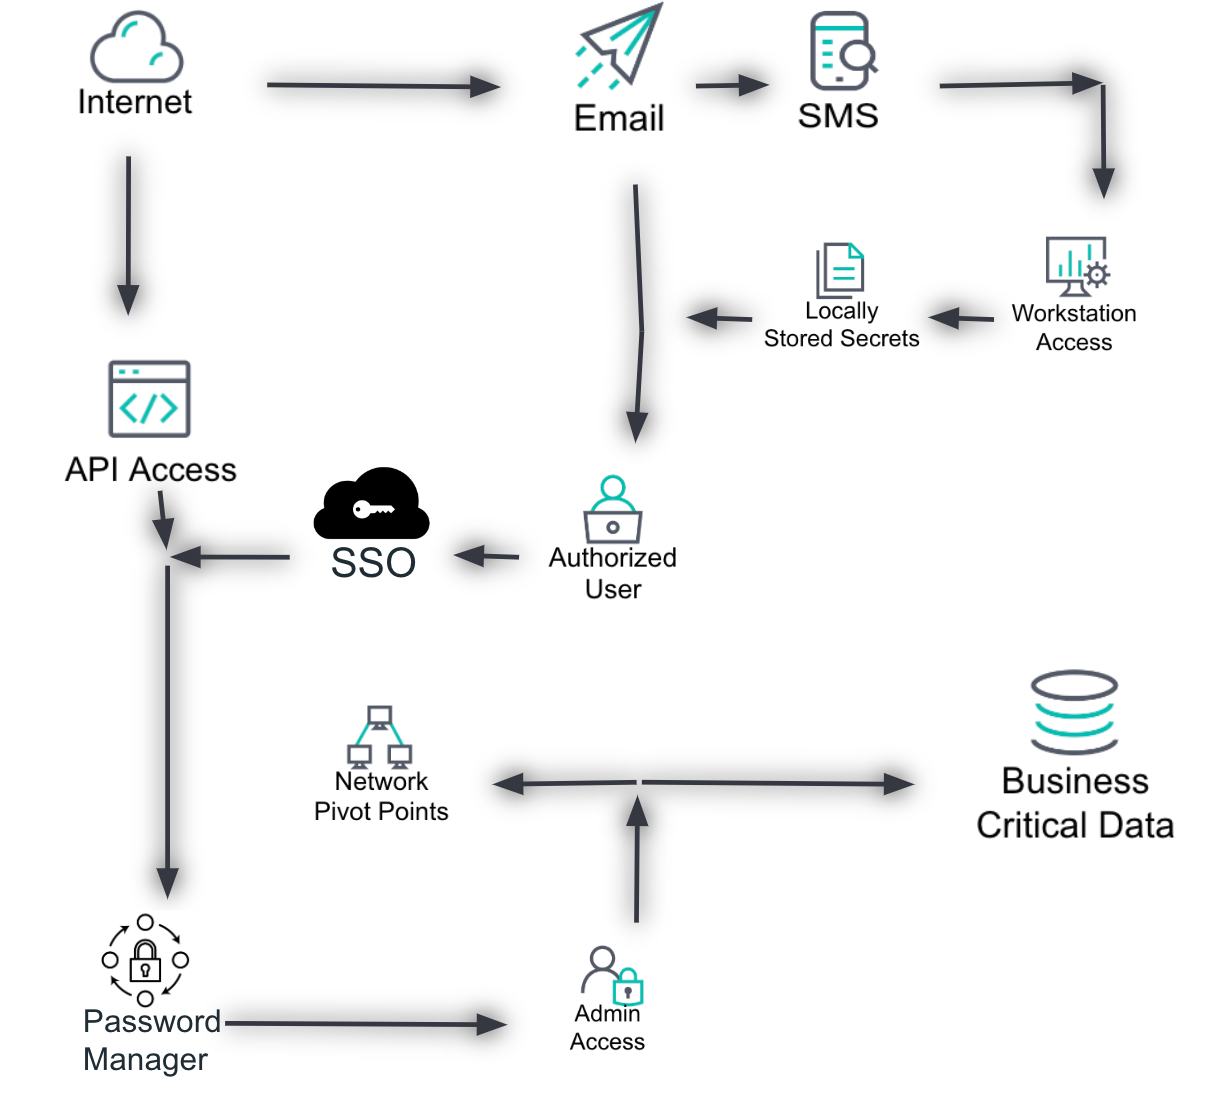
This foundational layer depicts the environment in a simple, logical format. It includes entry points; key aspects within the environment, such as data, servers, services, and relevant accounts; and potential outcomes. The goal is to give a clear understanding of how components interact and connect.
Entry points: Identify all possible entry points into the environment, such as network interfaces, user access points, and external connections.
Key aspects: Highlight critical components within the environment, including sensitive data repositories, essential servers, critical services, and privileged accounts.
Potential outcomes: Outline what could be done with access to the environment, such as data exfiltration, service disruption, or unauthorized access to sensitive information.
Start by depicting the environment in a simple, logical format. Use a tool like Google Slides or PowerPoint to create a visual representation. The goal is to lay out the environment or process in a way that shows how information or data flows (not necessarily the individual devices or endpoints but the high-level components).
Document current controls
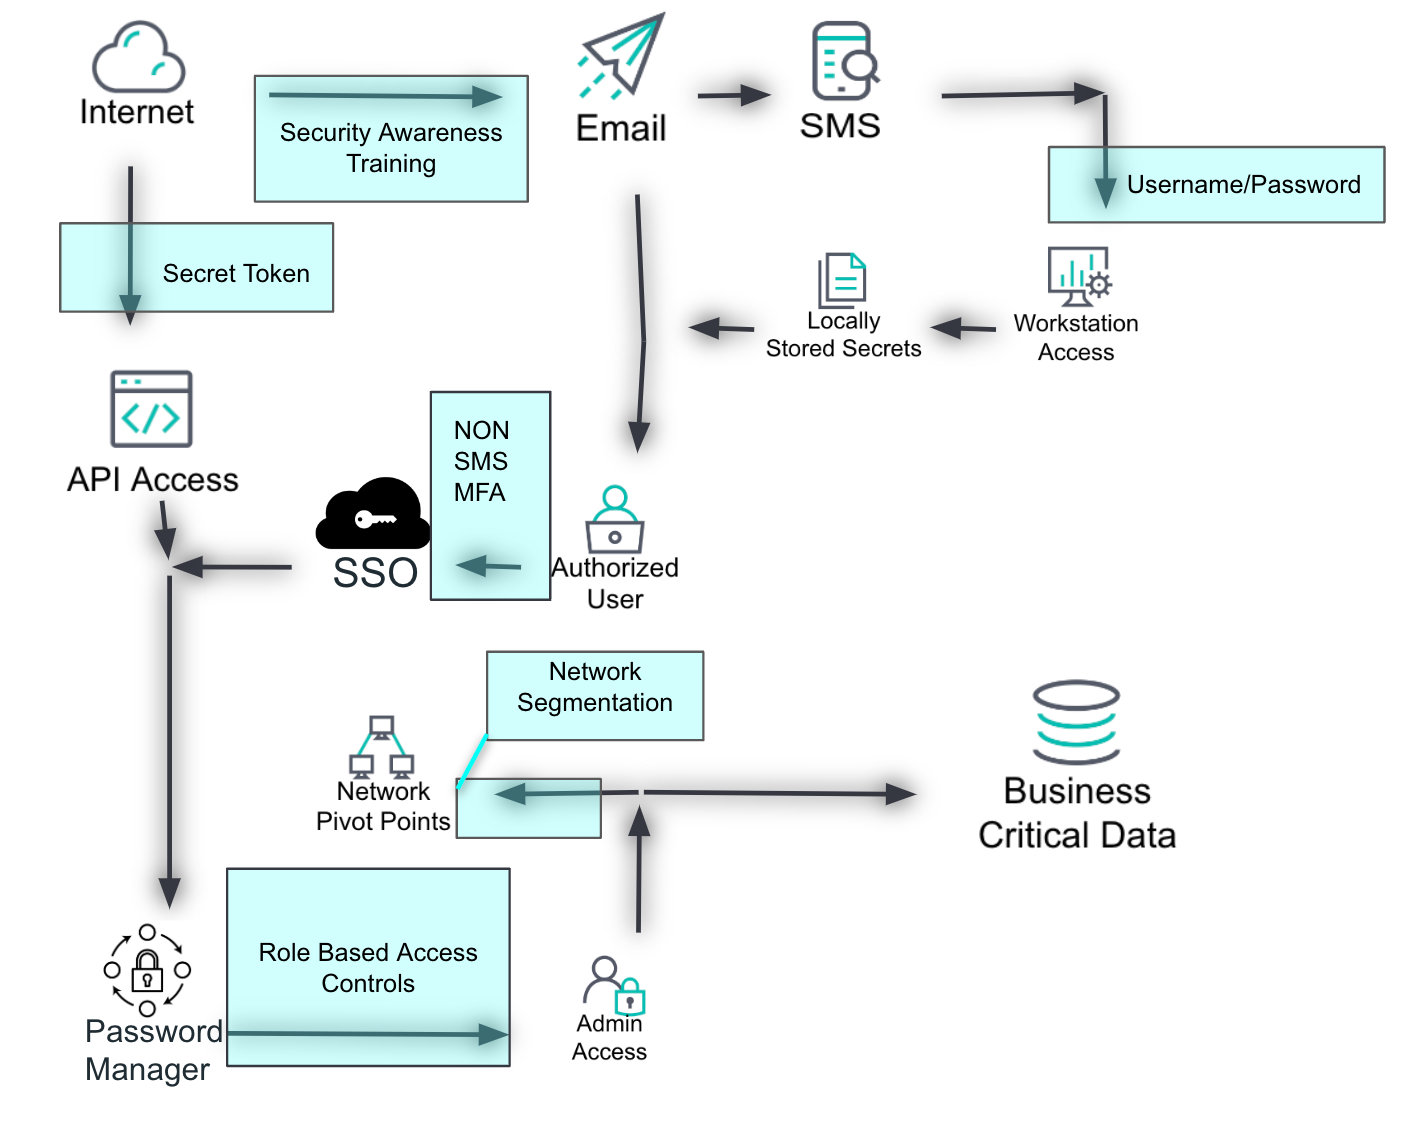
This layer shows the controls that are currently in place to prevent undesired actions. Controls are depicted as transparent boxes over the parts of the environment they protect. This helps identify where controls are effective and where gaps may exist.
Types of controls include firewalls, intrusion prevention systems, access controls, encryption, and other security measures.
Coverage indicates which parts of the environment each control protects, ensuring a clear understanding of the control landscape.
Duplicate the overview slide and add a layer for currently implemented controls. Use transparent boxes to indicate the areas covered by each control.
Identify what can be seen
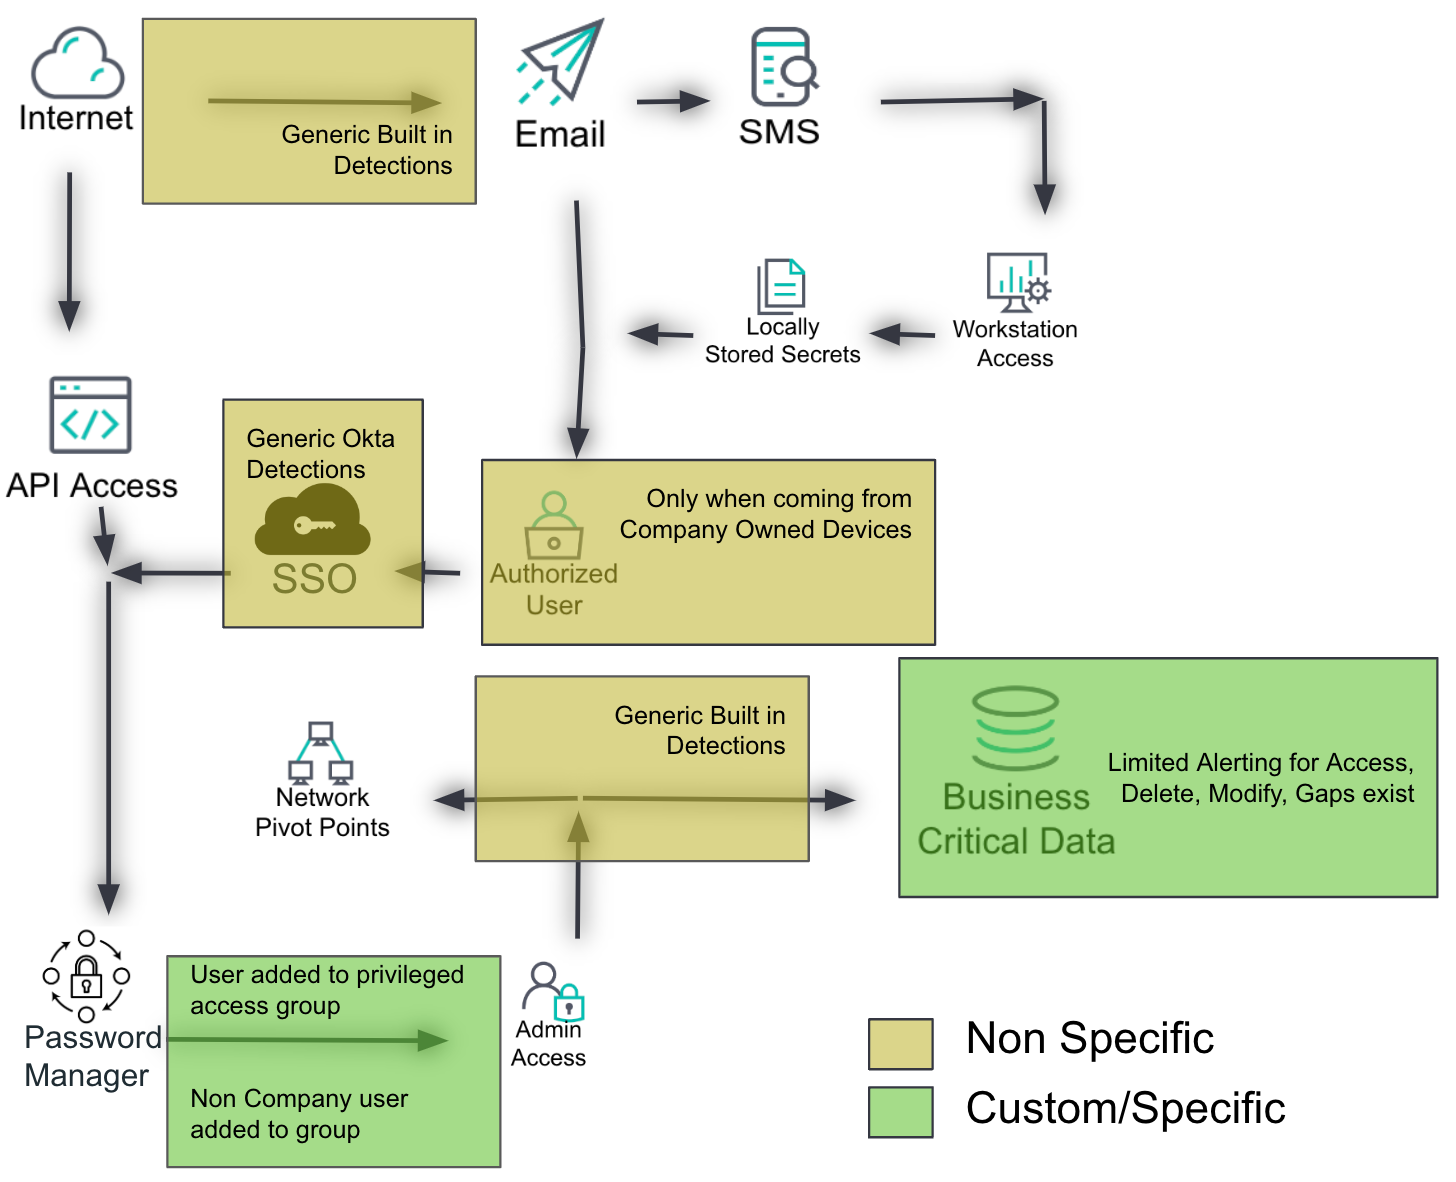
This layer highlights the detections that are in place to alert on potential malicious activity. Detections are categorized into "generic or out-of-the-box" and "specific or custom-made" detections. This helps in understanding the visibility over the environment.
Generic detections include standard detection rules provided by security tools, such as antivirus software or intrusion detection systems.
Custom detections include tailored detection rules designed to address specific threats unique to the environment.
Duplicate the overview slide and add a layer for currently implemented detections. Use transparent boxes (with a new color) to indicate the areas covered by each detection.
Learn what you don’t know
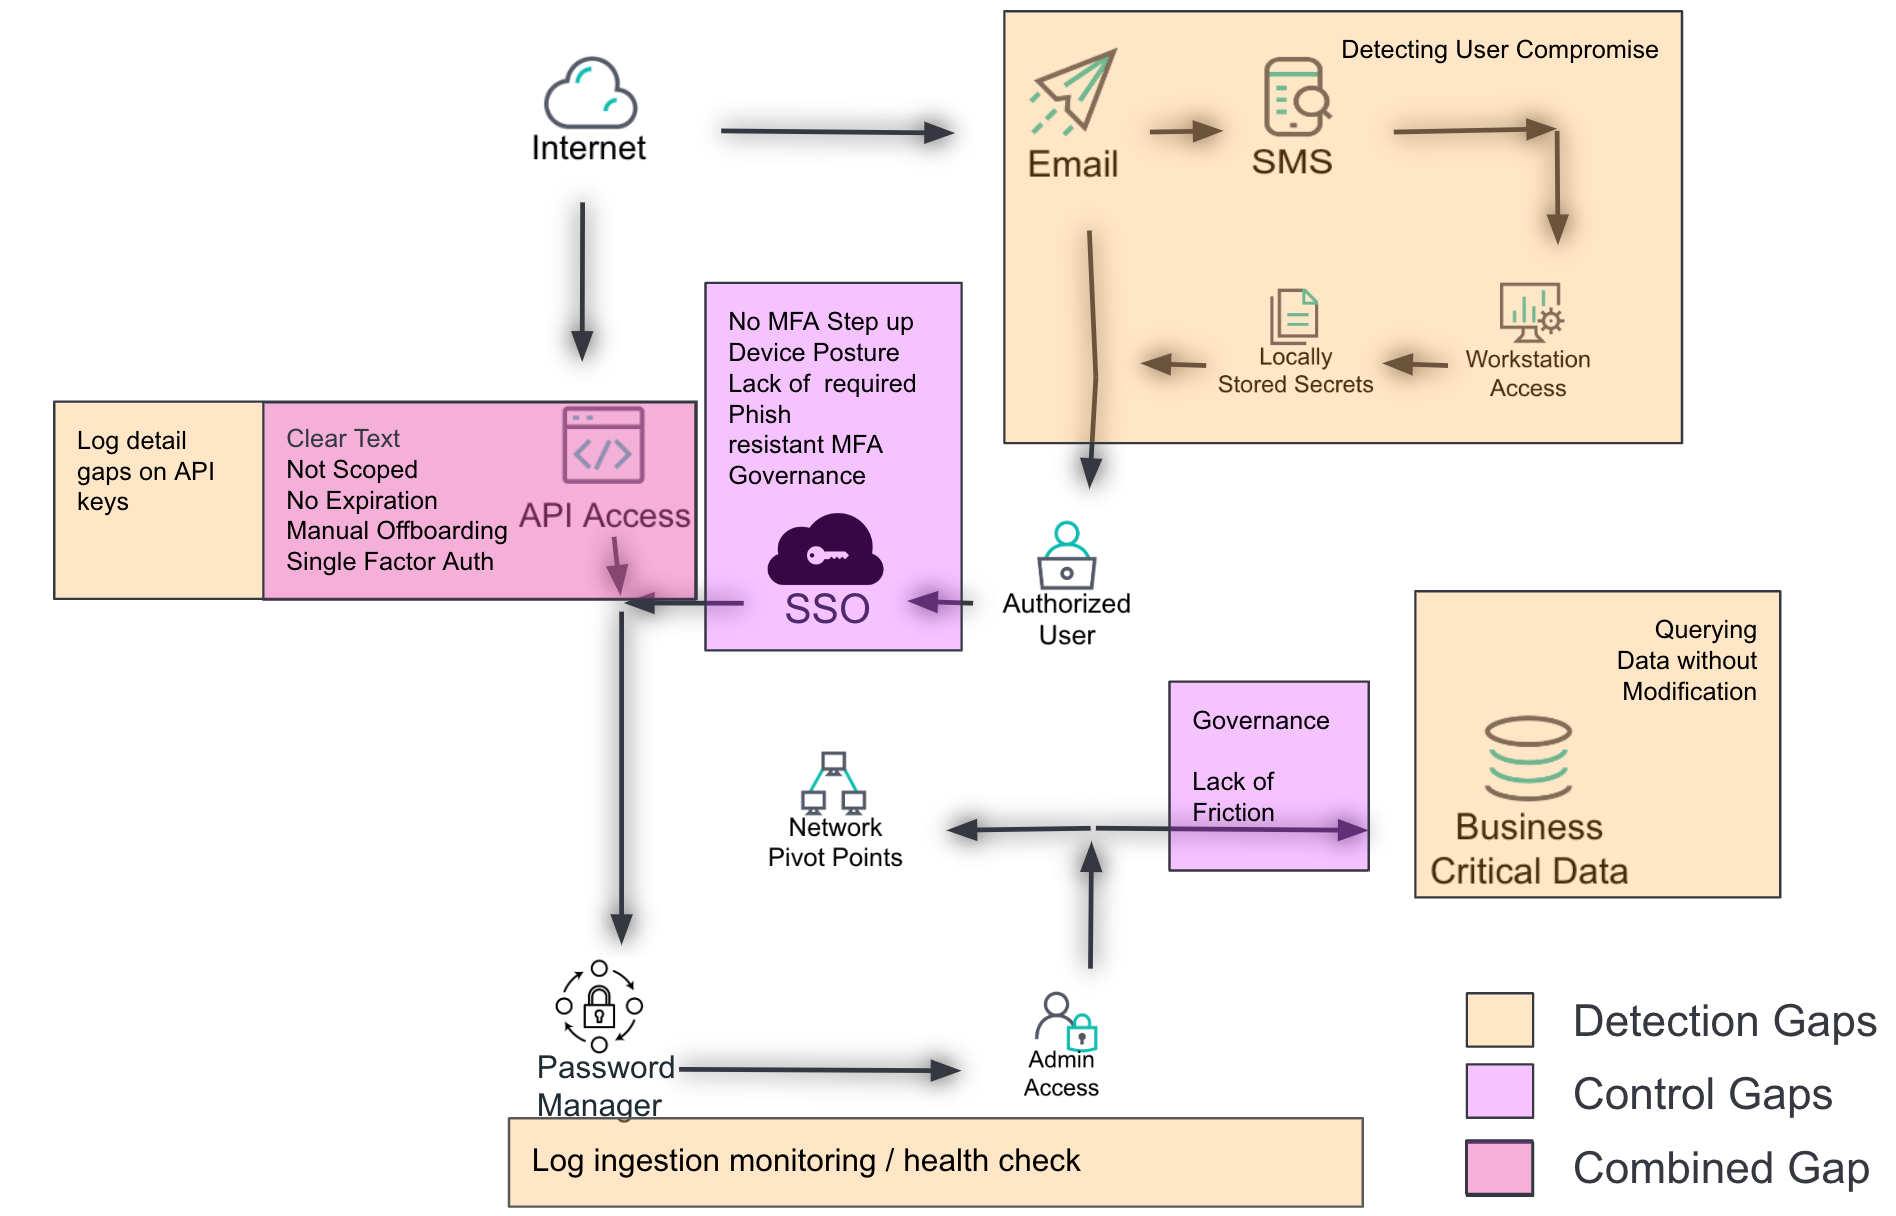
Based on the previous layers, this layer identifies known gaps in the environment — both from a control and detection perspective. Gaps are depicted using different colors to distinguish between control gaps, detection gaps, and combined gaps.
Control gaps: Areas where preventive measures are lacking or insufficient
Detection gaps: Areas where monitoring and alerting mechanisms are inadequate
Combined gaps: Areas where both control and detection measures are lacking
Create a layer for control and detection gaps based on the previous layers. Use different colors to distinguish between control gaps, detection gaps, and combined gaps.
Through the eyes of an attacker
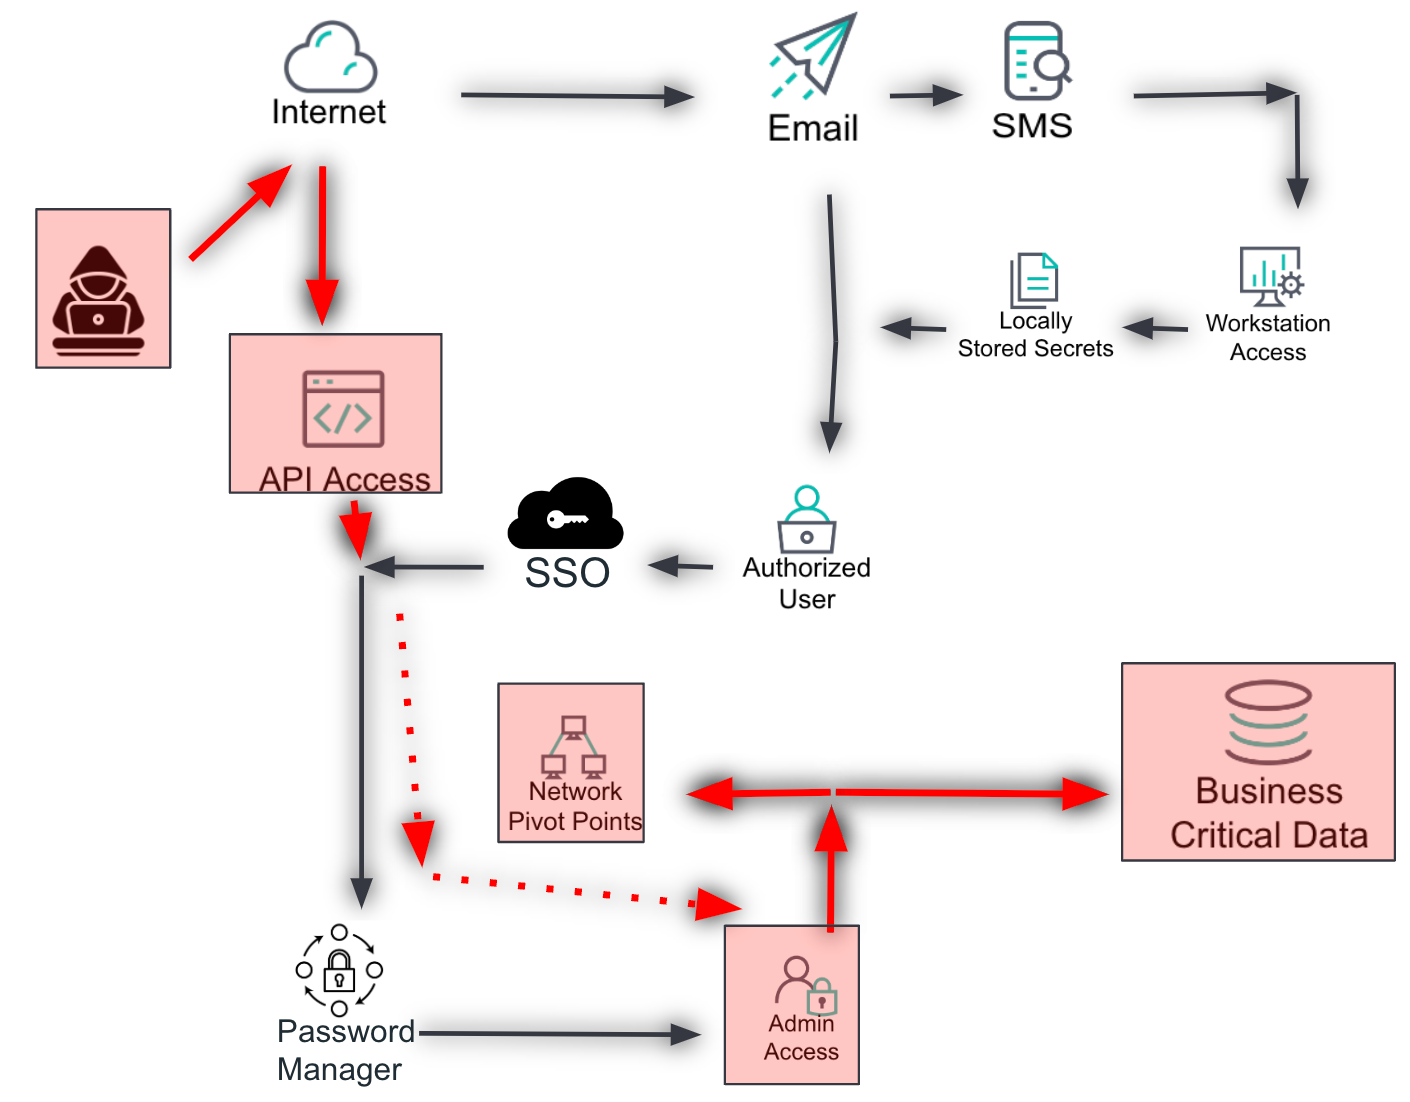
Most likely
This layer helps the analyst to identify the most likely scenario in which an attacker would try to compromise the environment. It combines analyzed threat actor activity, common TTPs, environment variables, known gaps, and controls. The goal is to prioritize recommendations and improve defenses.
Threat actor activity: Analyze recent threat intelligence to identify common attack patterns and behaviors.
TTPs: Use frameworks like MITRE ATT&CK to map out potential attack vectors.
Environment variables: Consider unique aspects of the environment that may influence the likelihood of specific attack scenarios.
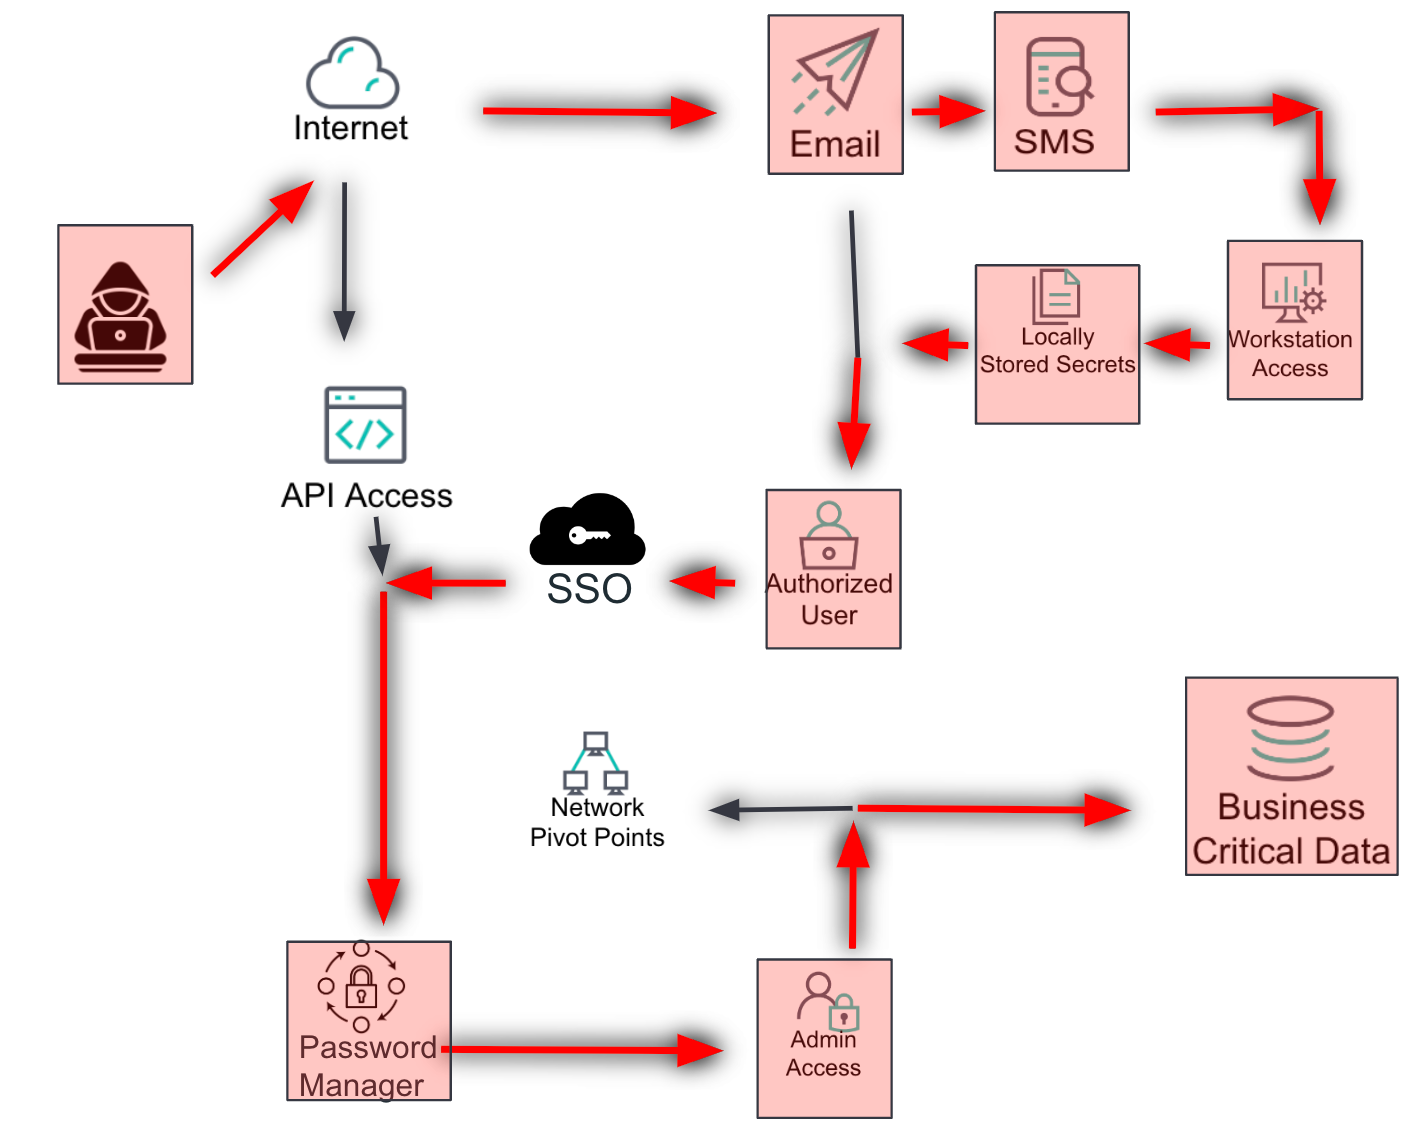
Most impactful
This layer helps the analyst identify the most impactful scenario in which an attacker would try to compromise the environment. It considers the potential damage or impact and helps prioritize recommendations based on the worst-case scenario.
Impact assessment: Evaluate the potential consequences of an attack, such as financial loss, reputational damage, or operational disruption.
- Worst-case scenario: Identify the attack scenario that would cause the most significant harm to the organization.
Duplicate the overview slide twice, then add layers for the most likely scenario and the most impactful scenario. Identify and analyze these based on the controls, detections, and gaps previously identified. Use transparent boxes in a color not previously used and highlighted red arrows to indicate the path the attacker might take, as well as compromised services along the way.
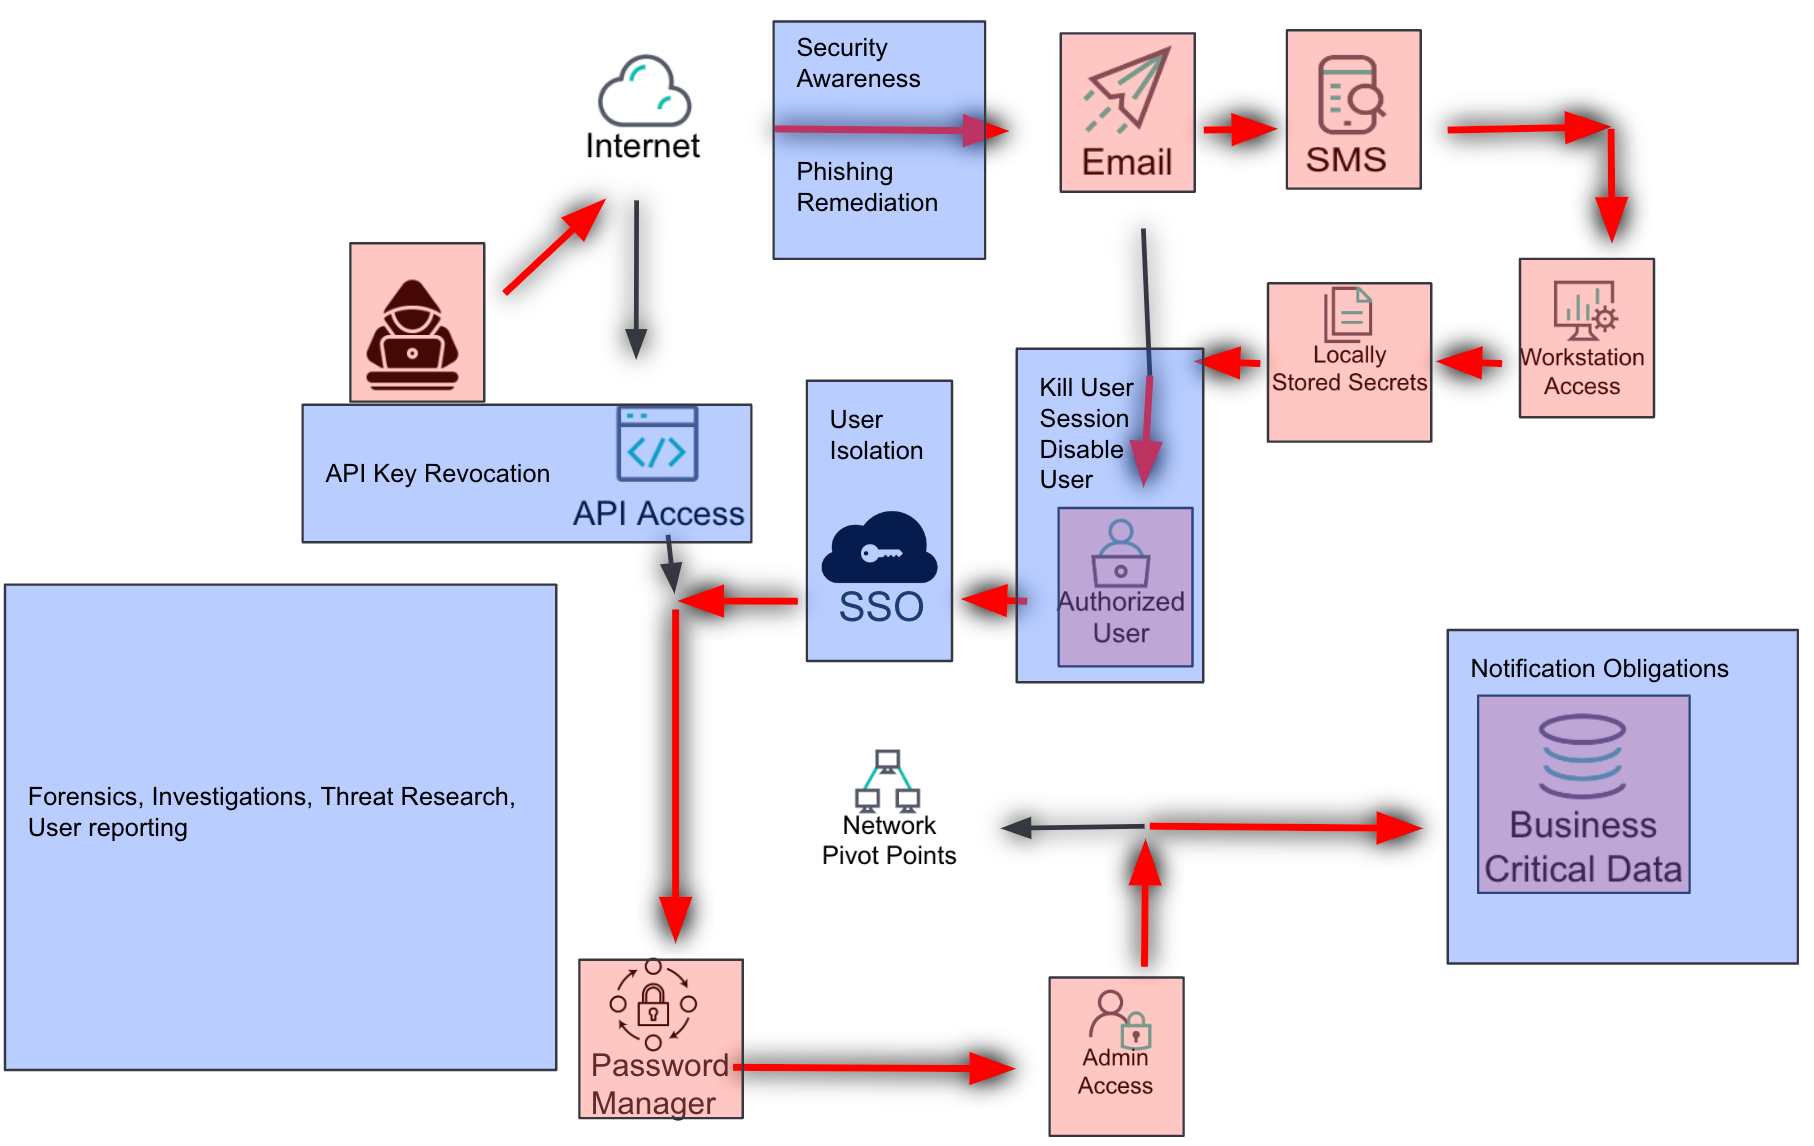
We’re not just going to let them do that, right?
This layer documents the mitigations that are currently in place to slow down or stop an attacker. It includes technical, operational, legal, regulatory, or any other processes that mitigate potential damage.
Technical mitigations include measures like network segmentation, endpoint protection, and automated response actions.
Operational mitigations include incident response plans, security awareness training, and regular security audits.
Legal and regulatory mitigations include compliance with industry standards and regulations, such as GDPR or HIPAA.
Duplicate the overview slide and add a layer for mitigations. Identify and document all mitigations currently in place that may slow down an attacker or allow responders to take action when malicious activity is identified. Use transparent boxes in a color not previously used to indicate where mitigations would be applied.
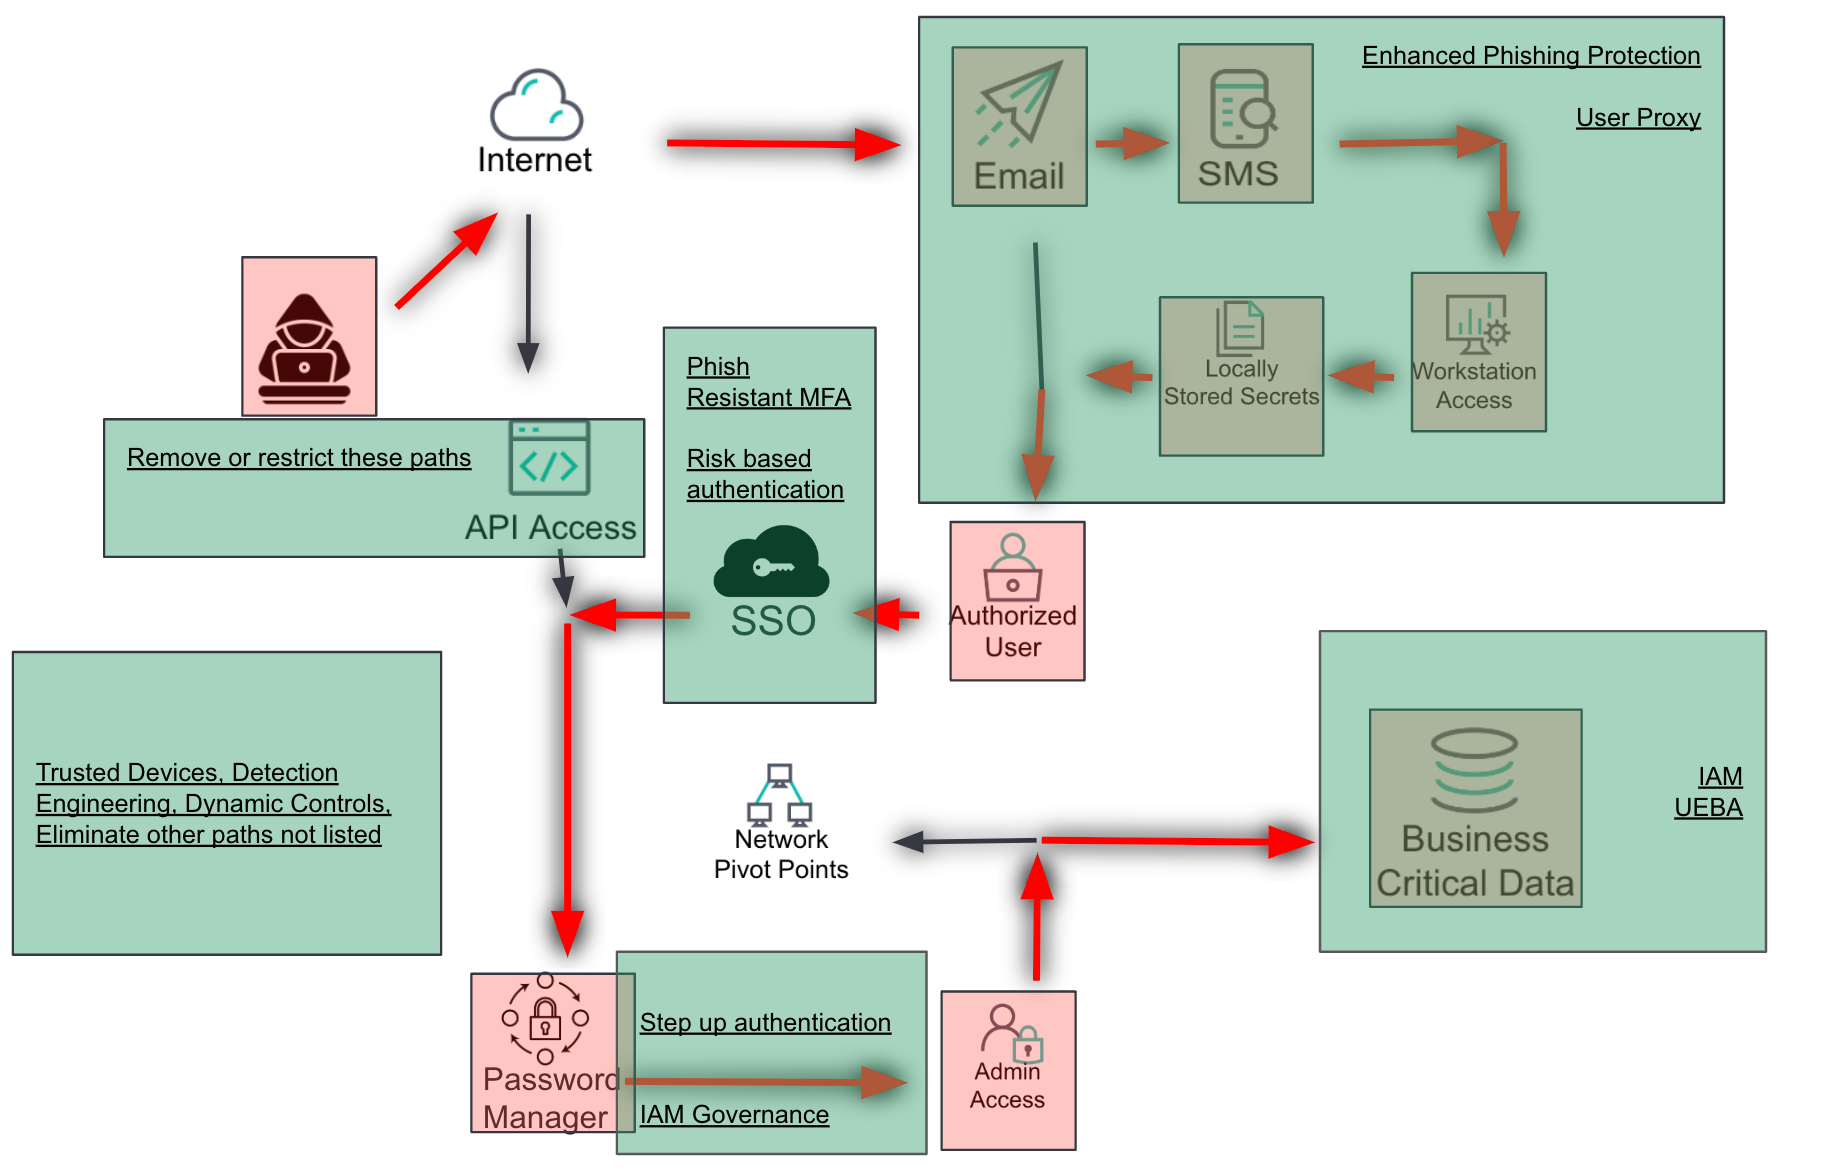
OK, but this is still scary — how do we make it better?
The final layer provides actionable recommendations to improve the security posture of the environment. Recommendations are based on the identified gaps and are prioritized according to the potential impact scenarios and current mitigations.
Actionable steps: Provide clear and specific actions that can be taken to address identified gaps.
Prioritization: Rank recommendations based on their potential impact and feasibility.
Implementation guidance: Offer practical advice on how to implement the recommendations effectively.
Based on the identified gaps and attack scenarios, provide actionable recommendations to improve the security posture. Use transparent boxes of a new color to indicate where recommendations should be applied.
Pictures are great, but sometimes you need more detail
While the visual overlays are instrumental in depicting various aspects of the environment, the addition of a narrative document significantly enhances the value of the OATMEAL framework.
The narrative document provides detailed explanations and context that complement the visual overlays. It helps stakeholders understand the rationale behind each layer, the significance of identified gaps, and the implications of potential attack scenarios. This deeper understanding is crucial for informed decision-making.
Detailed explanations: Each control, detection, gap, and recommendation depicted in the overlays is explained in detail, providing clarity on their purpose and importance.
- Contextual information: The narrative includes background information and context that may not be immediately apparent from the visual overlays alone.
- Facilitates communication: The narrative document serves as a communication tool that bridges the gap between technical and nontechnical stakeholders. It translates complex security concepts into understandable language, making it easier for all parties to engage in meaningful discussions.
- Accessible language: The narrative uses clear and concise language to explain technical details, making it accessible to a broader audience.
- Structured format: The document follows the same order as the presentation layers, allowing readers to easily navigate to the sections they are most interested in.
Improve your security posture with OATMEAL
The OATMEAL threat modeling framework offers a structured and comprehensive approach to understanding and mitigating potential threats. By breaking down the environment into manageable layers and focusing on the most critical aspects, OATMEAL helps organizations prioritize their security efforts and improve their overall security posture. Whether you are a seasoned security professional or new to threat modeling, OATMEAL provides a clear and effective method for analyzing and addressing potential threats.
Want to learn more ways to protect against threats and secure your organization? Check out Elastic Security for threat hunting.
The release and timing of any features or functionality described in this post remain at Elastic's sole discretion. Any features or functionality not currently available may not be delivered on time or at all.
Share
- Share on Twitter
Share on Twitter
- Share on LinkedIn
Share on LinkedIn
- Share on Facebook
Share on Facebook
- Share by Email
Share by Email
- Print this page
Print