Use elastic-package to create and bootstrap a new Elastic integration


 Share on Twitter
Share on Twitter

 Share on LinkedIn
Share on LinkedIn

 Share on Facebook
Share on Facebook

 Share by Email
Share by Email

 Print this page
Print
At Elastic we use elastic-package on a daily basis to create and maintain Integrations. Today we’ll learn how to quickly bootstrap a new Elastic Integration using a built-in creator, and how to start observing the service.
Elastic Integrations are a new way of using Elastic Agents to observe logs and metrics. By using Internet of Things smart devices, you can track data like electricity consumption, gas, or water usage in your household. However, there are countless IoT devices out there, and they all have proprietary apps or web pages to monitor data. What if you want to have a dashboard with all your IoT data in one place? That’s where Integrations come in.
Say you want to monitor your home’s water usage for leaks. An Elastic Integration makes this easy. Your IoT device has a REST endpoint with a data feed. By using an Elastic integration to create a smart pipeline to Kibana Alerts, you’ve got your service. Repeat as needed and you’ve got a dashboard to monitor your home. Further, with a small investment you can build IoT detectors on your own using any prototyping platform (for example Arduino) and basic electronic components (like water sensors).
These Integrations don’t contain any Go code — all functionality is provided using YAML or JSON configuration. If writing configuration files sounds like an exhausting challenge, that’s where the built-in creator comes in, shortening the initial time for bootstrapping the package using an embedded package archetype.
If you have never heard of Elastic Agent or Elastic Integrations and want to learn more before jumping in, this blog post is a great place to start. Otherwise, let's dive in!
Review observed service
The candidate for implementing a new package will be the IPFS Node application, a client to the decentralized peer-to-peer (P2P) network for storing and sharing data in a distributed file system. It uses content-addressing to uniquely identify each file. The application can run in both, daemon and console modes, and it exposes few network ports:
- 4001 - default libp2p swarm port
- 5001 - API internal port, shouldn’t be exposed publicly
- 8080 - Gateway to serve content
The node application is also distributed as Docker image, which can be easily started:
$ docker run --rm --name ipfs-node -p 127.0.0.1:5001:5001 ipfs/go-ipfs@sha256:f7e30972e35a839ea8ce00c060412face29aa31624fd2dc87a5e696f99835a91

Changing user to ipfs
ipfs version 0.9.1
generating ED25519 keypair...done
peer identity: 12D3KooWR6NcsnsW7bzaMnfYWL9D8f411P351TnfTX2D9pxRY74t
initializing IPFS node at /data/ipfs
to get started, enter:

	ipfs cat /ipfs/QmQPeNsJPyVWPFDVHb77w8G42Fvo15z4bG2X8D2GhfbSXc/readme

Initializing daemon...
go-ipfs version: 0.9.1-dc2715a
Repo version: 11
System version: amd64/linux
Golang version: go1.15.2
2021/09/27 13:01:00 failed to sufficiently increase receive buffer size (was: 208 kiB, wanted: 2048 kiB, got: 416 kiB). See https://github.com/lucas-clemente/quic-go/wiki/UDP-Receive-Buffer-Size for details.
Swarm listening on /ip4/127.0.0.1/tcp/4001
Swarm listening on /ip4/127.0.0.1/udp/4001/quic
Swarm listening on /ip4/172.17.0.2/tcp/4001
Swarm listening on /ip4/172.17.0.2/udp/4001/quic
Swarm listening on /p2p-circuit
Swarm announcing /ip4/127.0.0.1/tcp/4001
Swarm announcing /ip4/127.0.0.1/udp/4001/quic
Swarm announcing /ip4/172.17.0.2/tcp/4001
Swarm announcing /ip4/172.17.0.2/udp/4001/quic
API server listening on /ip4/0.0.0.0/tcp/5001
WebUI: http://0.0.0.0:5001/webui
Gateway (readonly) server listening on /ip4/0.0.0.0/tcp/8080
Daemon is readyIn this tutorial we will be interested in the API running on port 5001, which exposes following methods:
/api/v0/stats/bw - get IPFS bandwidth information/api/v0/repo/stat - get statistics for currently used repository
Both API methods respond to POST calls:
$ curl -X POST http://127.0.0.1:5001/api/v0/stats/bw
{"TotalIn":18136337,"TotalOut":944694,"RateIn":34125.006805975005,"RateOut":4088.311294056906}

$ curl -X POST http://127.0.0.1:5001/api/v0/repo/stat
{"RepoSize":9321761,"StorageMax":10000000000,"NumObjects":95,"RepoPath":"/data/ipfs","Version":"fs-repo@11"}The goal of this exercise is to create an integration which scraps metrics from the described API and collects standard application logs from the ipfs-node.
Bootstrap new "ipfs_node" package
Let's start with creating a new repository (or you can select your own place) to store the integration. Next, use the built-in creator and your new package:
$ elastic-package create package
Create a new package
? Package name: ipfs_node
? Version: 0.0.1
? Package title: IPFS Node
? Description: Collect logs and metrics from IPFS node.
? Categories: custom, network
? Release: experimental
? Kibana version constraint: ^7.15.0
? Github owner: mtojek
New package has been created: ipfs_node
DoneThe package has been created, but we also need three additional data streams - traffic (metrics), repository (metrics) and application (logs):
$ cd ipfs_node
$ elastic-package create data-stream
Create a new data stream
? Data stream name: traffic
? Data stream title: Traffic
? Type: metrics
New data stream has been created: traffic
Done
$ elastic-package create data-stream
Create a new data stream
? Data stream name: repository
? Data stream title: Repository
? Type: metrics
New data stream has been created: repository
Done
$ elastic-package create data-stream
Create a new data stream
? Data stream name: application
? Data stream title: Application logs
? Type: logs
New data stream has been created: application
Done$ tree
.
├── changelog.yml
├── data_stream
│ ├── application
│ │ ├── agent
│ │ │ └── stream
│ │ │ └── stream.yml.hbs
│ │ ├── elasticsearch
│ │ │ └── ingest_pipeline
│ │ │ └── default.yml
│ │ ├── fields
│ │ │ └── base-fields.yml
│ │ └── manifest.yml
│ ├── repository
│ │ ├── agent
│ │ │ └── stream
│ │ │ └── stream.yml.hbs
│ │ ├── fields
│ │ │ └── base-fields.yml
│ │ └── manifest.yml
│ └── traffic
│ ├── agent
│ │ └── stream
│ │ └── stream.yml.hbs
│ ├── fields
│ │ └── base-fields.yml
│ └── manifest.yml
├── docs
│ └── README.md
├── img
│ ├── sample-logo.svg
│ └── sample-screenshot.png
└── manifest.yml
17 directories, 15 filesThe package root contains 3 different data streams (traffic, repository and application), a basic README file, a changelog file, and sample graphics (icon and screenshot). Every data stream contains a manifest, an agent's stream definition, field definitions and an optional stub for ingest pipeline.
Adjust configuration of data streams
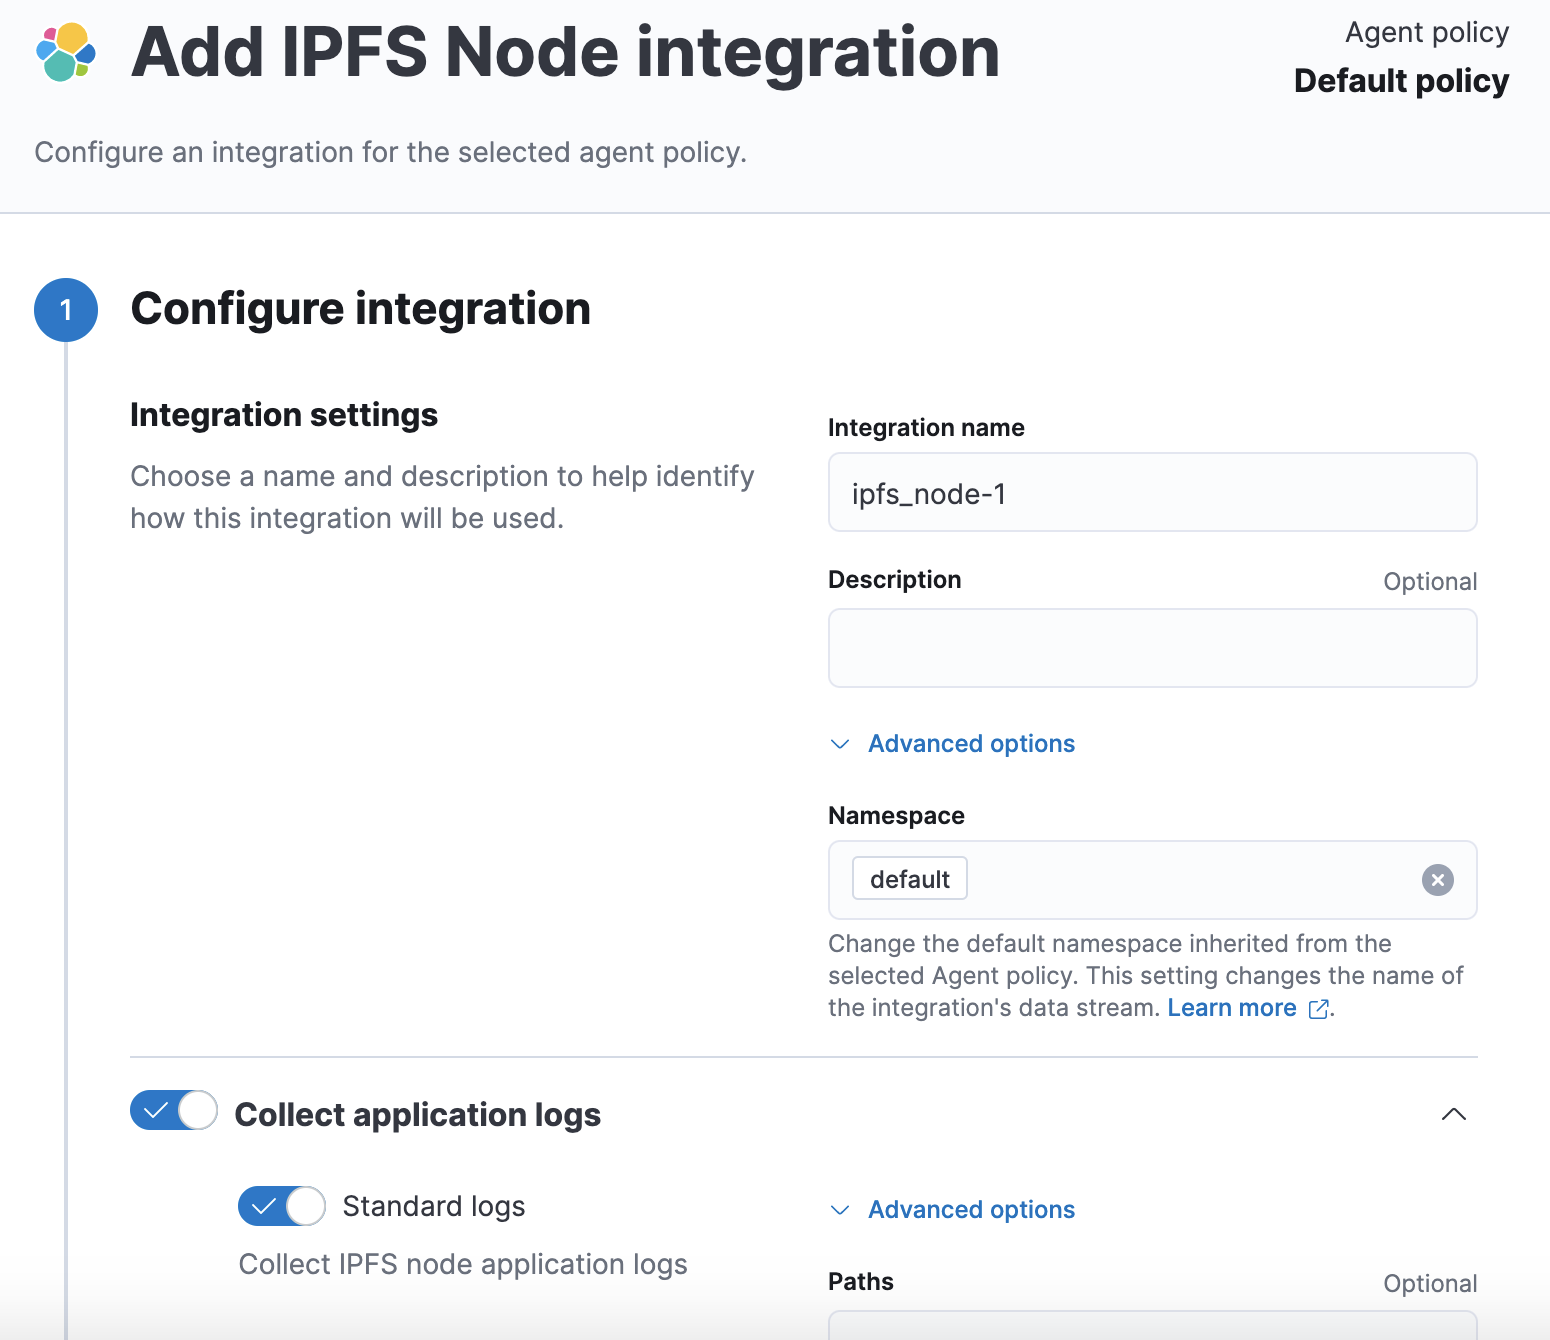
Now it's time to fill all the templates. Let's modify the package manifest (manifest.yml) and replace default policy templates with following:
policy_templates:
 - name: application
   title: IPFS node logs and metrics
   description: Collect IPFS node logs and metrics
   inputs:
     - type: logfile
       title: Collect application logs
       description: Collecting application logs from IPFS node
     - type: http/metrics
       title: Collect application metrics
       description: Collecting repository and traffic metrics from IPFS node
       vars:
         - name: hosts
           type: text
           title: Hosts
           description: Base URL of the internal endpoint
           required: true
default: http://localhost:5001The package manifest describes two kinds of inputs - logfile and http/metrics. The logfile input is a standard filebeat's input, which allows for reading entries from files, but HTTP metrics is a Beats module, which fetches data from external HTTP endpoints (it supports JSON format). In the package manifest there can be defined common variables, which apply to multiple data streams - in this case we can keep the base URL to the IPFS node.
Let's define data streams:
- application - read standard application logs
- repository - read IPFS repository statistics
- traffic - read bandwidth metrics for the node
Here is the data stream manifest for "application" data stream:
title: "Application logs"
type: logs
streams:
 - input: logfile
   title: Standard logs
   description: Collect IPFS node application logs
   vars:
     - name: paths
       type: text
       title: Paths
       multi: true
       default:
         - /var/log/ipfs-node-*.log
- /var/log/ipfs-debug-*.logIt's relatively small and defines one variable - paths (location of log files). For the purpose of this exercise we will not introduce more variables and only focus on the basic lifecycle of an integration. Once you modified the "application" data stream manifest, adjust manifests for "repository" and "traffic".
"Repository" data stream manifest:
title: "Repository"
type: metrics
streams:
 - input: http/metrics
   title: Repository metrics
   description: Collect repository metrics from IPFS node
   vars:
     - name: period
       type: text
       title: Period
default: 10s"Traffic" data stream manifest:
title: "Traffic"
type: metrics
streams:
 - input: http/metrics
   title: Traffic metrics
   description: Collect bandwidth metrics from IPFS node
   vars:
     - name: period
       type: text
       title: Period
       default: 10s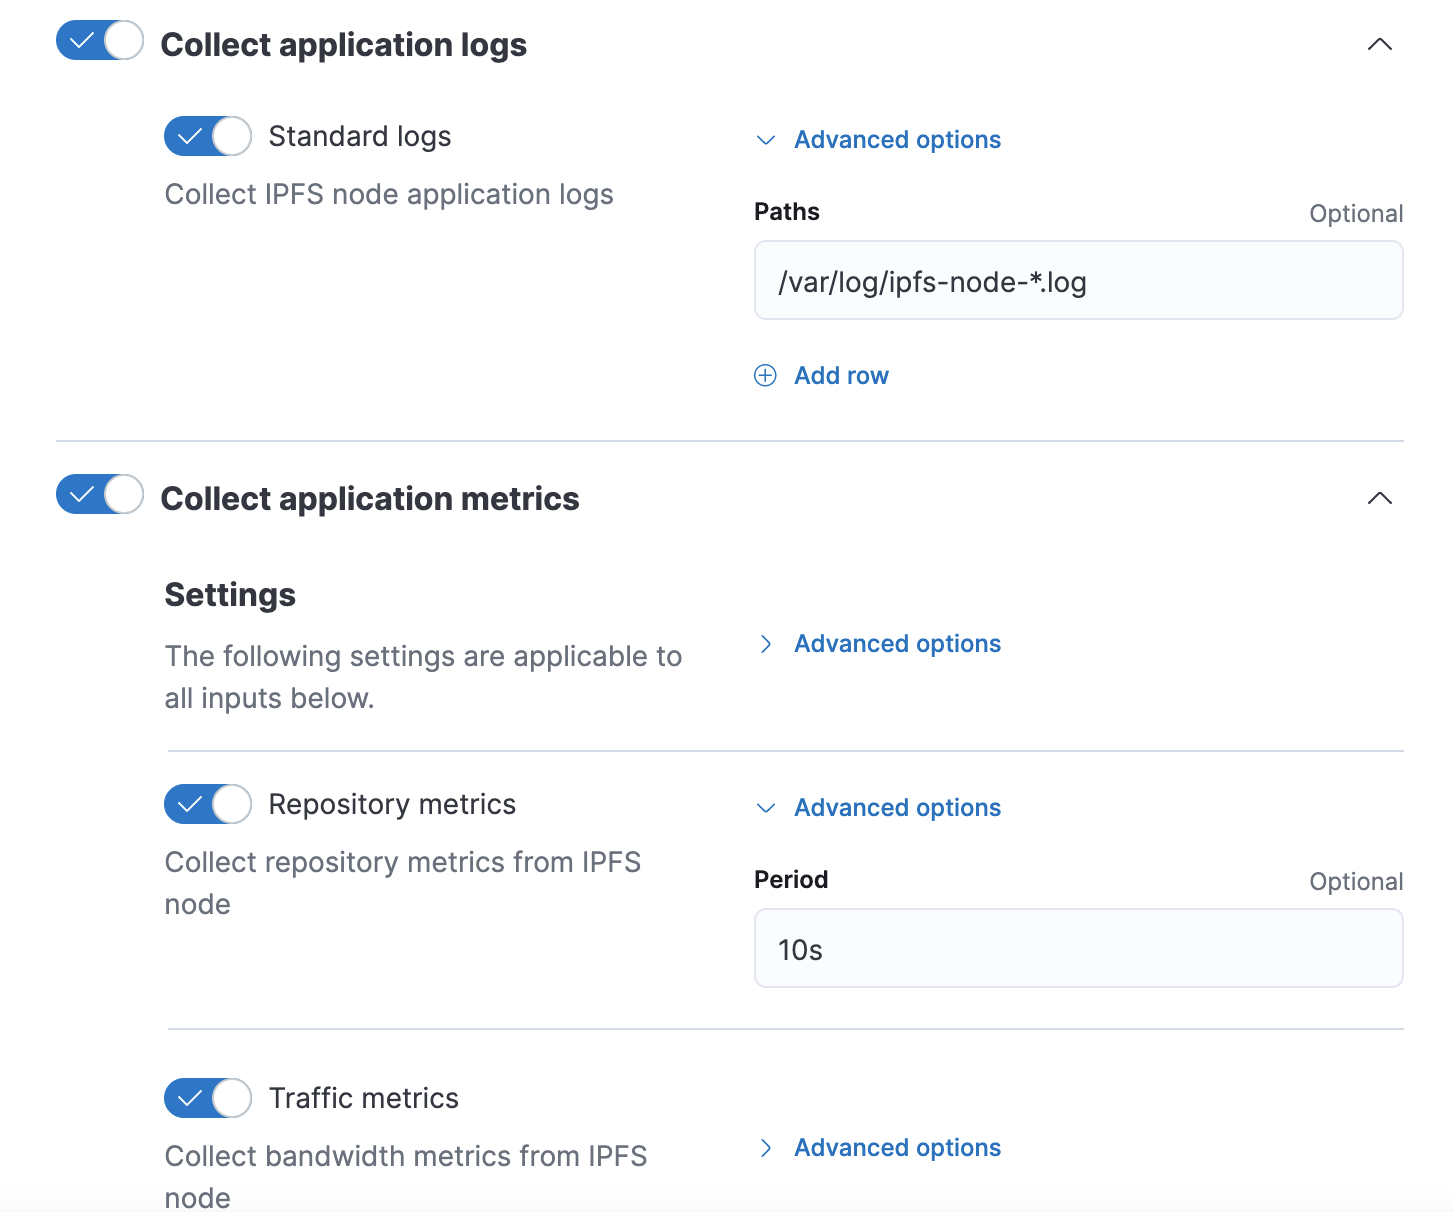
filebeat and metricbeat processes. The agent stream for the "application" uses the standard file input:paths:
{{#each paths as |path i|}}
- {{path}}
{{/each}}
exclude_files: [".gz$"]
processors:
- add_locale: ~
The agent stream for the “repository” uses the HTTP module with enabled JSON metricset:
metricsets: ["json"]
hosts:
{{#each hosts}}
- {{this}}/api/v0/repo/stat
{{/each}}
period: {{period}}
method: "POST"
namespace: "repository"metricsets: ["json"]
hosts:
{{#each hosts}}
- {{this}}/api/v0/stats/bw
{{/each}}
period: {{period}}
method: "POST"
namespace: "traffic"The "application" data stream pushes logs to an ingest pipeline which runs in Elasticsearch. It can transform logs in multiple ways - skip fields, add new fields, trim content, replace values conditionally, etc. For the purpose of this exercise we will not introduce a complex processing:
data_stream/application/elasticsearch/ingest_pipeline/default.yml
---
description: Pipeline for processing sample logs
processors:
 - set:
     field: ecs.version
     value: '1.11.0'
 - trim:
     field: message
 - drop:
     description: 'Drop if the log message is empty'
     if: ctx.message == ''
on_failure:
 - set:
     field: error.message
value: '{{ _ingest.on_failure_message }}'The core package files are ready now, so it's a good moment to run few extra commands:
elastic-package format - to format the package source codeelastic-package lint - to double-check if all files are inline with package-spec
elastic-package build - to build the integration package (mind that this will create the build directory with a built package)
Once every command passed successfully we can switch to testing. The elastic-package tool can boot up locally the Elastic stack for development and testing purposes. The stack consists of Docker containers for Elasticsearch, Kibana, Fleet Server and Elastic Agent. As all contantainers run in the same network, it's a good idea to run the IPFS node in a container belonging to the same Docker network.
Create _dev/deploy/docker directory in the package root and add place following files:
docker-compose.yml
version: '2.3'
services:
 ipfs_node:
   build: .
   ports:
     - 5001
   volumes:
- ${SERVICE_LOGS_DIR}:/var/log/ipfs#!/bin/sh
/usr/local/bin/start_ipfs daemon --migrate=true | tee /var/log/ipfs/ipfs-node-0.logDockerfile
FROM ipfs/go-ipfs@sha256:f7e30972e35a839ea8ce00c060412face29aa31624fd2dc87a5e696f99835a91

RUN mkdir -p /var/log/ipfs

ADD docker-entrypoint.sh /

ENV IPFS_LOGGING "info"

ENTRYPOINT ["/docker-entrypoint.sh"]We will use them in system tests to boot up an instance of an IPFS node in the Docker network and make it observable by Elastic Agent. Now it’s the time to boot the Elastic stack. Navigate to the package root and run the command:
elastic-package stack up -dCustom build packages directory found: /Users/marcin.tojek/go/src/github.com/mtojek/elastic-blog-posts/build/integrations
Packages from the following directories will be loaded into the package-registry:
- built-in packages (package-storage:snapshot Docker image)
- /Users/marcin.tojek/go/src/github.com/mtojek/elastic-blog-posts/build/integrations[
{
"name": "ipfs_node",
"title": "IPFS Node",
"version": "0.0.1",
"release": "experimental",
"description": "Collect logs and metrics from IPFS node.",
"type": "integration",
"download": "/epr/ipfs_node/ipfs_node-0.0.1.zip",
"path": "/package/ipfs_node/0.0.1",
"icons": [
{
"src": "/img/sample-logo.svg",
"path": "/package/ipfs_node/0.0.1/img/sample-logo.svg",
"title": "Sample logo",
"size": "32x32",
"type": "image/svg+xml"
}
],
"policy_templates": [
{
"name": "application",
"title": "IPFS node logs and metrics",
"description": "Collect IPFS node logs and metrics"
}
]
}
]
Let's prepare a few system tests to verify the package life. A system test consists of multiple steps (automatically executed by the test runner):
- Create a new policy defining the Integration.
- Assign the policy to the agent.
- Wait until the agent pushes events to Elasticsearch.
- Verify if events are correct.
Create one system test definition for "application" data stream in data_stream/application/_dev/test/system/test-default-config.yml:
vars: ~
data_stream:
 vars:
   paths:
- "{{SERVICE_LOGS_DIR}}/ipfs-node-*"This system test definition defines the value for "paths" to observe. The SERVICE_LOGS_DIR env is a directory mounted in the Elastic Agent (source: service container with IPFS node).
Create two system test definitions for "repository" data stream in data_stream/repository/_dev/test/system/test-default-config.yml and data_stream/traffic/_dev/test/system/test-default-config.yml (same content):
vars:
 hosts:
   - http://{{Hostname}}:{{Port}}
data_stream:
vars: ~Let's run all system tests and check results:
elastic-package test system -vIt will take some time to run all tests, but the tool reports progress and current activity. After a few minutes it will end up with … a failure similar to this:
2021/09/28 16:57:28 DEBUG deleting data in data stream...
--- Test results for package: ipfs_node - START ---
FAILURE DETAILS:
ipfs_node/traffic default:
[0] field "ecs.version" is undefined
[1] field "http.traffic.RateIn" is undefined
[2] field "http.traffic.RateOut" is undefined
[3] field "http.traffic.TotalIn" is undefined
[4] field "http.traffic.TotalOut" is undefined
[5] field "service.address" is undefined
[6] field "service.type" is undefinedWe haven't added any field definition in data streams, so let's start with enabling the dependency manager to pull in ECS fields. Create the _dev/build/build.yml file in the package root:
dependencies:
 ecs:
reference: git@1.11Populate fields directories with following files:
data_stream/application/fields/ecs.yml
- external: ecs
  name: ecs.version
- external: ecs
  name: log.file.path
- external: ecs
name: messagedata_stream/application/fields/fields.yml
- name: input.type
  type: keyword
  description: Input type
- name: log.offset
  type: long
description: Logfile offsetdata_stream/repository/fields/ecs.yml
- external: ecs
  name: ecs.version
- external: ecs
  name: service.type
- external: ecs
name: error.messagedata_stream/repository/fields/fields.yml
- name: http.repository.NumObjects
  type: long
  description: Number of objects in the repository
- name: http.repository.RepoPath
  type: keyword
  description: Path to the repository
- name: http.repository.RepoSize
  type: long
  description: Size of the repository
- name: http.repository.StorageMax
  type: long
  description: Max size of the storage
- name: http.repository.Version
  type: keyword
  description: Storage version
- name: service.address
  type: keyword
description: Service addressdata_stream/traffic/fields/ecs.yml
- external: ecs
  name: ecs.version
- external: ecs
  name: service.type
- external: ecs
name: error.messagedata_stream/traffic/fields/fields.yml
- name: http.traffic.RateIn
  type: scaled_float
  description: In network rate
- name: http.traffic.RateOut
  type: scaled_float
  description: On network rate
- name: http.traffic.TotalIn
  type: long
  description: Total in traffic
- name: http.traffic.TotalOut
  type: long
  description: Total out traffic
- name: service.address
  type: keyword
description: Service addressOnce all fields files are ready, let's rerun system tests, but this time enable --generate flag:
elastic-package test system -v --generateWhen system tests pass, the system test runner will store sample events from data streams containing real Elasticsearch documents. For example:
data_stream/traffic/sample_event.json
{
    ...
    },
    "http": {
        "traffic": {
            "RateIn": 6143.101688596616,
            "RateOut": 2978.29294020491,
            "TotalIn": 160014,
            "TotalOut": 55738
        }
    },
    "metricset": {
        "name": "json",
        "period": 10000
    },
    "service": {
        "address": "http://elastic-package-service_ipfs_node_1:5001/api/v0/stats/bw",
        "type": "http"
    }
}As we proved that our integration collects data and even stored a few sample events, it’s recommended to present them in the README. The elastic-package provides basic rendering options to render the table with fields and sample events. Let’s create a README template (_dev/build/docs/README.md) in the package root:
# IPFS Node

This is a new integration created using the [elastic-package](https://github.com/elastic/elastic-package) tool.

## Application logs

{{event "application"}}

{{fields "application"}}

## Repository metrics

{{event "repository"}}

{{fields "repository"}}

## Traffic metrics

{{event "traffic"}}

{{fields "traffic"}}Rebuild the package with elastic-packagedocs/README.md.
Congratulations, you have just built your first integration.
Troubleshooting the integration
It may happen that complex ingest configuration will require a few minutes of debugging. The elastic-package exposes a dedicated feature to dump all logs from the Elastic stack. With the stack up and running, run the following command:
elastic-package stack dumpThe tool will pull logs from Docker containers including internal files and place together in the directory:
$ tree elastic-stack-dump
elastic-stack-dump
└── logs
    ├── elastic-agent-internal
    │   ├── filebeat-json.log
    │   ├── filebeat-json.log-2021-09-28-15-16
    │   ├── filebeat-json.log-2021-09-28-15-17
    │   ├── metricbeat-json.log
    │   ├── metricbeat-json.log-2021-09-28-15-20
    │   └── metricbeat-json.log-2021-09-28-15-21
    ├── elastic-agent.log
    ├── elasticsearch.log
    ├── fleet-server-internal
    │   ├── fleet-server-json.log
    │   ├── fleet-server-json.log-2021-09-28-14-1
    │   └── fleet-server-json.log-2021-09-28-14-2
    ├── fleet-server.log
    ├── kibana.log
    └── package-registry.log

3 directories, 26 filesLook around for possible errors, configuration issues or stack problems. If you notice that the Elastic Agent doesn't process any logs, it's worth looking into filebeat and metricbeat logs.
Browse metrics in Elasticsearch
There is an option to check documents processed by the Agent running during system tests. Restart system tests with an extra flag to defer cleanup by 5 minutes:
elastic-package test system --data-streams repository --defer-cleanup 5m -v
Observe the output of elastic-package until you notice the "waiting" confirmation:
2021/09/28 18:19:07 DEBUG Policy revision assigned to the agent (ID: cae28981-0d96-434d-aa3f-55a63e37f6f9)...
2021/09/28 18:19:07 DEBUG checking for expected data in data stream...
2021/09/28 18:19:07 DEBUG found 0 hits in metrics-ipfs_node.repository-ep data stream
2021/09/28 18:19:08 DEBUG found 0 hits in metrics-ipfs_node.repository-ep data stream
2021/09/28 18:19:09 DEBUG found 0 hits in metrics-ipfs_node.repository-ep data stream
2021/09/28 18:19:10 DEBUG found 0 hits in metrics-ipfs_node.repository-ep data stream
2021/09/28 18:19:11 DEBUG found 1 hits in metrics-ipfs_node.repository-ep data stream
2021/09/28 18:19:11 DEBUG waiting for 5m0s before tearing down...green open .tasks aB4Wp5GtRGWtMomVKVIKvQ 1 0 2 0 13.8kb 13.8kb
yellow open .ds-metrics-system.process.summary-default-2021.09.28-000001 XRf77R7XS2KKrqnffegb6w 1 1 1081 0 1.2mb 1.2mb
green open .security-7 4VEaX_a0TEuNDDRWr4W14g 1 0 117 6 292.8kb 292.8kb
yellow open .ds-metrics-ipfs_node.repository-ep-2021.09.28-000001 GlmMwE9-SAipRygU4sI88Q 1 1 8 0 237.7kb 237.7kb
yellow open .ds-logs-ipfs_node.application-ep-2021.09.28-000001 -BWSONvSQxmJZCbF1GtmnQ 1 1 0 0 67.4kb 67.4kb
yellow open .ds-metrics-elastic_agent.metricbeat-default-2021.09.28-000001 vWNedZJeQaeG35bO5UorDQ 1 1 2162 0 2mb 2mb
yellow open .ds-metrics-system.uptime-default-2021.09.28-000001 7kfIHzAqTdSLQEhPc72sMw 1 1 1081 0 1.1mb 1.1mb
green open .kibana-event-log-7.15.0-snapshot-000001 vqx_yozOSeekpJ_h2zdiCQ 1 0 2 0 11.9kb 11.9kb
green open .fleet-policies-7Let's review documents in the .ds-metrics-ipfs_node.repository-ep-2021.09.28-000001 index:
http://localhost:9200/.ds-metrics-ipfs_node.repository-ep-2021.09.28-000001/_search?pretty=true (keep in mind that the link depends on the existing data stream, which might be different in your case)
{
  "took" : 2,
  "timed_out" : false,
  "_shards" : {
    "total" : 1,
    "successful" : 1,
    "skipped" : 0,
    "failed" : 0
  },
  "hits" : {
    "total" : {
      "value" : 21,
      "relation" : "eq"
    },
    "max_score" : 1.0,
    "hits" : [
      {
        "_index" : ".ds-metrics-ipfs_node.repository-ep-2021.09.28-000001",
        "_type" : "_doc",
        "_id" : "OuA0LXwBJVkAmqat6T4O",
        "_score" : 1.0,
        "_source" : {
          "agent" : {
            "hostname" : "docker-fleet-agent",
            "name" : "docker-fleet-agent",
            "id" : "cae28981-0d96-434d-aa3f-55a63e37f6f9",
            "type" : "metricbeat",
            "ephemeral_id" : "88e873e4-9bb2-4220-bfa4-e6bfcc0e6e04",
            "version" : "7.15.0"
          },
          ...
          "http" : {
            "repository" : {
              "RepoPath" : "/data/ipfs",
              "StorageMax" : 1.0E10,
              "Version" : "fs-repo@11",
              "RepoSize" : 119295,
              "NumObjects" : 22
            }
          },
          "metricset" : {
            "period" : 10000,
            "name" : "json"
          },
          "event" : {
            "duration" : 3025800,
            "agent_id_status" : "verified",
            "ingested" : "2021-09-28T16:20:14Z",
            "module" : "http",
            "dataset" : "ipfs_node.repository"
          }
        }
      },
…
}That's all folks! You managed to create your first integration, cover it with system tests and verify integrity with a real service (not mocked files). Feel free to build more Elastic Integrations and submit them to our repository, Elastic Integrations.
The source code for this tutorial can be also found here.
Share
- Share on Twitter
Share on Twitter
- Share on LinkedIn
Share on LinkedIn
- Share on Facebook
Share on Facebook
- Share by Email
Share by Email
- Print this page
Print