Using machine learning in the Elastic Stack to analyze Meetup data
The machine learning (ML) features of the Elastic Stack are used across a variety of use cases, including the analysis and exploration of business data. The Elastic Stack uses a specific type of ML, called unsupervised learning, which detects previously unknown patterns in a data set without human assistance. Elastic ML features automate the analysis of time series data by creating accurate baselines of normal behavior in the data and identifying anomalous patterns. In this blog, we’re going to show how you can use ML in the Elastic Stack to identify anomalies in a data set tied to real-world events.
Meetup is a service that enables people to organize online groups that host in-person events based on shared interests. You can explore and interact with the Meetup platform from your own apps with simple RESTful HTTP and streaming interfaces via the Meetup API. Through the API, you can learn about groups and events organized in Meetup. Logstash also provides a Meetup input plugin, which grabs information regarding updates to particular events in Meetup. However, for the purposes of this blog, we won't use the Logstash plugin. Instead, we’ll acquire broader data using the Meetup API, ingest the data into Elasticsearch, and perform ML jobs to find interesting insights that would typically escape human observation.
In the example below, we will analyze the history of group creation in Meetup over a daily time window and divide the results by country; then, we’ll run an ML job that counts the number of groups created, and cases with high numbers will be considered anomalies. The most unusual anomaly that we find is the creation of 848 groups in one day, a rate 24 times higher than normal.
How to ingest the data
In this case, I wrote a custom Python script to make things simple. The Python script gathers information via the Meetup API and posts it to Logstash as a series of events by using the Http input plugin. Then, Logstash sends those events to Elasticsearch with some data enrichment. Please refer to my GitHub repo for more details. Of course, you can also write your own custom Logstash plugin.

Meetup group
The Meetup API provides various endpoints for various data types, such as group, event, category, and topic. Group is a fundamental entity. When someone organizes a Meetup group, a group entity is created. Each group belongs to a specific category, such as socializing, tech, culture, and so on. Each group is also related to one or more topics. Topics are smaller than categories and include open source, cloud, programming, and so on. The relationship between groups and topics can be many-to-many. When someone plans a Meetup event related to a specific group, an event entity is created. A group can also have multiple event entities. The entity model looks like this:
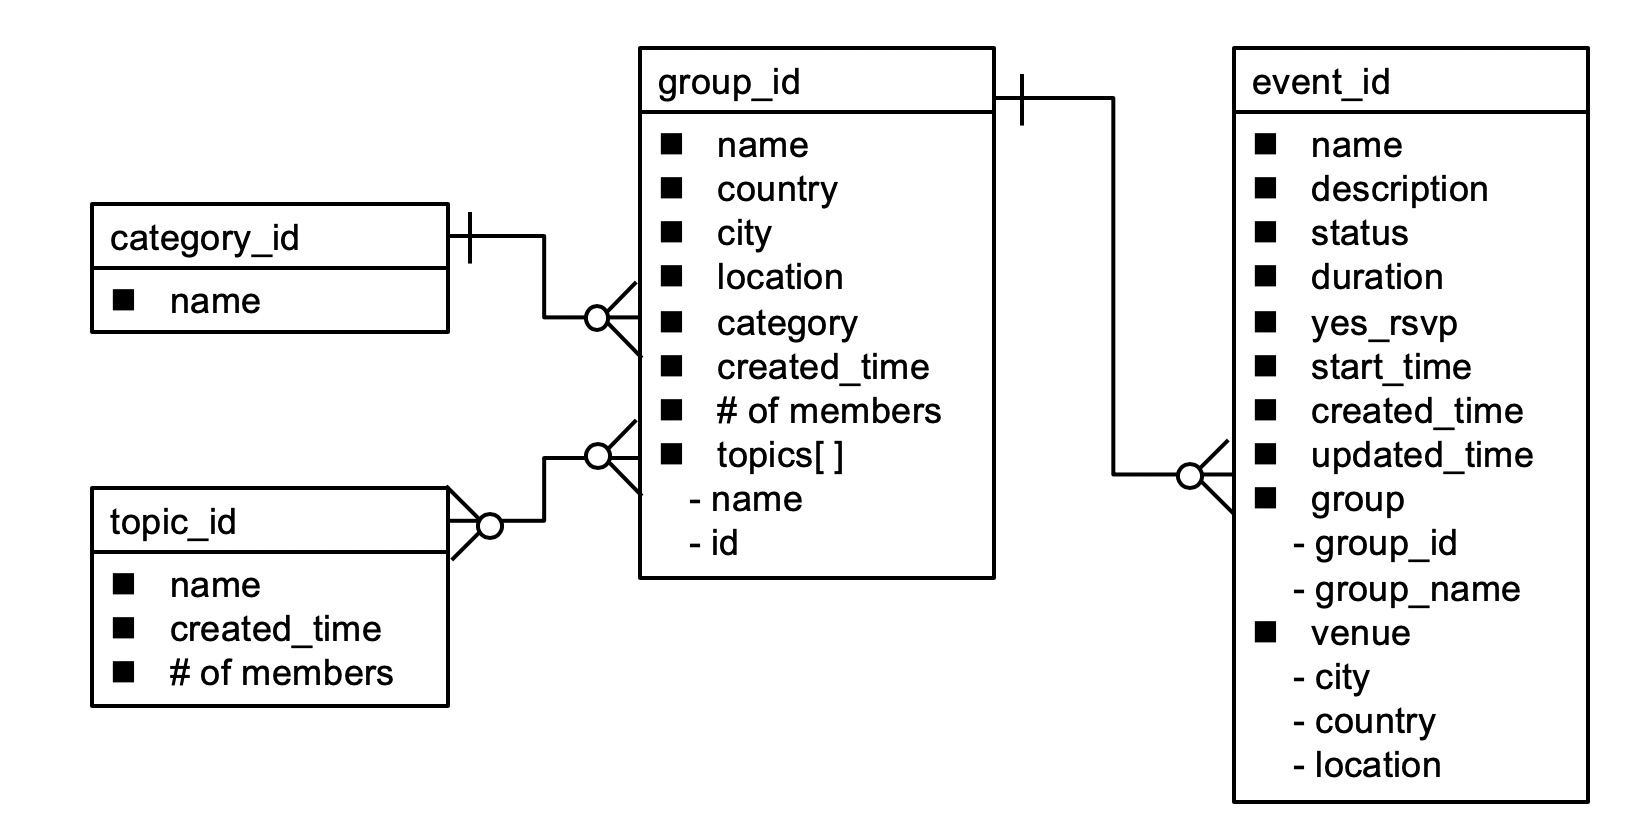
Below is a mapping for ingesting group data, the basic Meetup data set, into Elasticsearch. Here we can see the basic fields such as name, country, city, organizer, category, and so on. When using Elastic ML’s time series anomaly detection, you need to have a time field. So, we use created_time as the time field, which represents the time when a group is started.
{
  "meetup-group" : {
    "mappings" : {
      "dynamic_templates" : [
        {
          "string_fields" : {
            "match" : "*",
            "match_mapping_type" : "string",
            "mapping" : {
              "fields" : {
                "keyword" : {
                  "ignore_above" : 256,
                  "type" : "keyword"
                }
              },
              "norms" : false,
              "type" : "text"
            }
          }
        }
      ],
      "properties" : {
        "@timestamp" : {
          "type" : "date"
        },
        "@version" : {
          "type" : "keyword"
        },
        "category" : {
          "properties" : {
            "id" : {
              "type" : "long"
            },
            "name" : {
              "type" : "text",
              "norms" : false,
              "fields" : {
                "keyword" : {
                  "type" : "keyword",
                  "ignore_above" : 256
                }
              }
            },
            "shortname" : {
              "type" : "text",
              "norms" : false,
              "fields" : {
                "keyword" : {
                  "type" : "keyword",
                  "ignore_above" : 256
                }
              }
            }
          }
        },
        "city" : {
          "type" : "text",
          "norms" : false,
          "fields" : {
            "keyword" : {
              "type" : "keyword",
              "ignore_above" : 256
            }
          }
        },
        "country" : {
          "type" : "text",
          "norms" : false,
          "fields" : {
            "keyword" : {
              "type" : "keyword",
              "ignore_above" : 256
            }
          }
        },
        "created" : {
          "type" : "long"
        },
        "created_time" : {
          "type" : "date"
        },
        "data_type" : {
          "type" : "text",
          "norms" : false,
          "fields" : {
            "keyword" : {
              "type" : "keyword",
              "ignore_above" : 256
            }
          }
        },
        "description" : {
          "type" : "text",
          "norms" : false,
          "fields" : {
            "keyword" : {
              "type" : "keyword",
              "ignore_above" : 256
            }
          }
        },
        "document_id" : {
          "type" : "text",
          "norms" : false,
          "fields" : {
            "keyword" : {
              "type" : "keyword",
              "ignore_above" : 256
            }
          }
        },
        "group_photo" : {
          "properties" : {
            "base_url" : {
              "type" : "text",
              "norms" : false,
              "fields" : {
                "keyword" : {
                  "type" : "keyword",
                  "ignore_above" : 256
                }
              }
            },
            "highres_link" : {
              "type" : "text",
              "norms" : false,
              "fields" : {
                "keyword" : {
                  "type" : "keyword",
                  "ignore_above" : 256
                }
              }
            },
            "photo_id" : {
              "type" : "long"
            },
            "photo_link" : {
              "type" : "text",
              "norms" : false,
              "fields" : {
                "keyword" : {
                  "type" : "keyword",
                  "ignore_above" : 256
                }
              }
            },
            "thumb_link" : {
              "type" : "text",
              "norms" : false,
              "fields" : {
                "keyword" : {
                  "type" : "keyword",
                  "ignore_above" : 256
                }
              }
            },
            "type" : {
              "type" : "text",
              "norms" : false,
              "fields" : {
                "keyword" : {
                  "type" : "keyword",
                  "ignore_above" : 256
                }
              }
            }
          }
        },
        "id" : {
          "type" : "long"
        },
        "join_mode" : {
          "type" : "text",
          "norms" : false,
          "fields" : {
            "keyword" : {
              "type" : "keyword",
              "ignore_above" : 256
            }
          }
        },
        "lat" : {
          "type" : "float"
        },
        "link" : {
          "type" : "text",
          "norms" : false,
          "fields" : {
            "keyword" : {
              "type" : "keyword",
              "ignore_above" : 256
            }
          }
        },
        "location" : {
          "type" : "geo_point"
        },
        "lon" : {
          "type" : "float"
        },
        "members" : {
          "type" : "long"
        },
        "name" : {
          "type" : "text",
          "norms" : false,
          "fields" : {
            "keyword" : {
              "type" : "keyword",
              "ignore_above" : 256
            }
          }
        },
        "organizer" : {
          "properties" : {
            "member_id" : {
              "type" : "long"
            },
            "name" : {
              "type" : "text",
              "norms" : false,
              "fields" : {
                "keyword" : {
                  "type" : "keyword",
                  "ignore_above" : 256
                }
              }
            },
            "photo" : {
              "properties" : {
                "base_url" : {
                  "type" : "text",
                  "norms" : false,
                  "fields" : {
                    "keyword" : {
                      "type" : "keyword",
                      "ignore_above" : 256
                    }
                  }
                },
                "highres_link" : {
                  "type" : "text",
                  "norms" : false,
                  "fields" : {
                    "keyword" : {
                      "type" : "keyword",
                      "ignore_above" : 256
                    }
                  }
                },
                "photo_id" : {
                  "type" : "long"
                },
                "photo_link" : {
                  "type" : "text",
                  "norms" : false,
                  "fields" : {
                    "keyword" : {
                      "type" : "keyword",
                      "ignore_above" : 256
                    }
                  }
                },
                "thumb_link" : {
                  "type" : "text",
                  "norms" : false,
                  "fields" : {
                    "keyword" : {
                      "type" : "keyword",
                      "ignore_above" : 256
                    }
                  }
                },
                "type" : {
                  "type" : "text",
                  "norms" : false,
                  "fields" : {
                    "keyword" : {
                      "type" : "keyword",
                      "ignore_above" : 256
                    }
                  }
                }
              }
            }
          }
        },
        "rating" : {
          "type" : "float"
        },
        "timezone" : {
          "type" : "text",
          "norms" : false,
          "fields" : {
            "keyword" : {
              "type" : "keyword",
              "ignore_above" : 256
            }
          }
        },
        "topics" : {
          "properties" : {
            "id" : {
              "type" : "long"
            },
            "name" : {
              "type" : "text",
              "norms" : false,
              "fields" : {
                "keyword" : {
                  "type" : "keyword",
                  "ignore_above" : 256
                }
              }
            },
            "urlkey" : {
              "type" : "text",
              "norms" : false,
              "fields" : {
                "keyword" : {
                  "type" : "keyword",
                  "ignore_above" : 256
                }
              }
            }
          }
        },
        "urlname" : {
          "type" : "text",
          "norms" : false,
          "fields" : {
            "keyword" : {
              "type" : "keyword",
              "ignore_above" : 256
            }
          }
        },
        "utc_offset" : {
          "type" : "long"
        },
        "visibility" : {
          "type" : "text",
          "norms" : false,
          "fields" : {
            "keyword" : {
              "type" : "keyword",
              "ignore_above" : 256
            }
          }
        },
        "who" : {
          "type" : "text",
          "norms" : false,
          "fields" : {
            "keyword" : {
              "type" : "keyword",
              "ignore_above" : 256
            }
          }
        }
      }
    }
  }
}
Discovering the story behind group creation
Now, we can ingest Meetup group data into Elasticsearch. We can use machine learning to look for unusual spikes in the number of Meetup groups created.
This ML job is configured as a multi-metric job that counts the number of events in a one-day time window (bucket span) split by country, and flags an anomaly if the count is higher than expected (high_count). Elastic ML jobs can be configured with multiple detectors, each of which applies an analytical function to a specific field in your data. Although various functions can be applied to the detector, this ML job counts only the event rate. There are the three main count functions:
count: Detects anomalies when the number of events in a bucket is anomaloushigh_count: Detects anomalies when the number of events in a bucket is unusually highlow_count: Detects anomalies when the number of events in a bucket is unusually low
Since we are most interested when there is a spike in the number of groups created we will use the high_count as the function for this ML Job.
The Single Metric Viewer shows how many groups have been created (count) within a specific time window (bucket span) in the last five years. If the count is bigger than usual, it is shown as an anomaly (high_count). More groups have been created in the last five years, and this has been rising significantly in the past year.
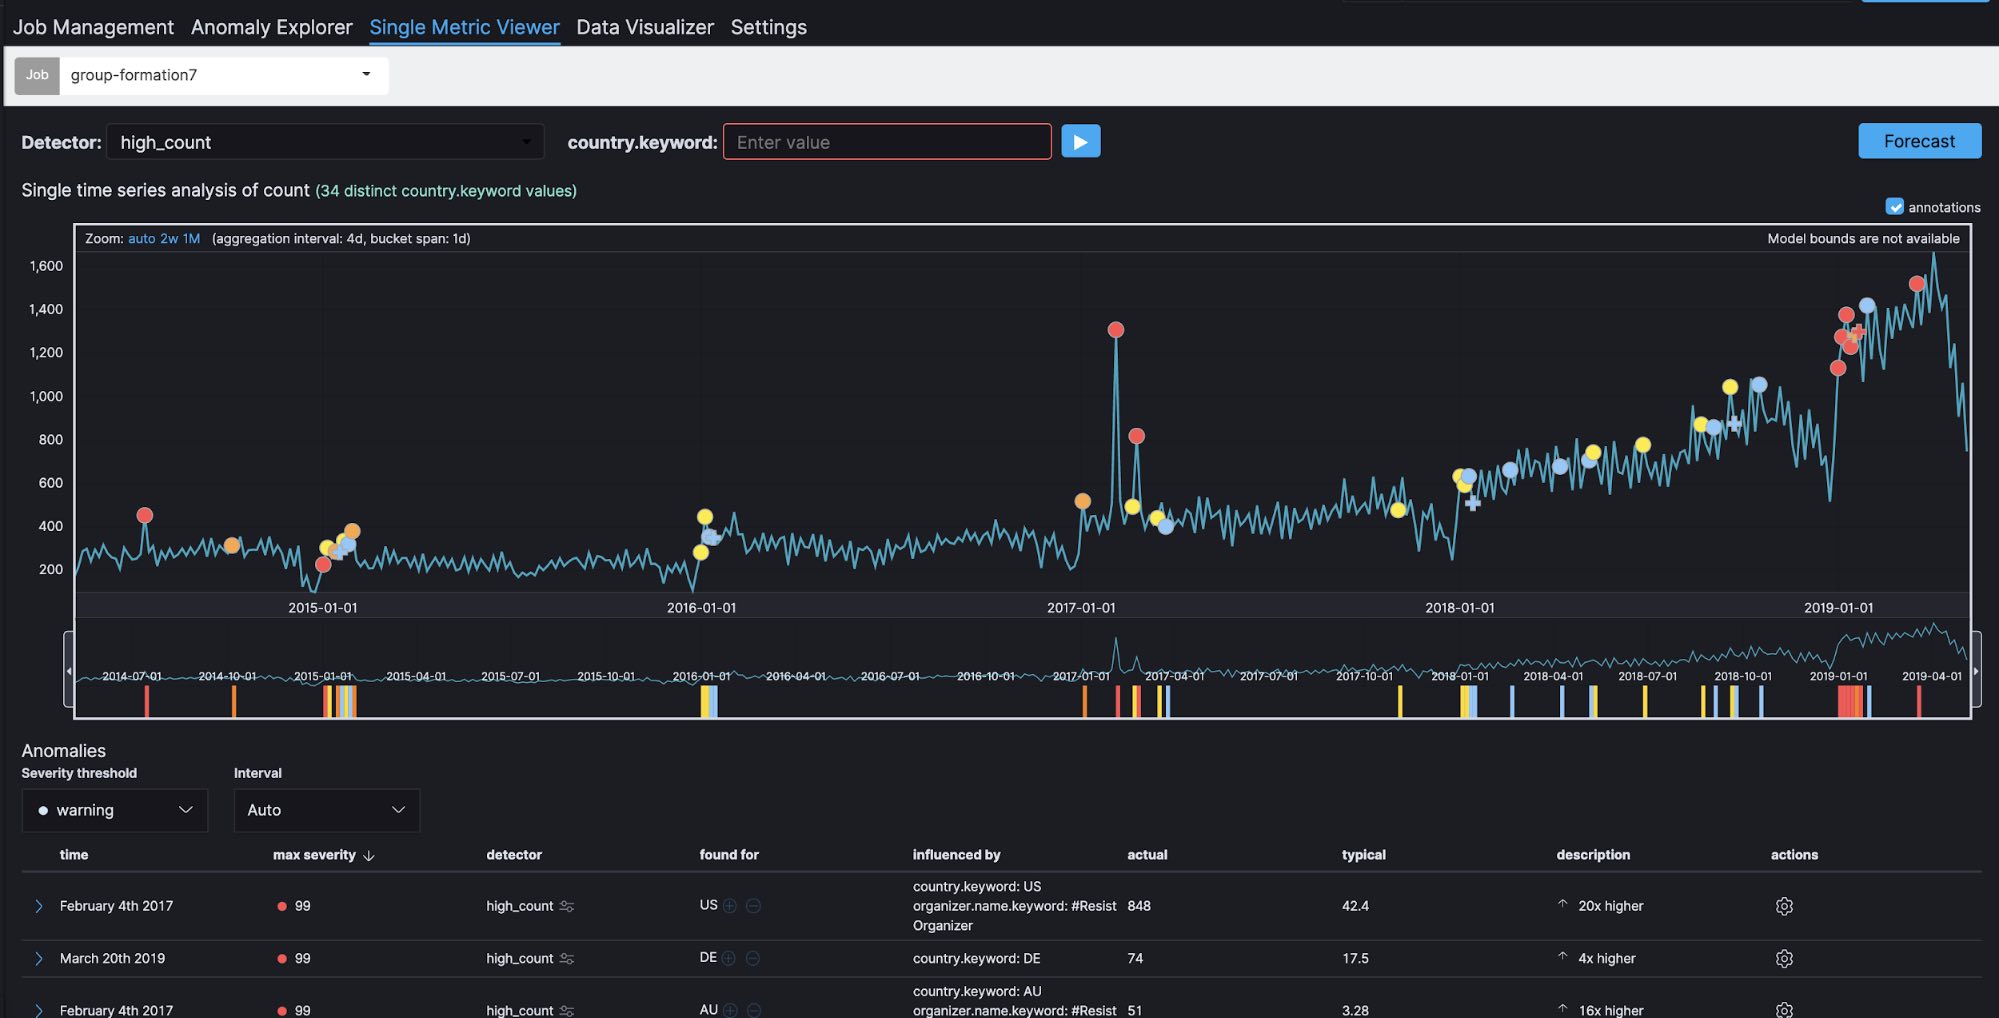
Here we can see a clear spike in early 2017. Let's go to Anomaly Explorer. Note that a colored tile in the heat map, such as red, yellow, or light blue, shows the same anomalies as the dots on the Single Metric Viewer.
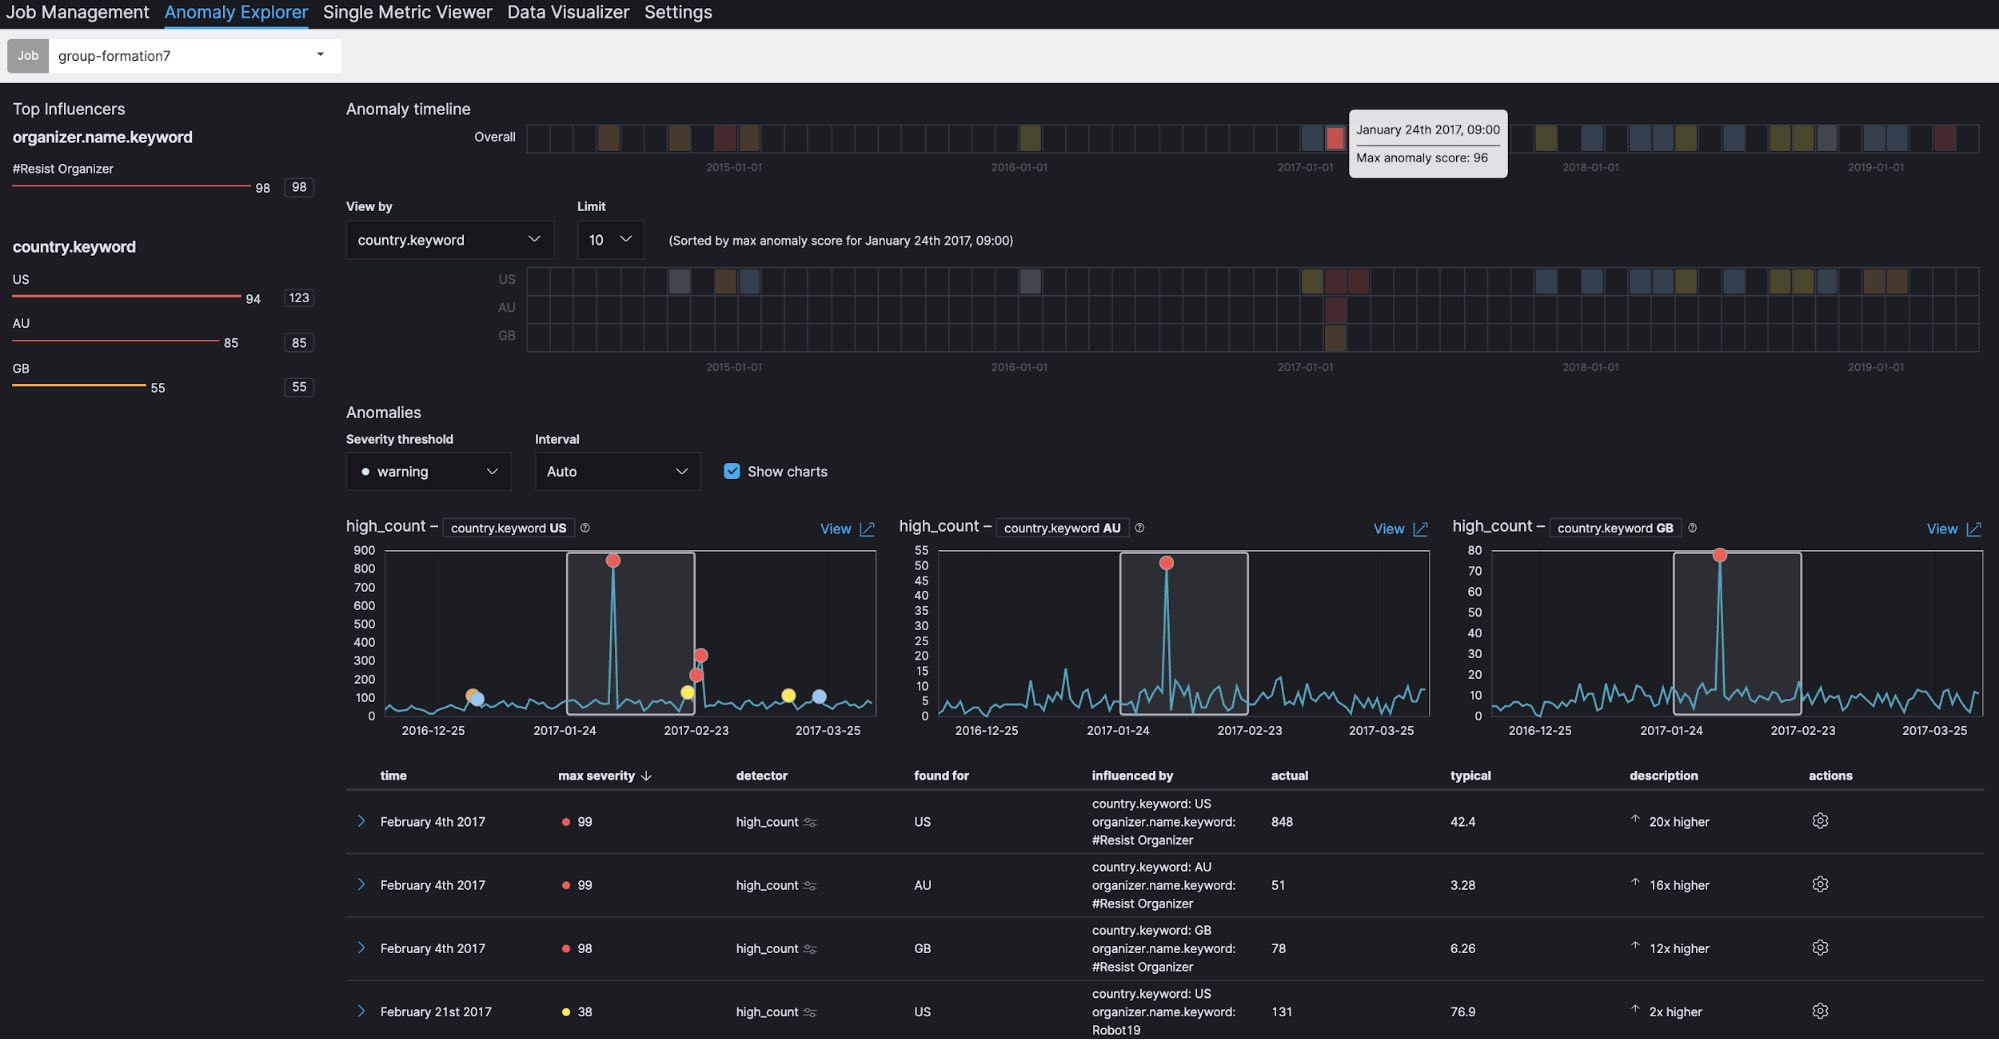
We can also see the top influencers at the upper left of the screen. One of the top influencers is country (country.keyword), which is specified as split data when the job is configured. Because usage of the Meetup platform varies from country to country, it is reasonable to analyze Meetup registrations by country. In addition, group organizer (organizer.name.keyword) is shown as another influencer. This is specified as a key field (influencer) in the job configuration, in which you can specify fields that have some impact on the detection of anomalies. In this case, group organizer is selected to find out whether this field has an impact or not.
If you click on January 24, 2017 in the Overall section under Anomaly timeline, you can see a maximum anomaly score of 96. This is the aggregated score for that time window. In the heatmaps for individual countries, we can also see that similar spikes occur simultaneously in the US, Australia and the UK. A total of 848 groups, which is more than 24 times higher than usual, are registered in the US. Similarly, 51 groups, more than 16 times higher than usual, are registered in Australia. And 78 groups, more than 12 times higher than usual, are registered in the UK.
In addition, it is interesting to note that, if you look at the top influencers at the upper left, the group organizer #Resist Organizer shows a score of 98. This implies that #Resist Organizer has a large impact on the spikes we’re seeing in group registrations. So, let's take a look at the actual data.
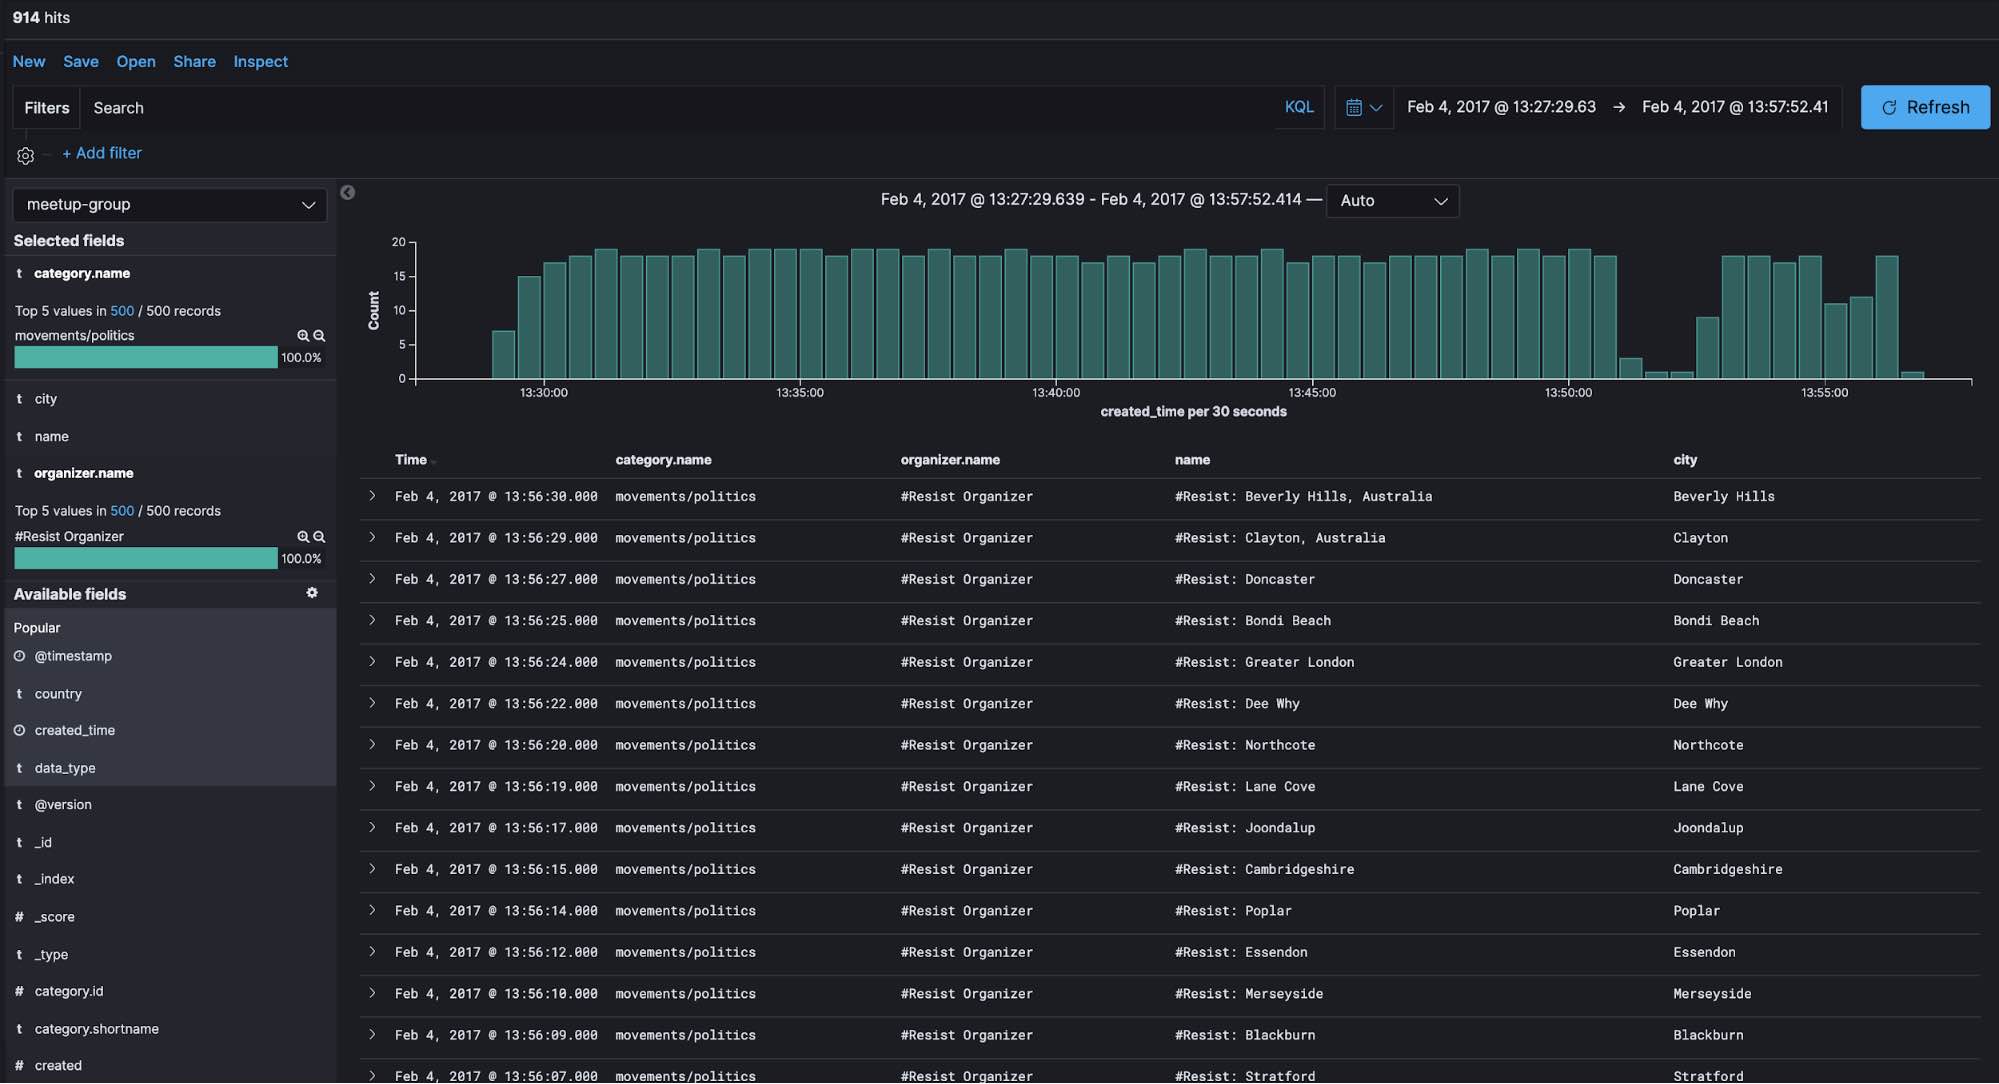
In Discovery in Kibana, we can see that 914 groups were registered over a time span of about 30 minutes on February 4, 2017, all of which had a category of movements/politics and were organized by #Resist Organizer.
We can see that these groups are somehow related to democracy, human rights, and social justice. Did some event happen around February 4, 2017 that triggered the creation of these groups?
When searching for events around this time period, we come across a February 16 TechCrunch article about how Meetup seeded their site with 1,000 #Resist meetup groups, which appears to align with our detected anomaly.
Tips for building better ML jobs
Here are a few pointers for adjusting time window granularity and removing excess noise.
Proper time window
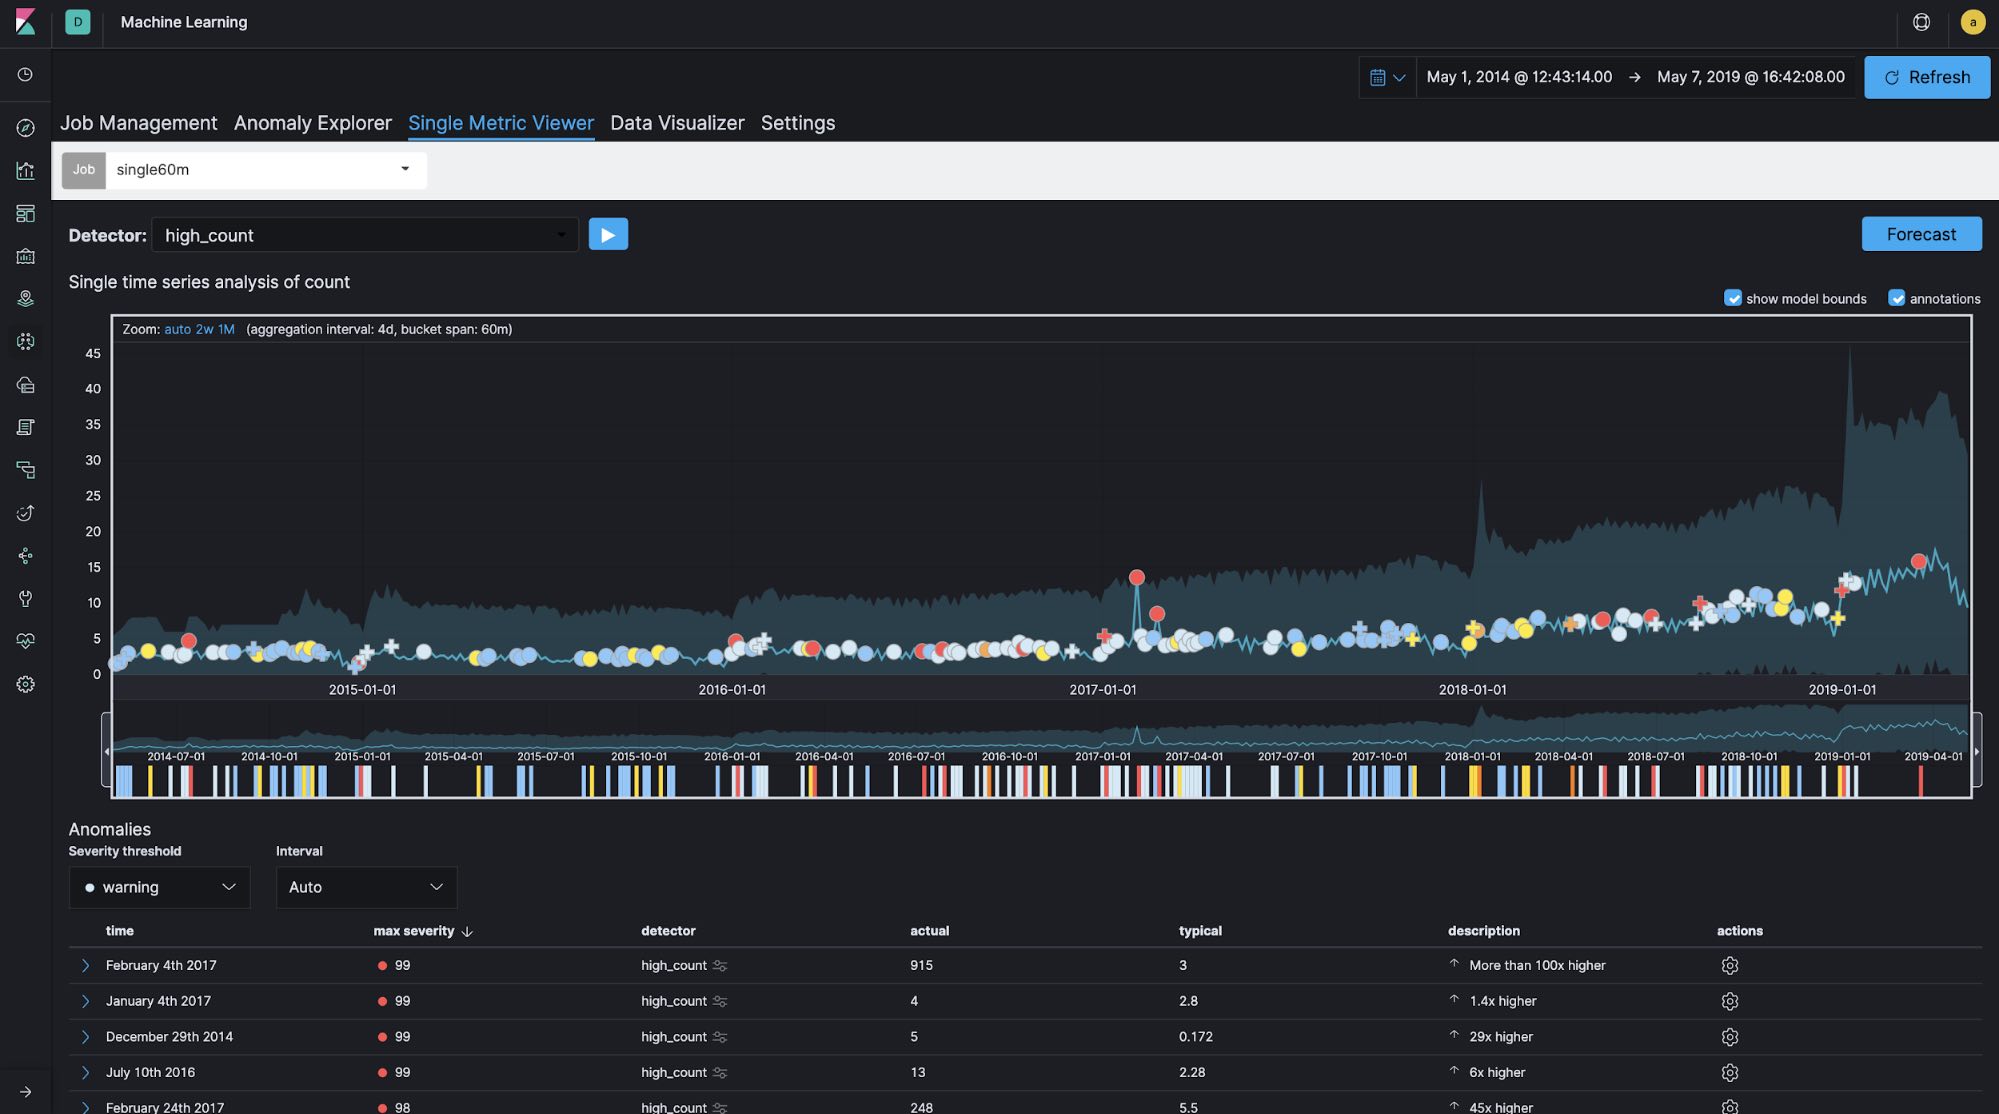
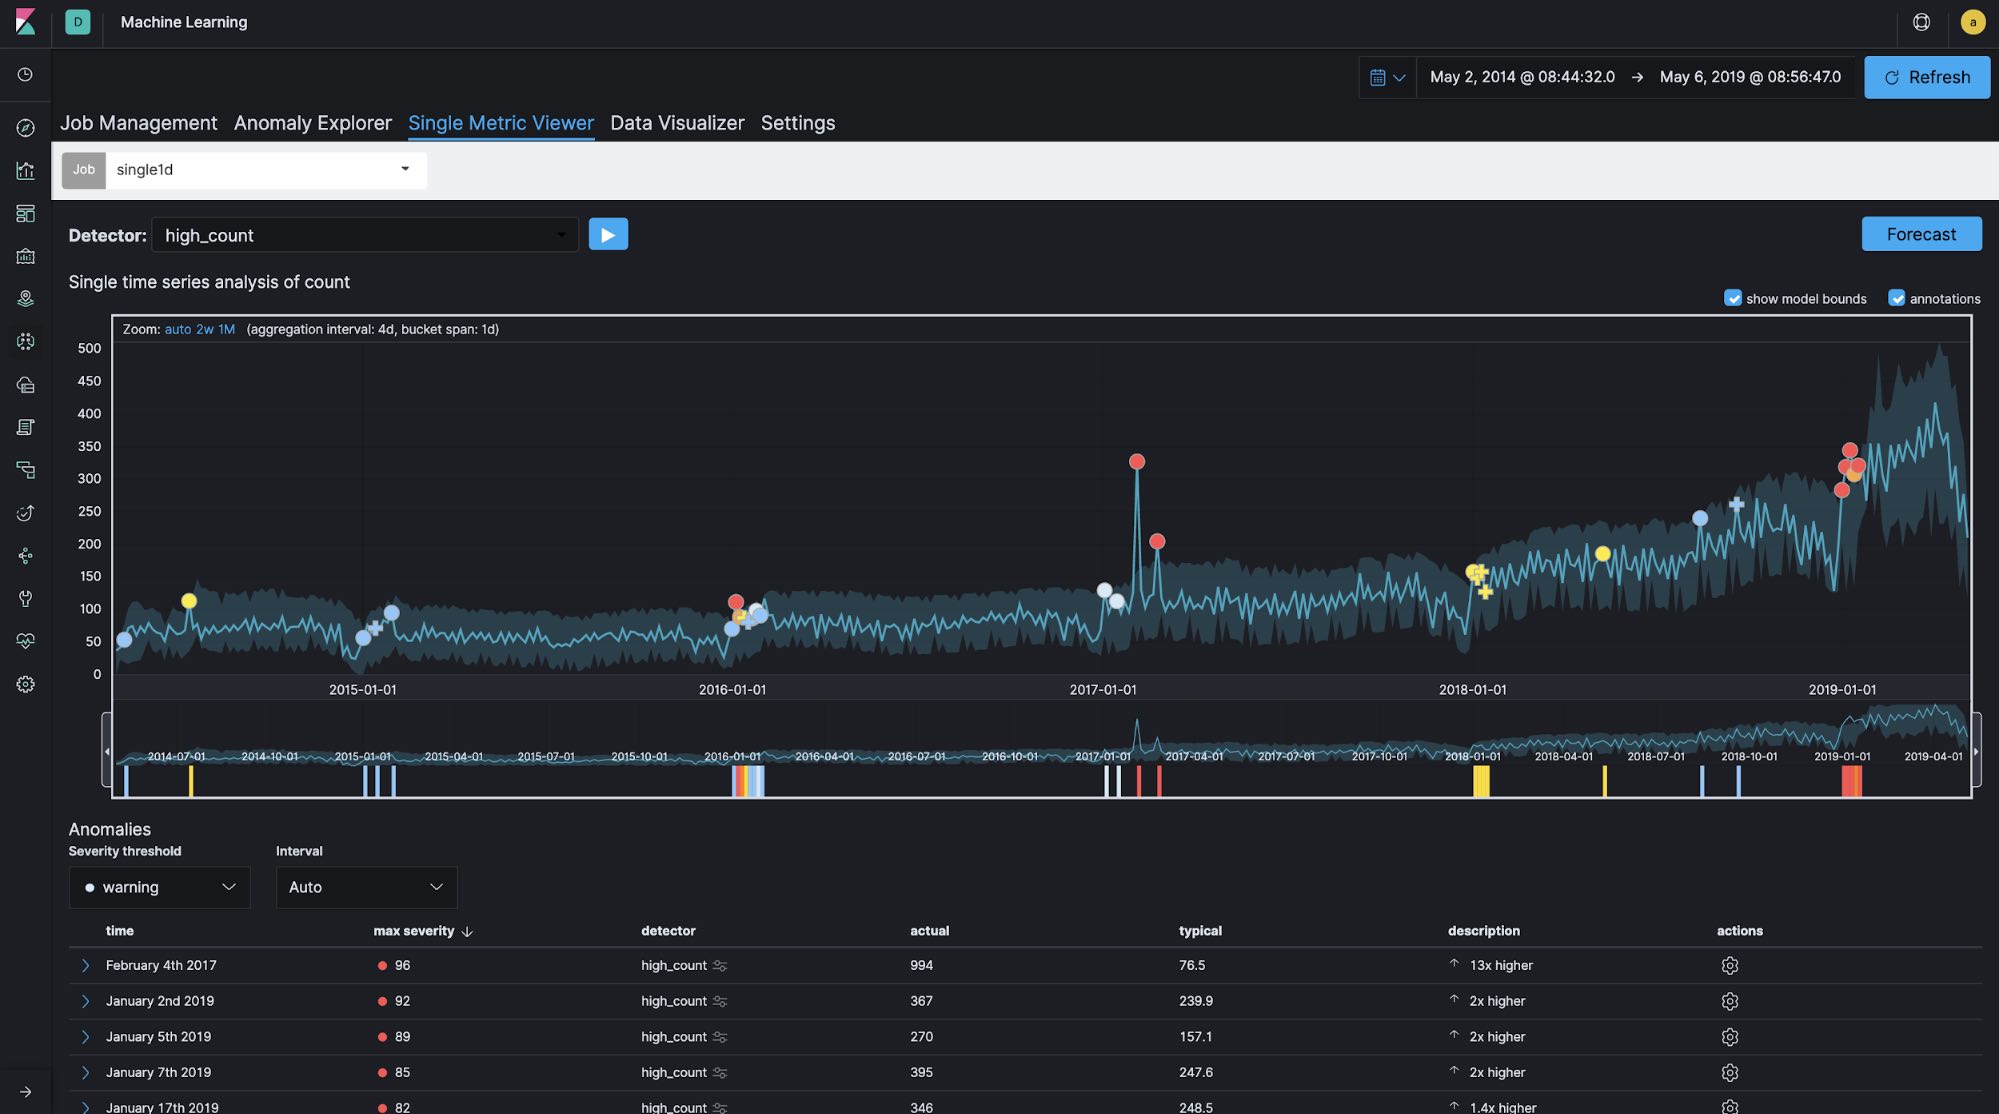
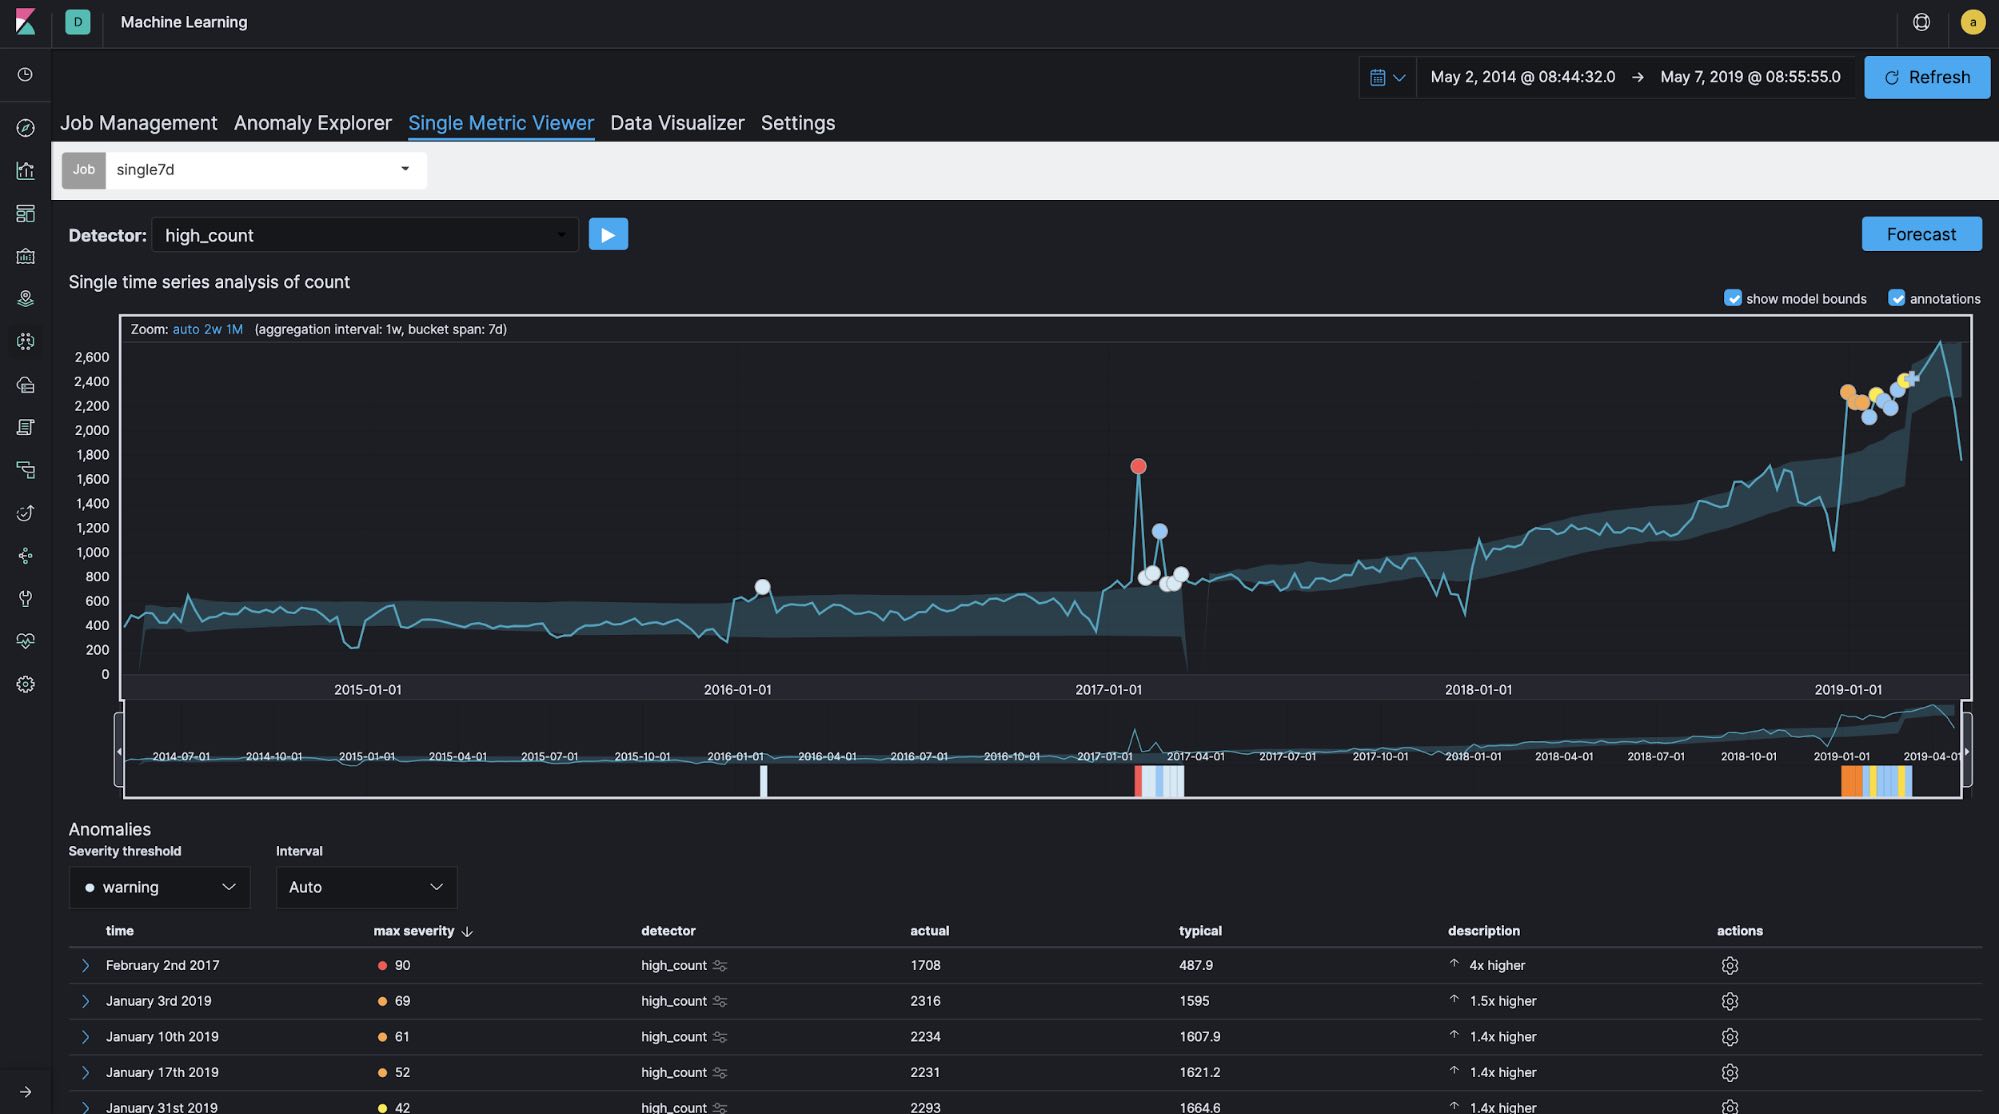
In general, bucket span (time window) is normally configured as minutes or hours at longest for logging and security analytics use cases. For example, for log analytics use cases, it is quite common to monitor the number of access attempts to a website every 10 minutes or so in order to detect abnormal increases or decreases in activity. However, if the time window you’re focusing on is relatively long, as in this Meetup case — in other words, if you’re not concerned with what time of day yields the most group registrations but rather which day of the year has the most registrations — configuring the bucket span to be longer is a good idea. Let's run single-metric jobs with 60-minute, 1-day, and 7-day bucket spans using the same data set in order to see how bucket span affects the results.
 Bucket span: 60 minutes
 Bucket span: 1 day
 Bucket span: 7 days
You can see the differences in the created models and anomaly detections between the different bucket span lengths. It looks like the 60-minute bucket span is too granular and the 7-day bucket span is not granular enough. In this case, the bucket span is configured as 1d.
Tackling noise
One of the common challenges when analyzing data using ML is excessive noise. Looking at the entire data set, it looks like hundreds of groups are registered per day, but 70% of those groups are based in the US. When looking at the groups by country, only dozens of groups are registered per day in the UK and Australia, for example. If the group registrations in these countries suddenly increased, even by a small amount, this would be detected as an anomaly right away. In order to avoid this situation, we can configure custom rules.
"analysis_config": {
    "bucket_span": "1d",
    "detectors": [
      {
        "detector_description": "high_count",
        "function": "high_count",
        "partition_field_name": "country.keyword",
        "custom_rules": [
          {
            "actions": [
              "skip_result"
            ],
            "conditions": [
              {
                "applies_to": "actual",
                "operator": "lte",
                "value": 50
              }
            ]
          }
        ],
        "detector_index": 0
      }
    ],
    ...
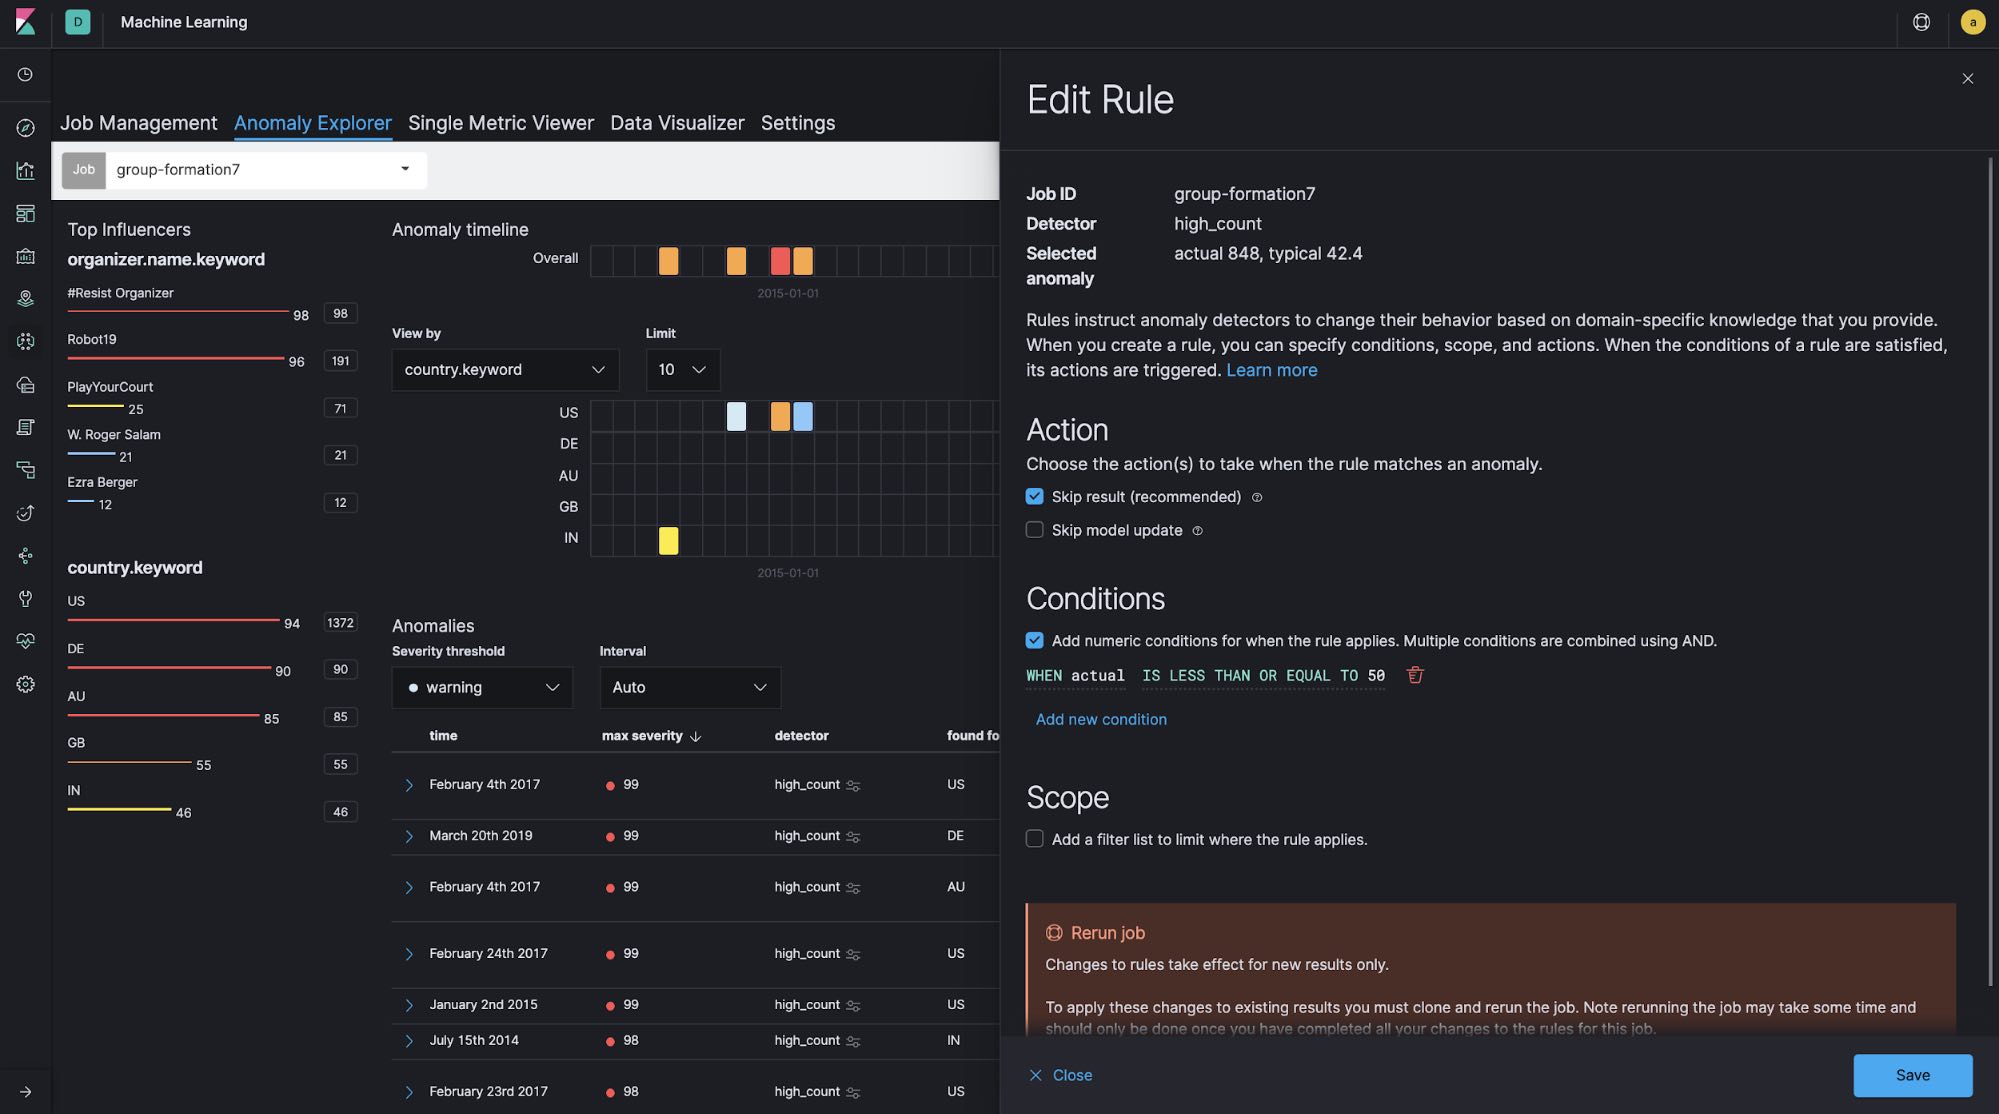
In this example, conditions are configured in custom_rules, which skips detections in the case where actual is less than or equal to 50.
We can also configure custom_rules interactively through the GUI as follows. Once the ML job generates results, we can then inspect the anomalies via Anomaly Explorer and custom_rules can be added or edited if any of the anomalies are deemed not useful.
Summary
As you can see, the Elastic Stack is built on top of a powerful search engine (Elasticsearch), which can uncover all sorts of interesting findings when used to its full potential. Along with built-in anomaly detection, we were able to demonstrate how easy it is to uncover unusual data elements in large data sets. You don't have to be a data scientist and you don't have to choose algorithms or understand the math behind them — you can just get valuable insight from understanding the data and trying different settings and job configurations. We encourage you to apply ML to the various data you’re working with. You might be able to make some new discoveries.
Would you like to try it out? Get a free 14-day trial of the Elasticsearch Service, or you can download it as part of the default distribution.