Easily visualizing MITRE ATT&CK® round 2 evaluation results in Kibana
If you want to skip ahead to see the MITRE ATT&CK eval round 2 results visualized in an easy-to-configure Kibana dashboard, check it out here.
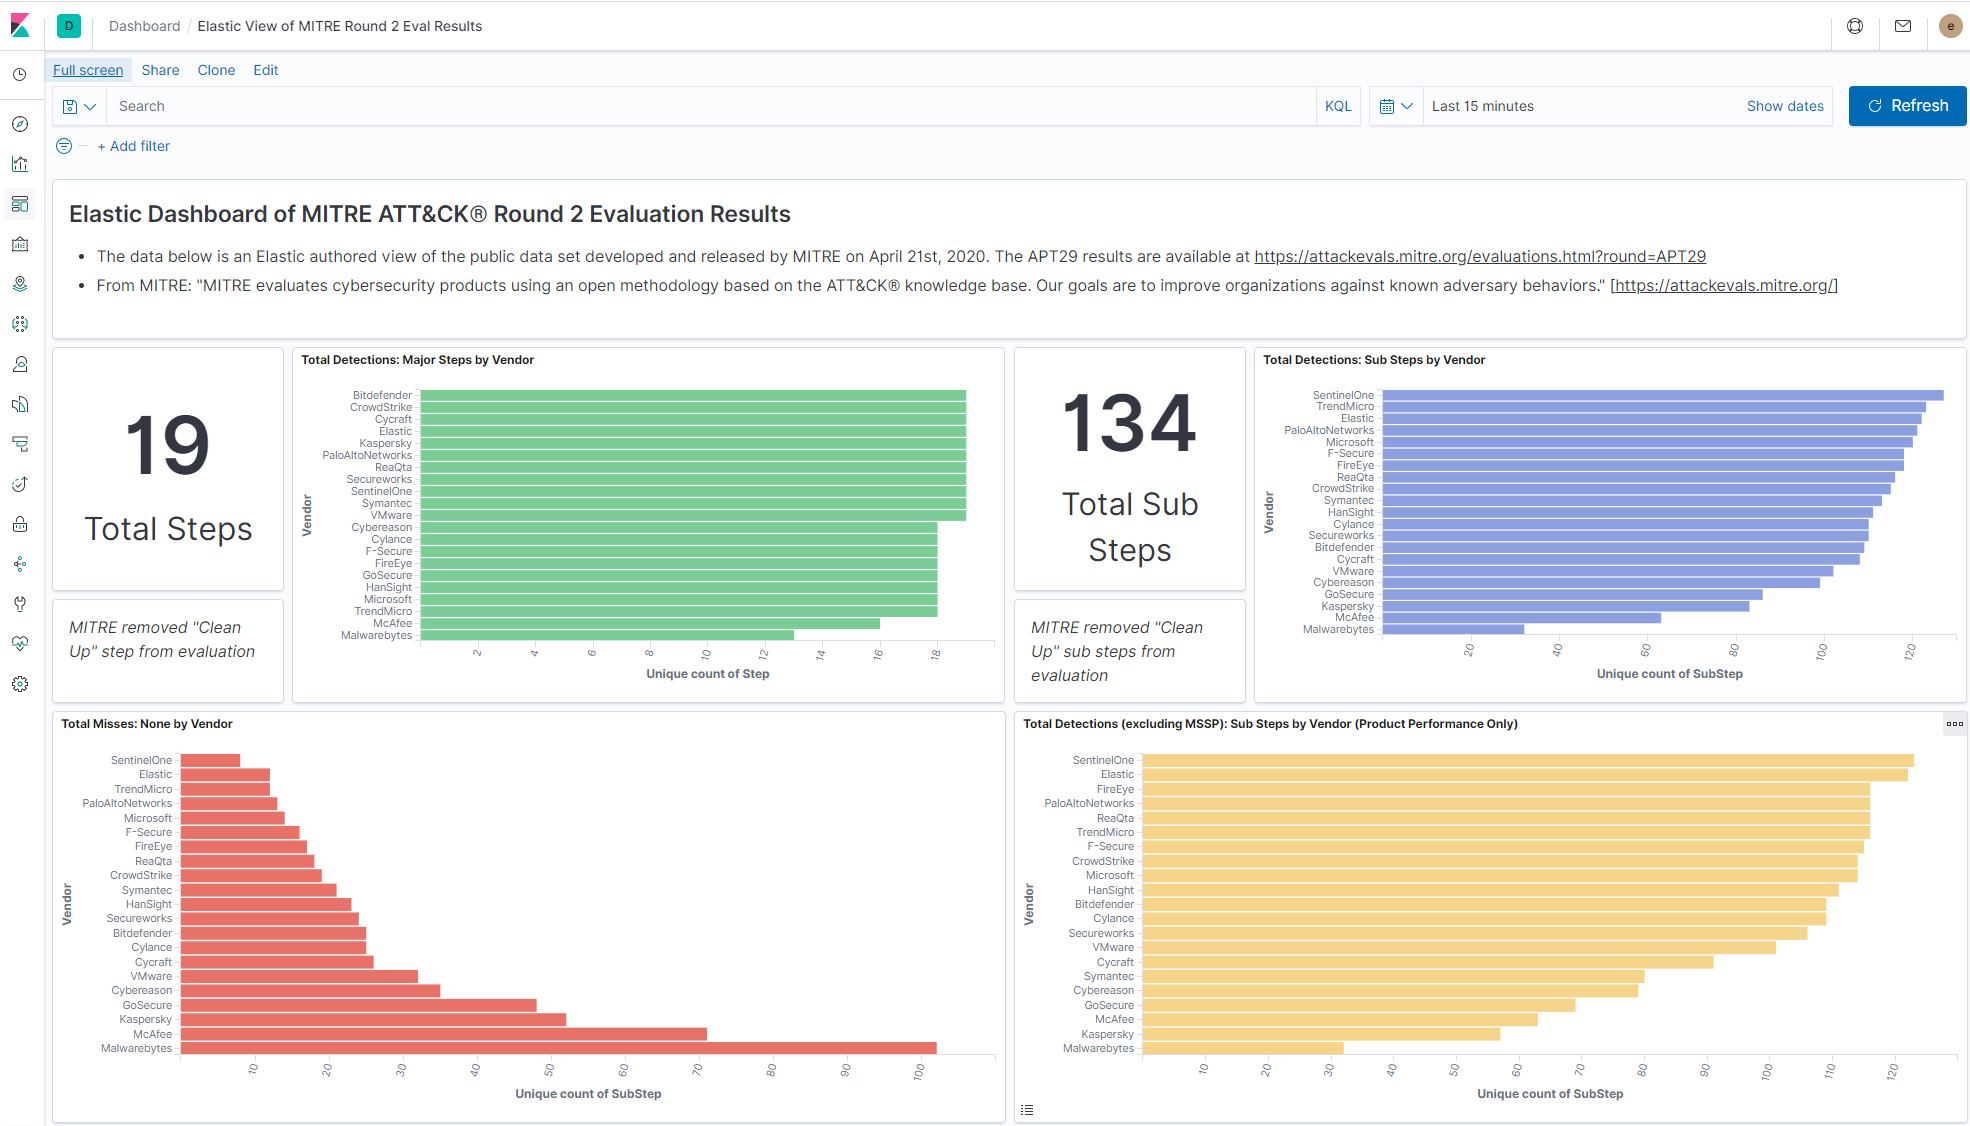
Background on MITRE ATT&CK® evaluations
Recently, The MITRE Corporation completed an evaluation of 21 different security products. For those of you who aren’t familiar with MITRE or their testing methodology, they are a US-based, federally funded research and development center (FFRDC). This evaluation helps security teams analyze results from ATT&CK evaluations in a way that is centered around their own needs.
In a nutshell, the evaluation works like this: MITRE red teamers come prepared with a fully orchestrated attack against multiple systems as they execute tradecraft spanning the entire MITRE ATT&CK™ framework (Round 2 was based on APT29). Vendors, meanwhile, act as the blue team. The red team announces the upcoming emulation, and then after execution, the focus turns to the vendors’ detection capabilities.
What makes the ATT&CK evaluation unique is that the red team only detonates malicious payloads or other pieces of malware to enable the rest of their toolkit. So unlike other assessments, your evaluation does not end when you detect malware, exploits, etc. — but rather, it’s just the beginning.
How to interpret the results yourself
MITRE does an excellent job of testing across tactics and techniques of a simulated APT and presenting the raw data for analysis. They do not score the data or provide any vendor rankings, but many organizations are accustomed to looking for a place to start analyzing the data in a way that can help inform their own evaluation process. MITRE provides a way to look at the results via their Data Analysis Tool, but we thought, what if we imported all the results into Elasticsearch and visualized them in Kibana?
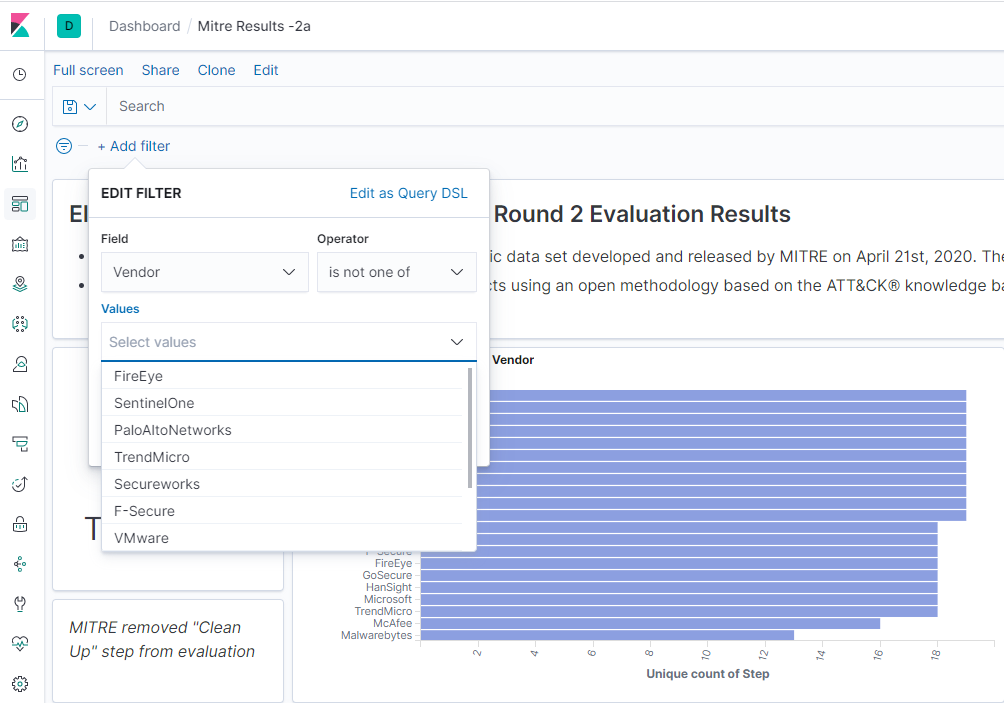
Users can easily filter the results for vendors of their choice by clicking “+ Add Filter,” selecting “Vendor” for Field, selecting “is one of” for Operator, then adding the vendors you want to compare in Values. Please remember, these are case sensitive, so you need to enter “Elastic,” for example.
At Elastic, we are firm believers in openness and transparency, and providing users access to raw data. We decided to first transform the data into atomic events by simply creating a “detection event” for each vendor-observed detection. Then, to further help anyone interpret the ATT&CK evaluation results, we imported the data into Kibana and made it publicly available on our demo site here.
An explanation of the visuals
It’s incredibly easy to filter the data and interpret the results using Kibana. Let’s walk through some of these visualizations (maybe you’ll be inspired to make some visualizations of your own). Any filter applied will change the visuals across the entire dashboard. How cool is that!?
Total detections: Major steps by vendor
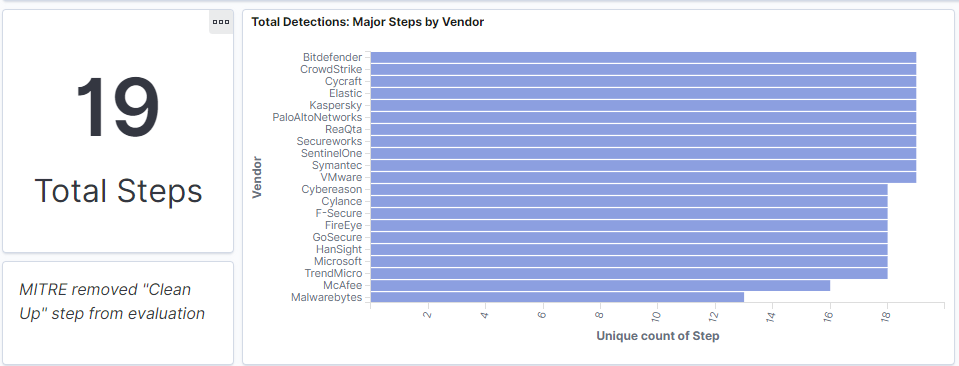
In this Round 2 evaluation, MITRE outlined 20 major steps to qualify how all the vendors detected different procedures during an attack (e.g., Initial Breach, Rapid Collection and Exfiltration). In total, 20 steps were defined across two attack scenarios. Additional details regarding each step can be found in MITRE’s operation flow definition.
This visualization shows which vendors detected at least one sub-step. For example: Elastic, Bitdefender, Crowdstrike, Cycraft, among other vendors detected at least one part of all 19 steps. Note that MITRE eliminated one of the steps (#19) from the evaluation.
Total detections: Sub-steps by vendor and the Opposite (misses by vendor)
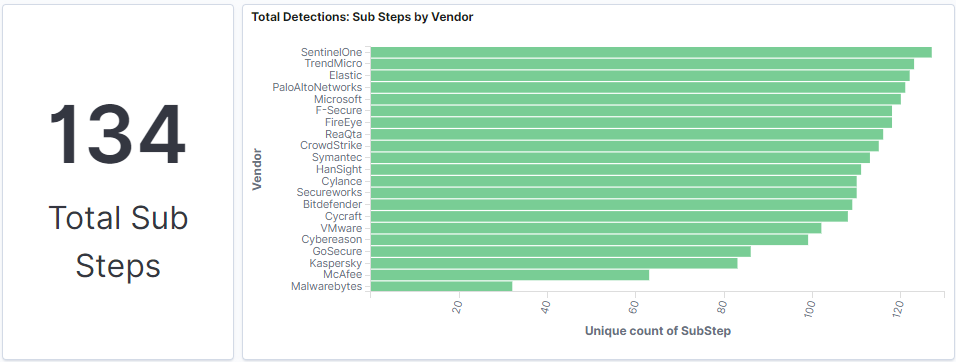
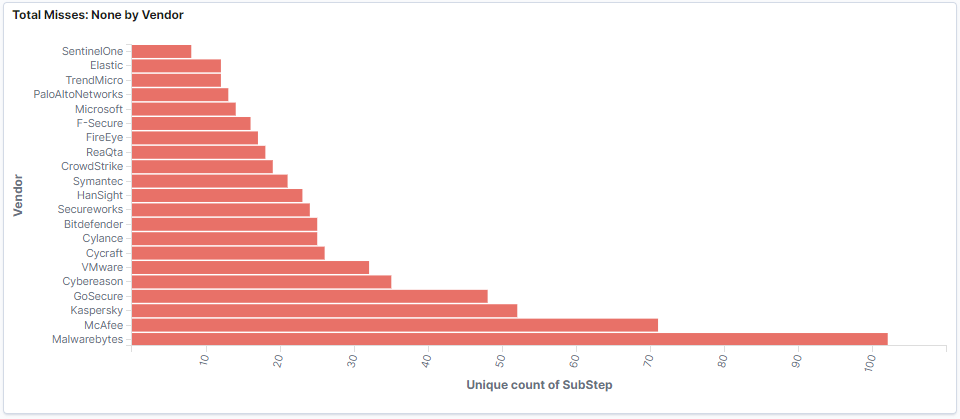
In these visualizations, users can easily identify how many sub-steps were detected by each vendor. The 20 Major Steps are broken down in sub-steps. Sub-steps correspond to the actual procedure that MITRE uses to simulate the activities attackers or users are performing in the victim’s environment. In total, 140 sub-steps were used during the evaluation (the final dataset contains only 134 because Step #19 contained 6 sub-steps that were eliminated).
Total detections (excluding MSSP): Sub-steps by vendor (product performance only)
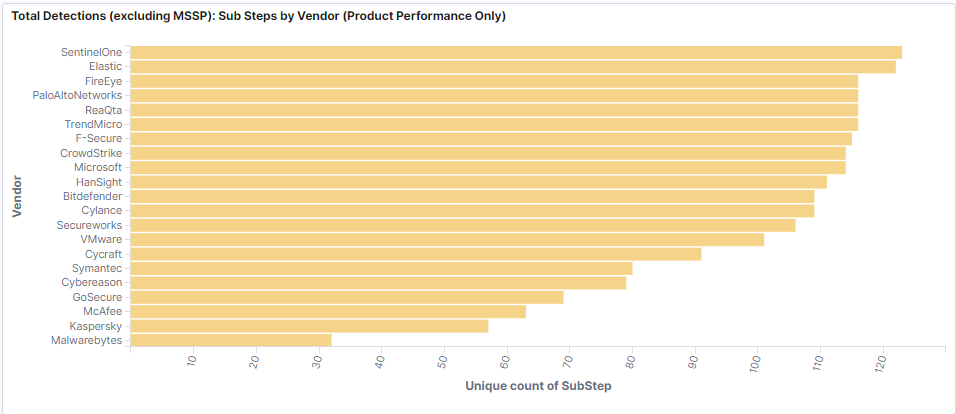
Not every organization has a managed security service provider (MSSP) to augment its security program. In this visualization, we excluded MSSP-driven detections to give you a better understanding of the product-only detection capabilities.
Main detection category details
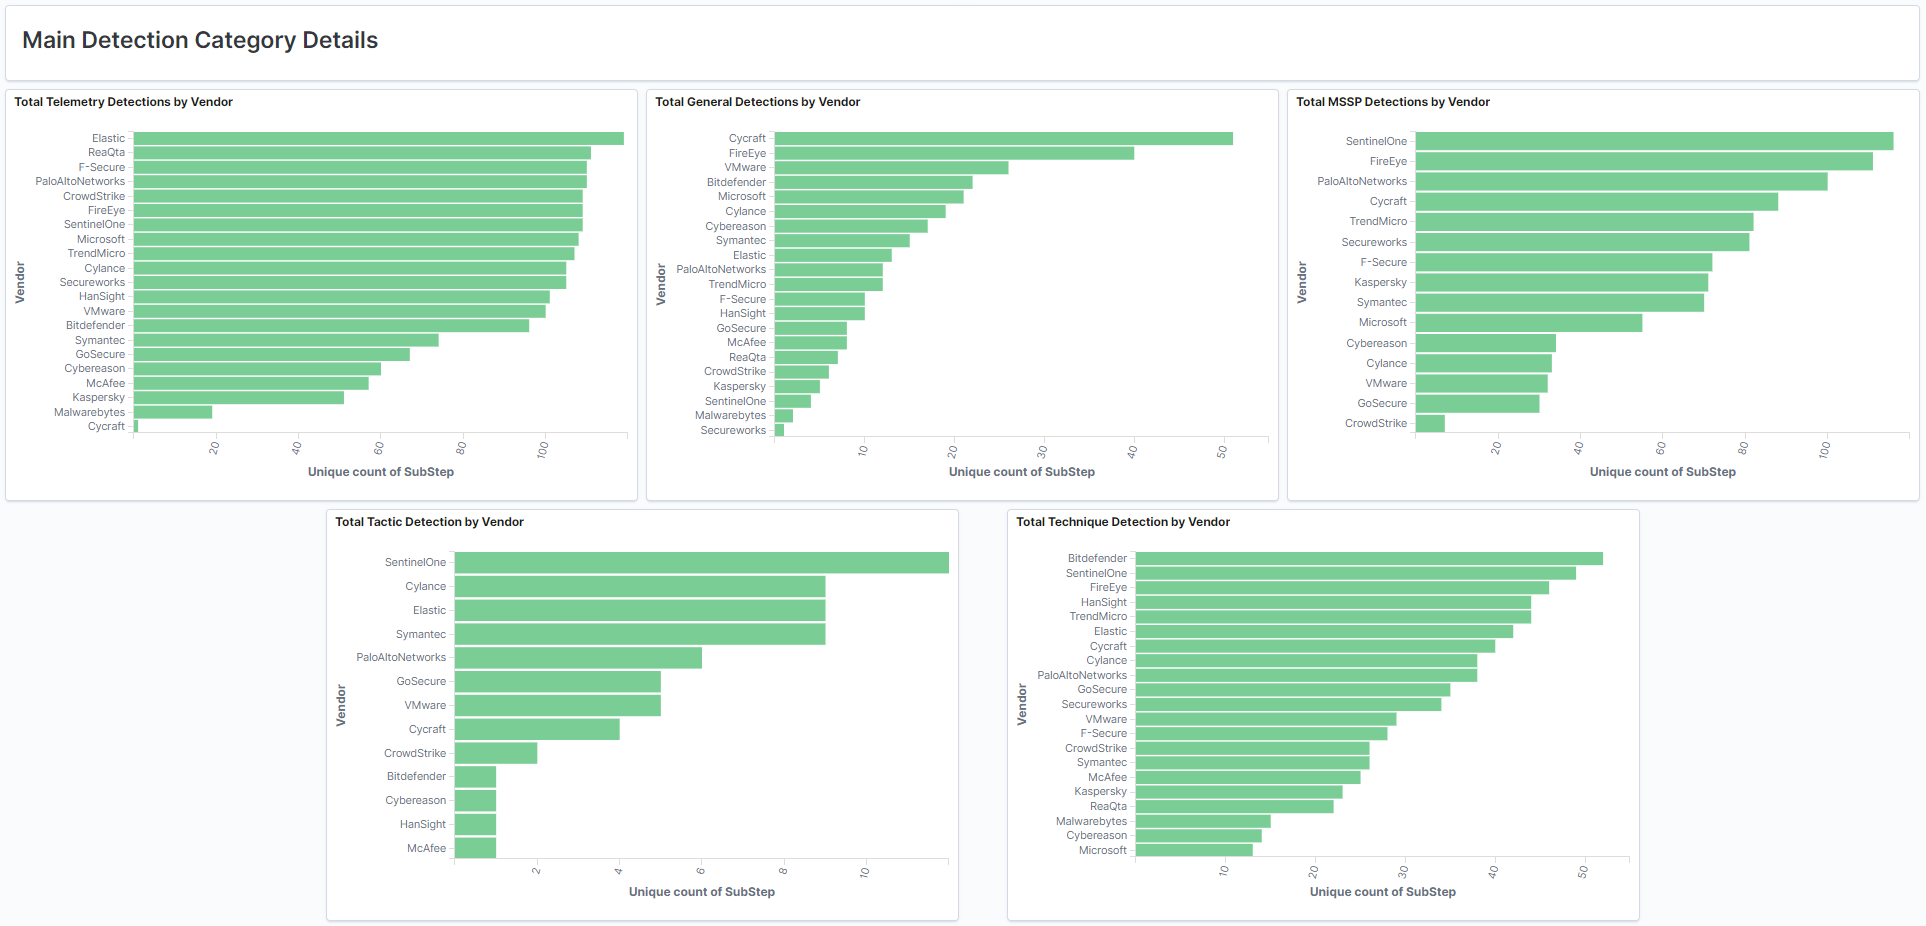
MITRE outlined six detection categories. The visualizations above show five of these categories per vendor. The “none” category is shown above as Total Misses: None by Vendor.
Tactic and technique heat maps
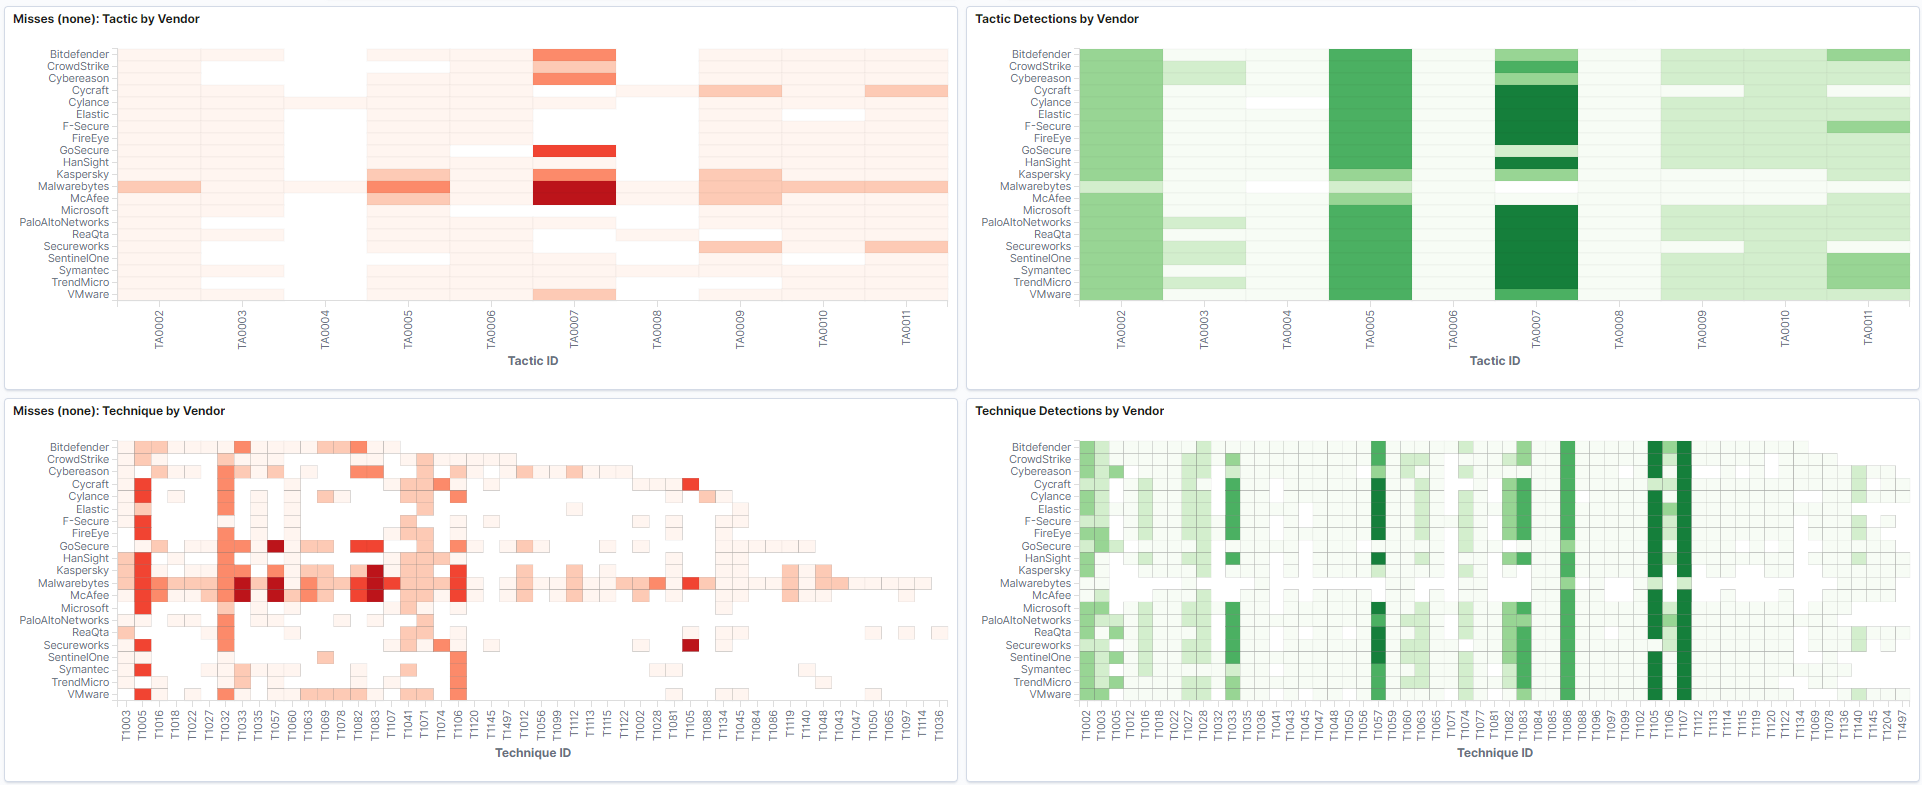
In the four visualizations above, we compared vendor detections as they relate to the respective ATT&CK Tactic and Technique mapping per evaluation step. We additionally thought it was useful to see the tactics and techniques that were missed by vendors.
Summations of the evaluation techniques and tactics

The four previous visualizations show the total detection count associated with each evaluation step. Keep in mind, vendor filters will be helpful here. For instance, if you are looking at all vendors, you will see the sum total of detections for techniques and tactics.
(Editor’s note: We observed a bug by including NONE detections in this graph, we will update in the coming days)
Raw data

And finally, maybe you just want to see the raw detection events. The last table shows each detection category and notes in a simple table. This can be very powerful as you filter the dashboard on a per-vendor basis.
Final thoughts
As a security vendor, there is nothing more exciting than showing your solution to practitioners, customers, and the community. A well-deserved thanks to MITRE for the entire evaluation process. These evaluations helped us reflect on our solution’s workflows, and here at Elastic, we are constantly working to give our users not only industry-leading protections, but the best experience possible.
This year’s evaluation was especially fun because of the abundance of living off the land techniques — specifically PowerShell — to evade detection. At nearly each evaluation step, a new PowerShell script was loaded to perform the red team action. Furthermore, MITRE’s red team’s toolkit encompassed many ATT&CK techniques that are inherently benign. So in addition to detecting malicious behaviors during the evaluation, it was especially important to correlate seemingly normal events to malicious intent. These evaluations are rarely about alerts, but rather your solution’s ability to relate an observation or detection to the overall incident.
We hope you enjoy looking at the results yourself via these Kibana visualizations. We will be following up with our own analysis soon, so stay tuned.
Want to give Elastic Security a spin? Try it free today, or experience our latest version on Elasticsearch Service on Elastic Cloud.