What's new in Elastic Observability 7.11: APM service health overview page plus ECS logging library is GA
We are pleased to announce version 7.11 of Elastic Observability, introducing several features that accelerate investigative workflows and reduce mean time to insight (MTTI) and mean time to resolution (MTTR) across observability use cases. The new service overview page in Elastic APM aggregates key aspects of service health into a single view, enabling developers and reliability engineers to quickly troubleshoot service issues and identify the root cause with minimal context switching. Similarly, the Metrics app adds an enhanced view that presents host health in a single at-your-fingertips panel, streamlining infrastructure monitoring and troubleshooting workflows. Finally, Elastic Common Schema (ECS) logging libraries, which automatically inject trace context into application logs to enable log ↔ trace correlation, are now generally available.
Experience the latest version of Elastic Observability on our Elasticsearch Service on Elastic Cloud (a free 14-day trial is available) or install the latest version of the Elastic Stack for a self-managed experience.
And now, without further ado, here are a few of the highlights from this release.
New service health overview in Elastic APM accelerates root cause analysis and troubleshooting
Modern cloud-native applications are often composed of tens or hundreds of microservices. The ability to quickly pinpoint the state of an individual service is critical to an incident investigation workflow, and can help lower MTTI/MTTR. For instance, a service map might help you pin an application issue to a specific service, but then you need to figure out why that service is misbehaving. In 7.11, we are introducing a brand new service overview page that summarizes all the information about the health of a service in one place, and makes it easier for developers and SREs to answer these “why” questions on one page:
- How did a new deployment impact performance?
- What are the top impacted transactions?
- Is regression introduced by downstream services or backends?
- How does performance correlate with underlying infrastructure? Which instances (containers, VMs) are the performance issues occurring on?
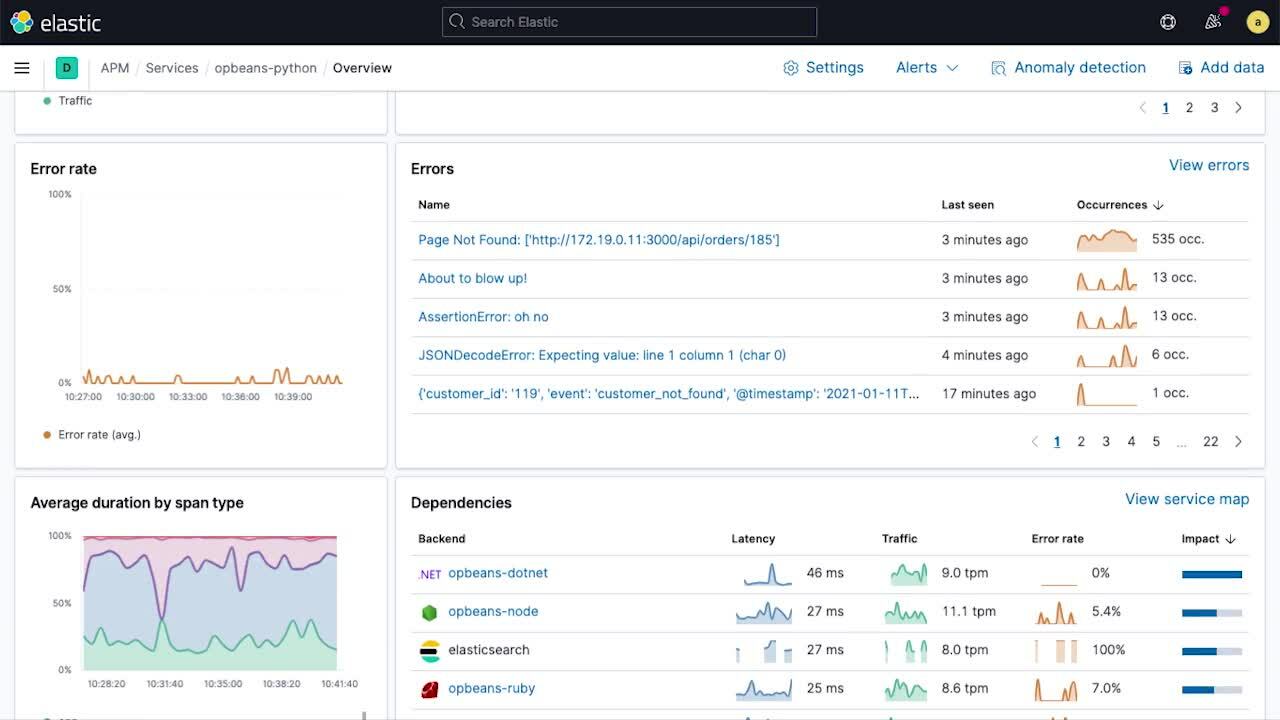
Time series charts showing service latency, traffic, and error rate provide a high-level view of service KPIs over time. Overlaid annotations — deployment markers, anomaly alerts, etc. — on the time series charts provide rich context into key events that might have contributed to changes in behavior. These annotations immediately help narrow the scope of investigations which can provide a remediation path (e.g., rollback).
The sparklines on the service overview page provide a compact view of temporal trends of subcomponents, making it easy to spot unusual changes in behavior (for example, when the error rate on a particular transaction spikes) and unearth good "next steps" during an investigation. The service overview page also shows service health broken down by the infrastructure instances (e.g., containers) that the service is deployed on, making it easy to connect issues to problems with underlying infrastructure.
Version 7.11 introduces the first phase of this new service health view, and future releases will bring additional context and views into the mix to further streamline and accelerate troubleshooting and root cause analysis workflows.
Troubleshoot infrastructure issues more quickly with new enhanced host details view
The resource heatmap in the Metrics app gives a bird's-eye view of the state of your infrastructure, making it easy to quickly spot troubled resources (e.g., hosts with spiking CPU) and narrow down the next steps of an investigation by pinpointing hosts that need closer inspection. We are introducing a new view to the Metrics app that makes it easy to go from this high-level view and zoom out for a historical trend of key metrics for individual hosts.
Similar to the how the new service landing page in APM provides at-a-glance trends, the enhanced host details view helps accelerate root cause analysis by consolidating all the information (logs, metrics, processes, etc.) you need about a host in a single view, making it easy for infrastructure ops teams to monitor and troubleshoot infrastructure issues.
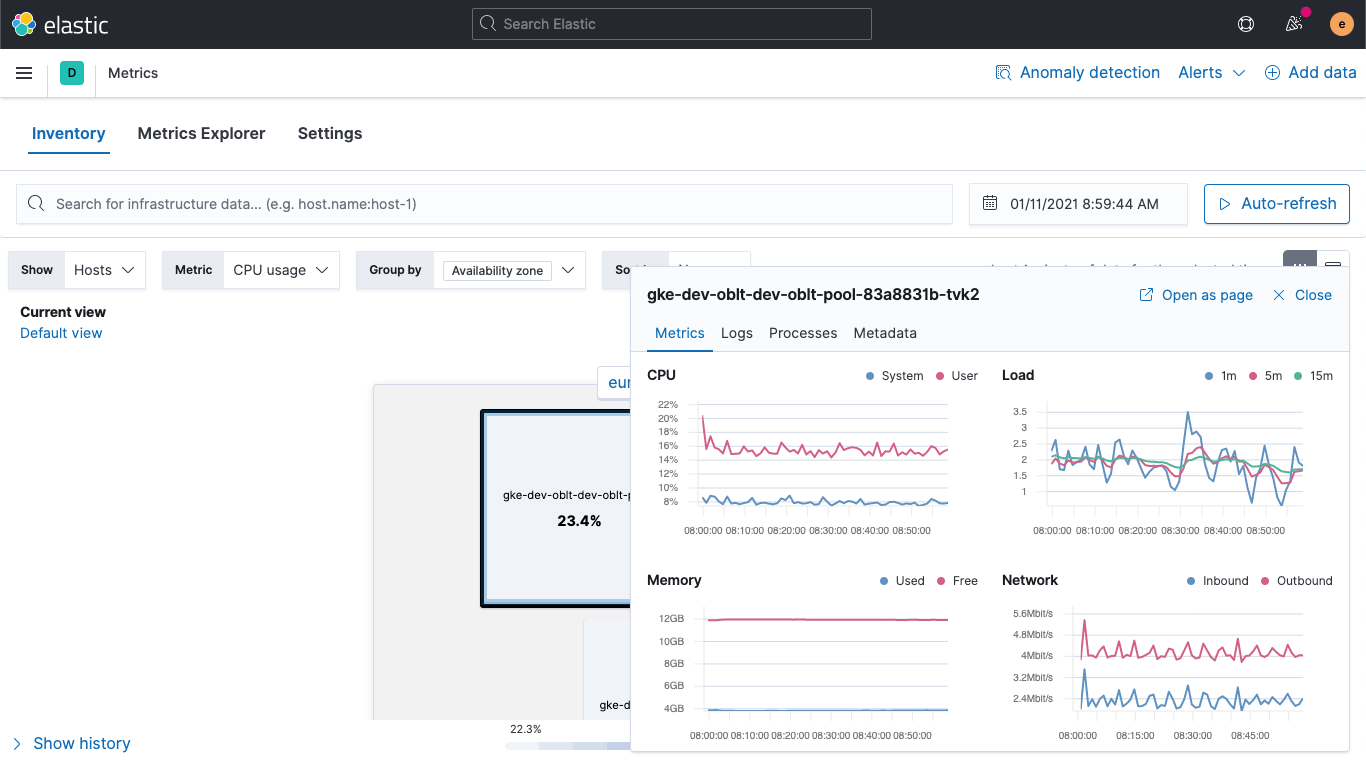
Clicking on a tile in the heatmap brings up a popup that surfaces key information about the host, including:
- Time charts of key host metrics (CPU, memory, network, etc.)
- Logs generated by the host or services running on that host
- Top processes running on the host (by CPU or memory)
- Host metadata (operating system, cloud provider details)
- Links to get even more detailed information for trace or uptime data
Version 7.11 debuts this enhanced view for hosts or VMs, and future releases will extend this functionality to other resource types (pods, containers, etc.) in the Metrics app.
Learn more about the service overview page and other new APM features in the what's new in 7.11 docs.
ECS logging libraries deepen application observability with automatic linking between application logs and traces
Being able to correlate application logs and traces, and navigate between them without losing context, is vital to application troubleshooting workflows. Which logs belong to a particular trace, or which trace generated them? What application request triggered these logs? Elastic Common Schema (ECS) logging libraries, now generally available in 7.11, make it easy for application developers to automatically inject the trace context captured by the APM agent into their application logs, enabling the log-to-trace correlation required for streamlined analysis.
ECS logging libraries are plugins for your favorite logging frameworks (e.g., log4j), and let developers easily write application logs in an ECS-compliant JSON format, without changing their native workflows. ECS loggers automatically include the relevant trace context captured by the APM agent into the log, helping developers create observable applications with no extra work. The captured trace context typically includes trace.id transaction.id, and span.id, as necessary.
Building on this fundamental linking at the data level, 7.11 brings an embedded logs stream directly into the trace view, which means that users can directly see the logs associated with a specific trace without shifting visual context during an investigation.
In addition to this log ↔ trace correlation, capturing logs in the ECS format adds other benefits, including automatic parsing, human-readable logs, and a normalized data model across your entire application stack.
Learn more about this and other enhancements for infrastructure monitoring in what's new in 7.11
Other notable highlights
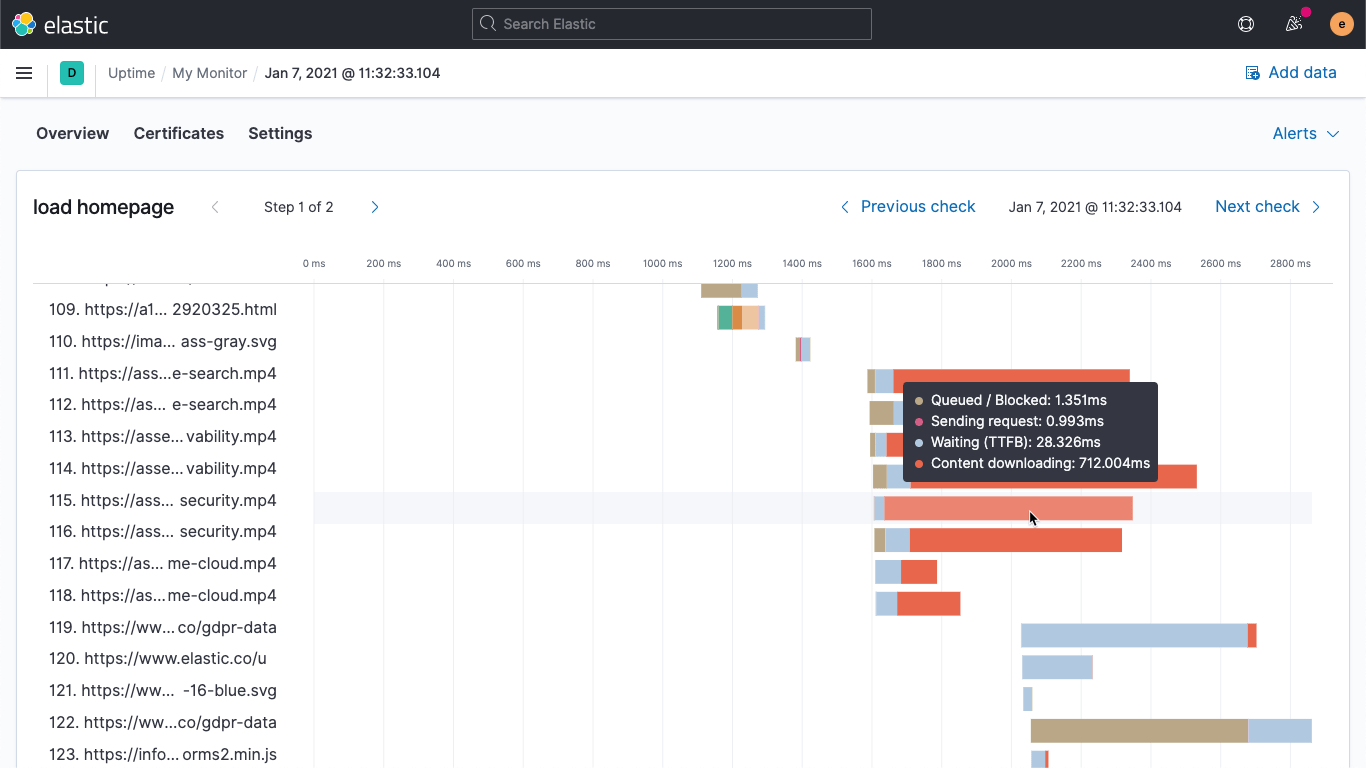
Page load waterfall chart
In 7.10, we debuted synthetic monitoring for multistep user journeys. With 7.11, we are releasing the first iteration of our page load waterfall that displays the connection stats for each object in the page. The load time waterfall view lets a user quickly spot the performance bottleneck in the end user experience during synthetic tests.
Runtime fields lay the foundation for schema on read
As the name suggests, runtime fields, one of the most requested features from the Elastic Observability community, allow you to create new fields on the fly at run time by transforming, enriching, or extracting fields from indexed data. It’s a foundational feature that enables new observability workflows, including one of the most requested features of all time: schema on read.
With the launch of this feature, users now have the best of both worlds. Use schema on write and enjoy blazing fast search and analytics speed by parsing and structuring data at index time. Or go with schema on read by defining fields on the fly at run time for more flexibility in analytical workflows.
Runtime fields are supported in Elasticsearch in 7.11, with limited UI support in Kibana. Read all about our vision in the dedicated post.
Searchable snapshots and cold tier are now generally available
Searchable snapshots, which were introduced as a beta feature in 7.10, are now generally available. Searchable snapshots allow users to directly search and analyze data on object stores like S3, making it very easy to implement a data tiering strategy to balance trade-off between performance and cost. The new cold tier, powered by searchable snapshots, can reduce storage costs by up to 50% with minimal performance impact.
Searchable snapshots and data tiers are game-changing features for observability use cases, letting users do more with less — without increasing operational complexity, changing investigative workflows, or hindering access to data.
Try the new release today!
Go deeper to learn about all of these new capabilities and more in the release highlights.
Better still, start using these great new features by upgrading your deployment to 7.11, grabbing a free 14-day trial of Elasticsearch Service, or installing the latest version of the Elastic Stack.