Elastic Observability 8.15: AI Assistant, OTel, and log quality enhancements

 Share on Twitter
Share on Twitter

 Share on LinkedIn
Share on LinkedIn

 Share on Facebook
Share on Facebook

 Share by Email
Share by email

 Print this page
Print
Elastic Observability 8.15 announces several key capabilities:
New and enhanced native OpenTelemetry capabilities:
Elastic Distribution for OpenTelemetry Collector: This release enables users to ship logs and host metrics to Elastic with minimal configuration. Leveraging a new OpenTelemetry (OTel) mode for Elastic Agent, this release will provide an OTel-native experience that allows customers to explore and monitor their infrastructure within our Observability solution seamlessly.
Support for OpenTelemetry Protocol (OTLP) Universal Profiling in Elastic Cloud: We have added support for Elastic Cloud to accept OTLP profiling data to complement the work we have been doing in the OpenTelemetry project after the successful donation of our profiling agent to the OpenTelemetry project.
Elastic AI Assistant enhancements:
Google Vertex with Gemini 1.5 Pro model connector: In addition to OpenAI, Microsoft Azure (GPT-4+), and AWS Bedrock (Claude 3.0+), we now also have a Google Vertex with Gemini 1.5 Pro model connector for the Elastic AI Assistant for Observability.
Custom index support for Elastic AI Assistant knowledge base: Leverage any search index with your knowledge base for more flexibility in how you empower the Elastic AI Assistant.
Large language model (LLM) observability for Azure OpenAI: Elastic Observability now provides deep visibility on the usage of the Azure OpenAI Service. The integration includes an out-of-the-box dashboard that summarizes the most relevant aspects of the service usage, including request and error rates, token usage, and chat completion latency.
The Data Set Quality page: This page helps users identify problems with data ingestion, indexing, or field mapping to better understand the quality of the data in order to ensure that logs and other data sets are accurate and complete.
Elastic Observability 8.15 is available now on Elastic Cloud — the only hosted Elasticsearch offering to include all of the new features in this latest release. You can also download the Elastic Stack and our cloud orchestration products — Elastic Cloud Enterprise and Elastic Cloud on Kubernetes — for a self-managed experience.
What else is new in Elastic 8.15? Check out the 8.15 announcement post to learn more >>
Introducing the Elastic Distro for OpenTelemetry Collector
The Elastic Distribution for OpenTelemetry Collector is now in public technical preview offering a seamless solution for collecting logs and analyzing host health.
With the Elastic Distro for OpenTelemetry Collector, users can ship logs and host metrics to their Elastic Stack in three simple clicks.
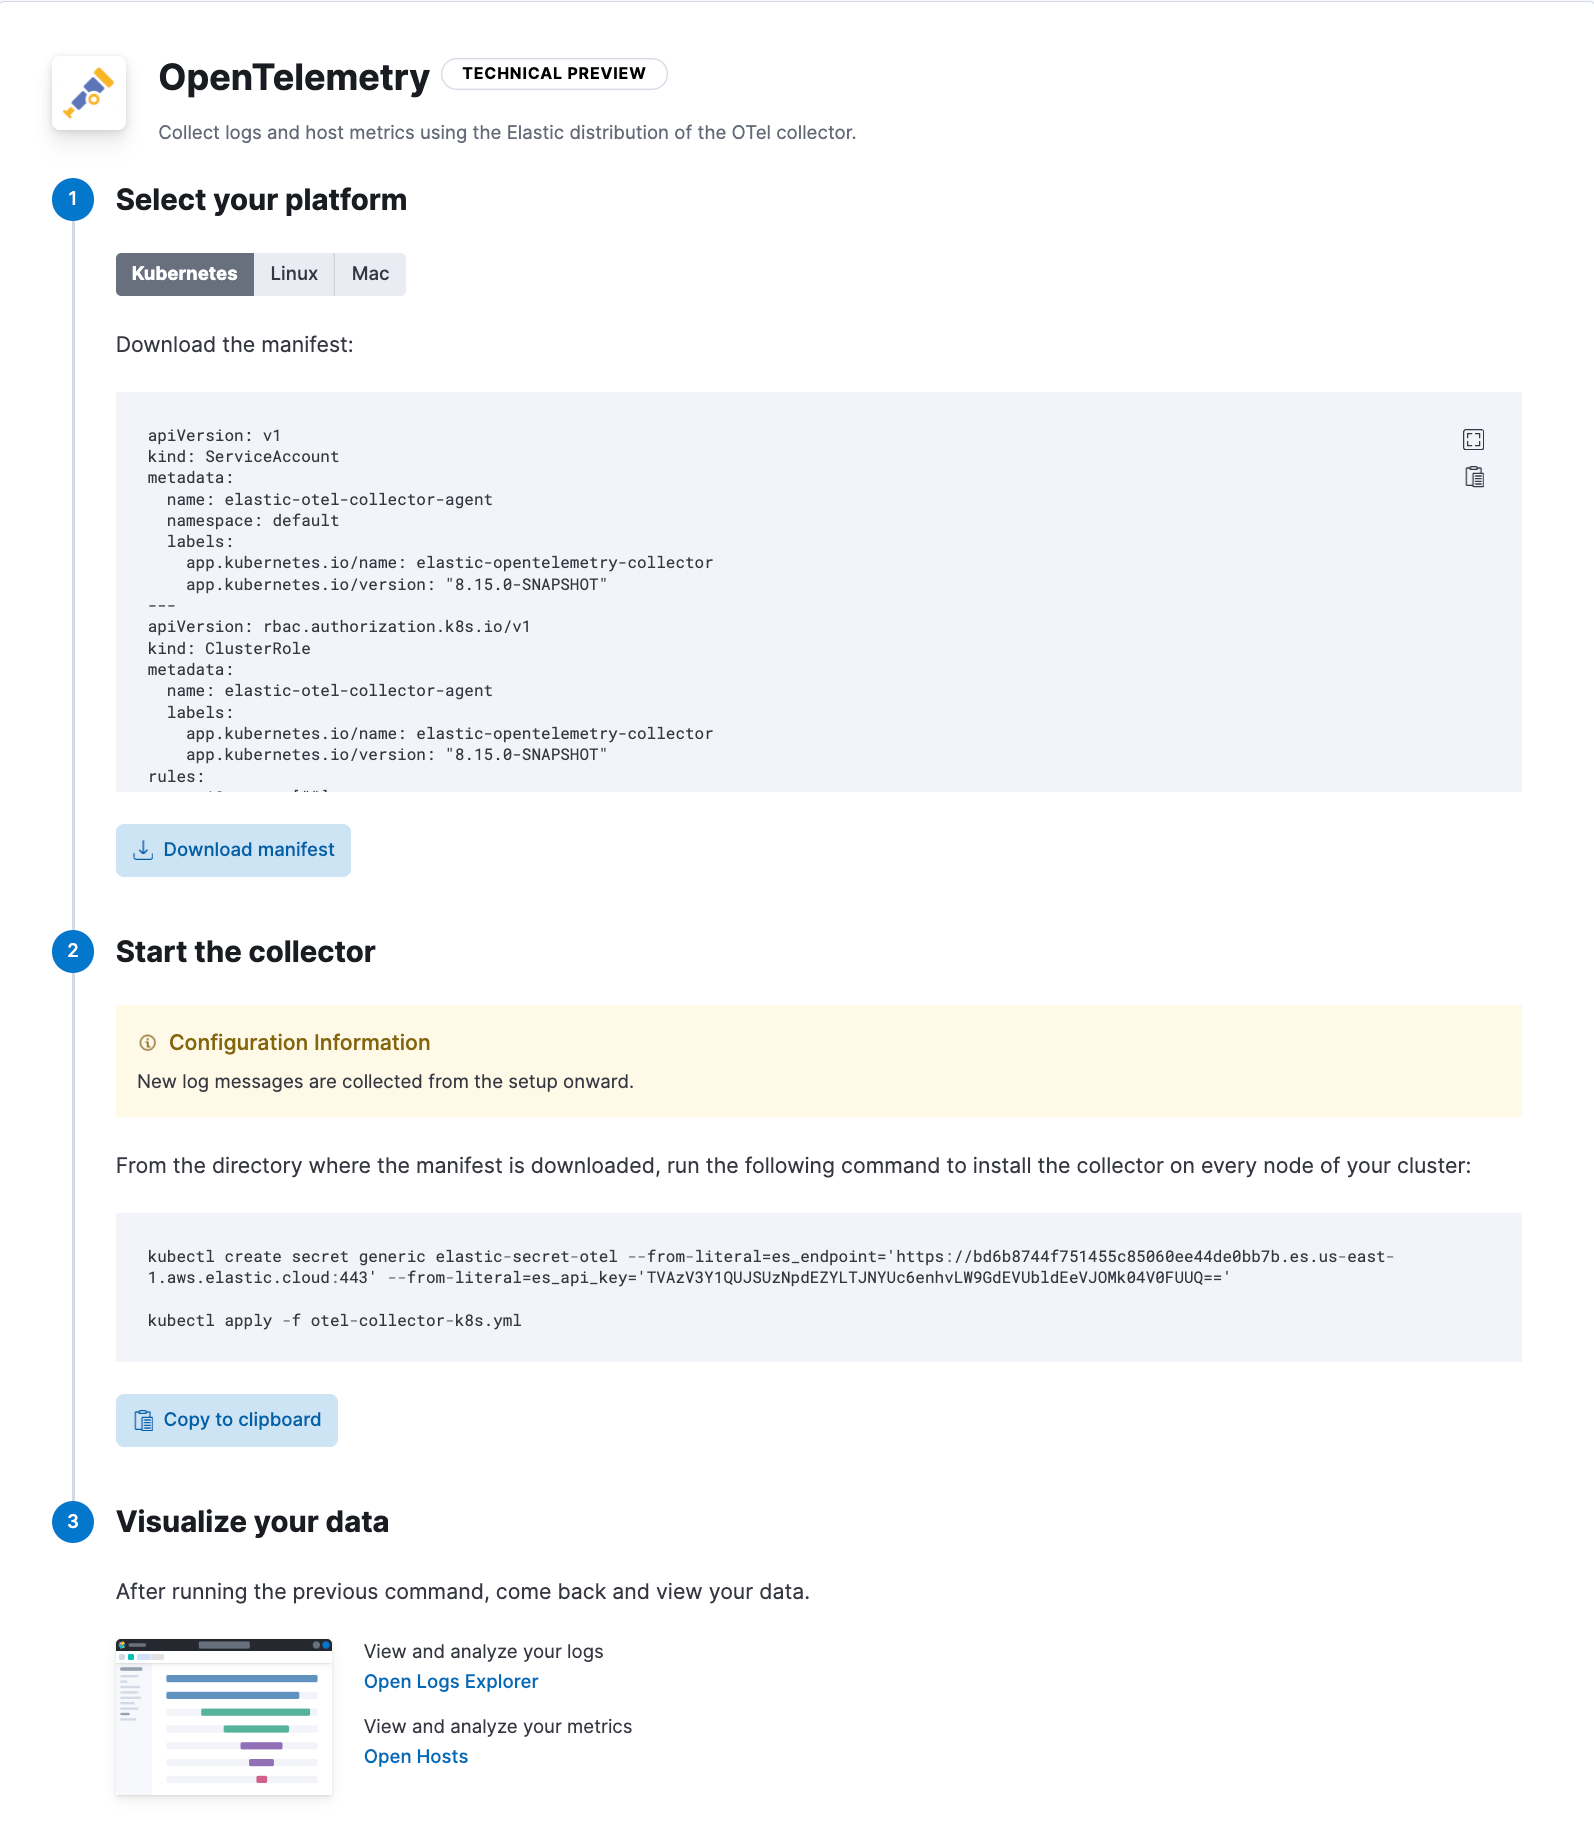
The Elastic Distro for OpenTelemetry enables users to:
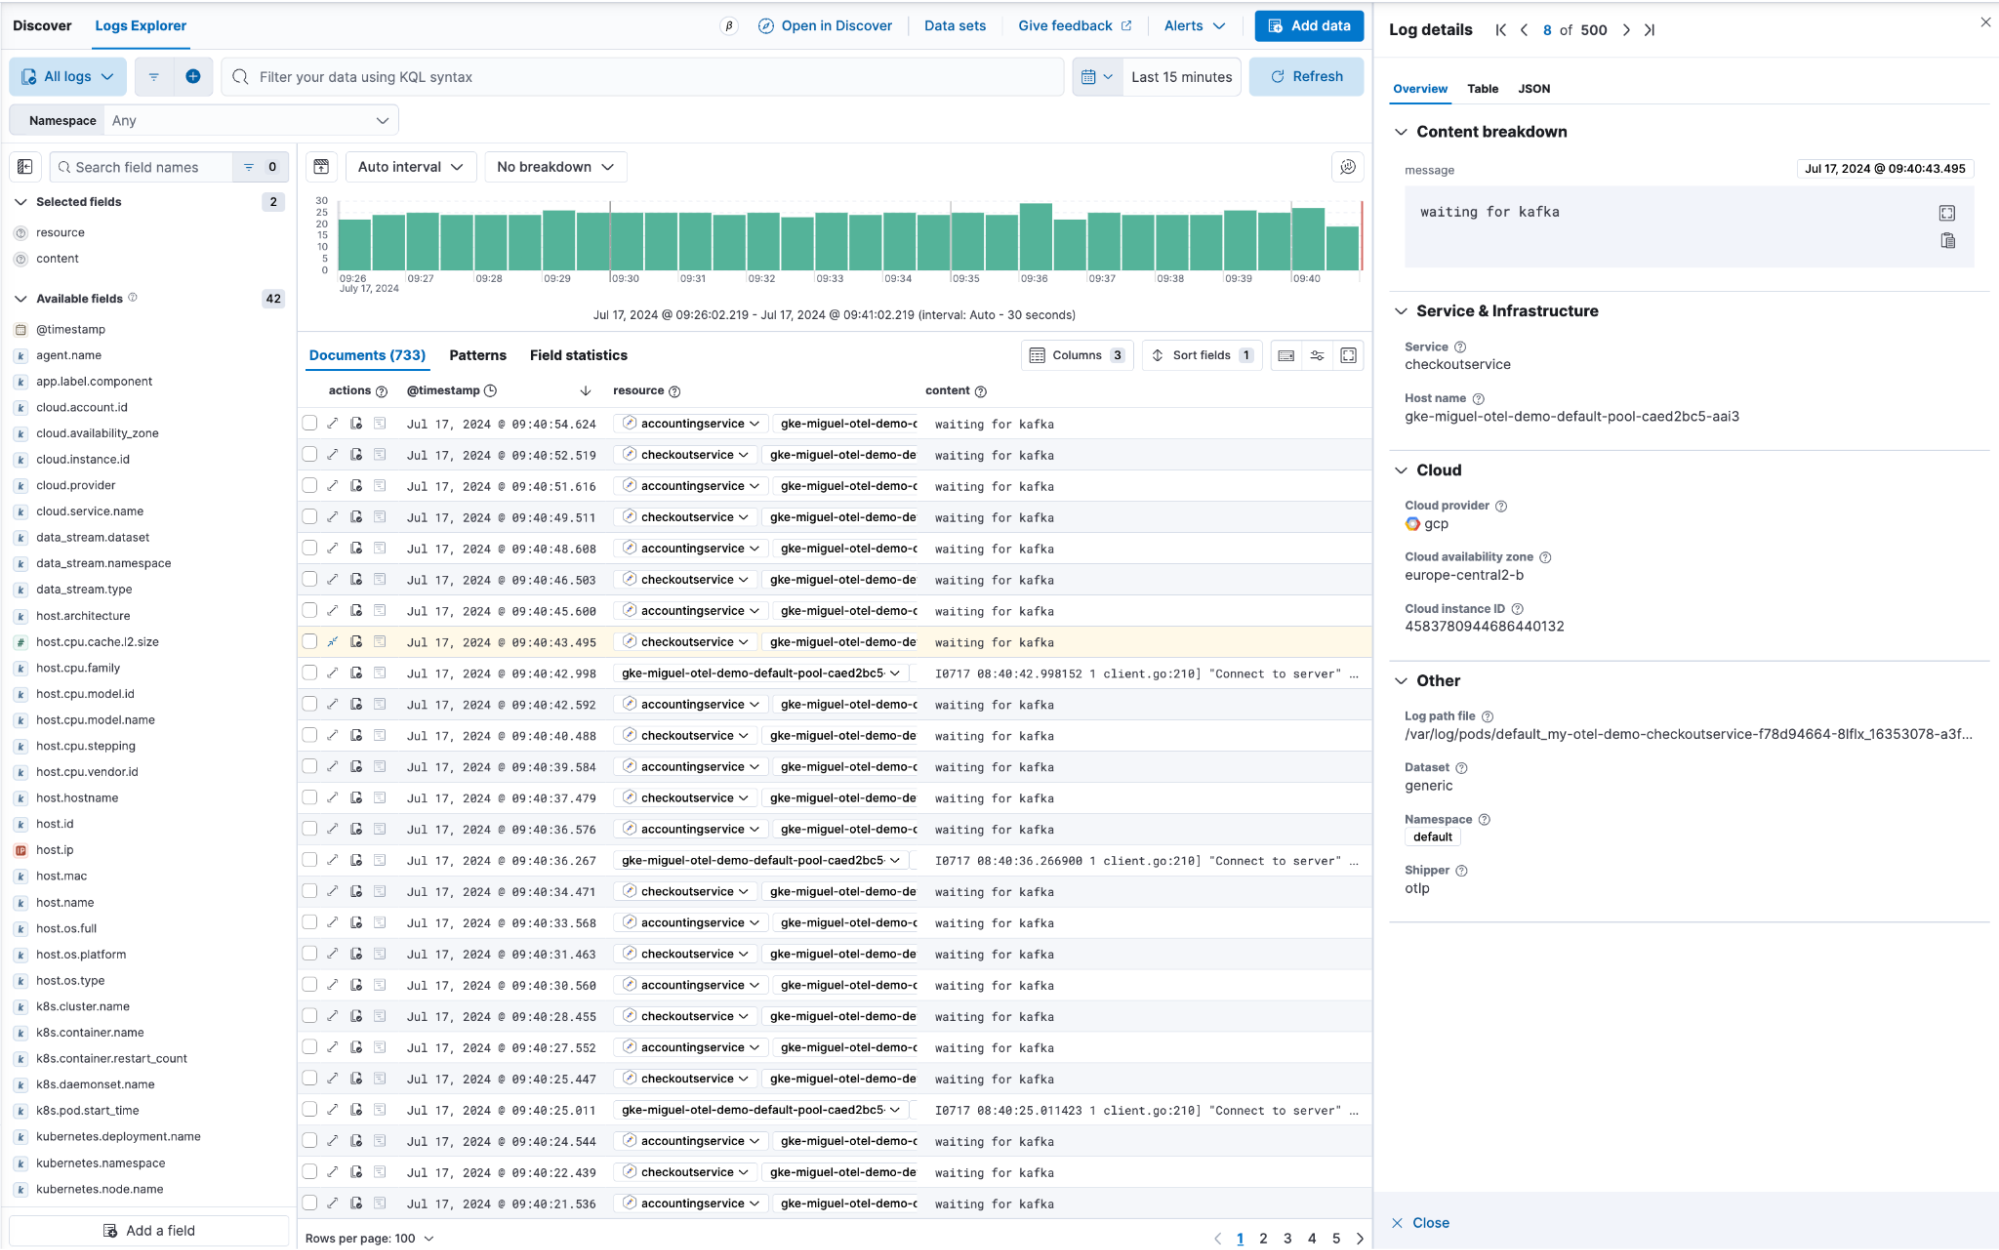
Collect and ship logs: Use the OpenTelemetry Collector to gather log data from various sources and ship it directly to Elastic where it can be analyzed in Kibana Discover.
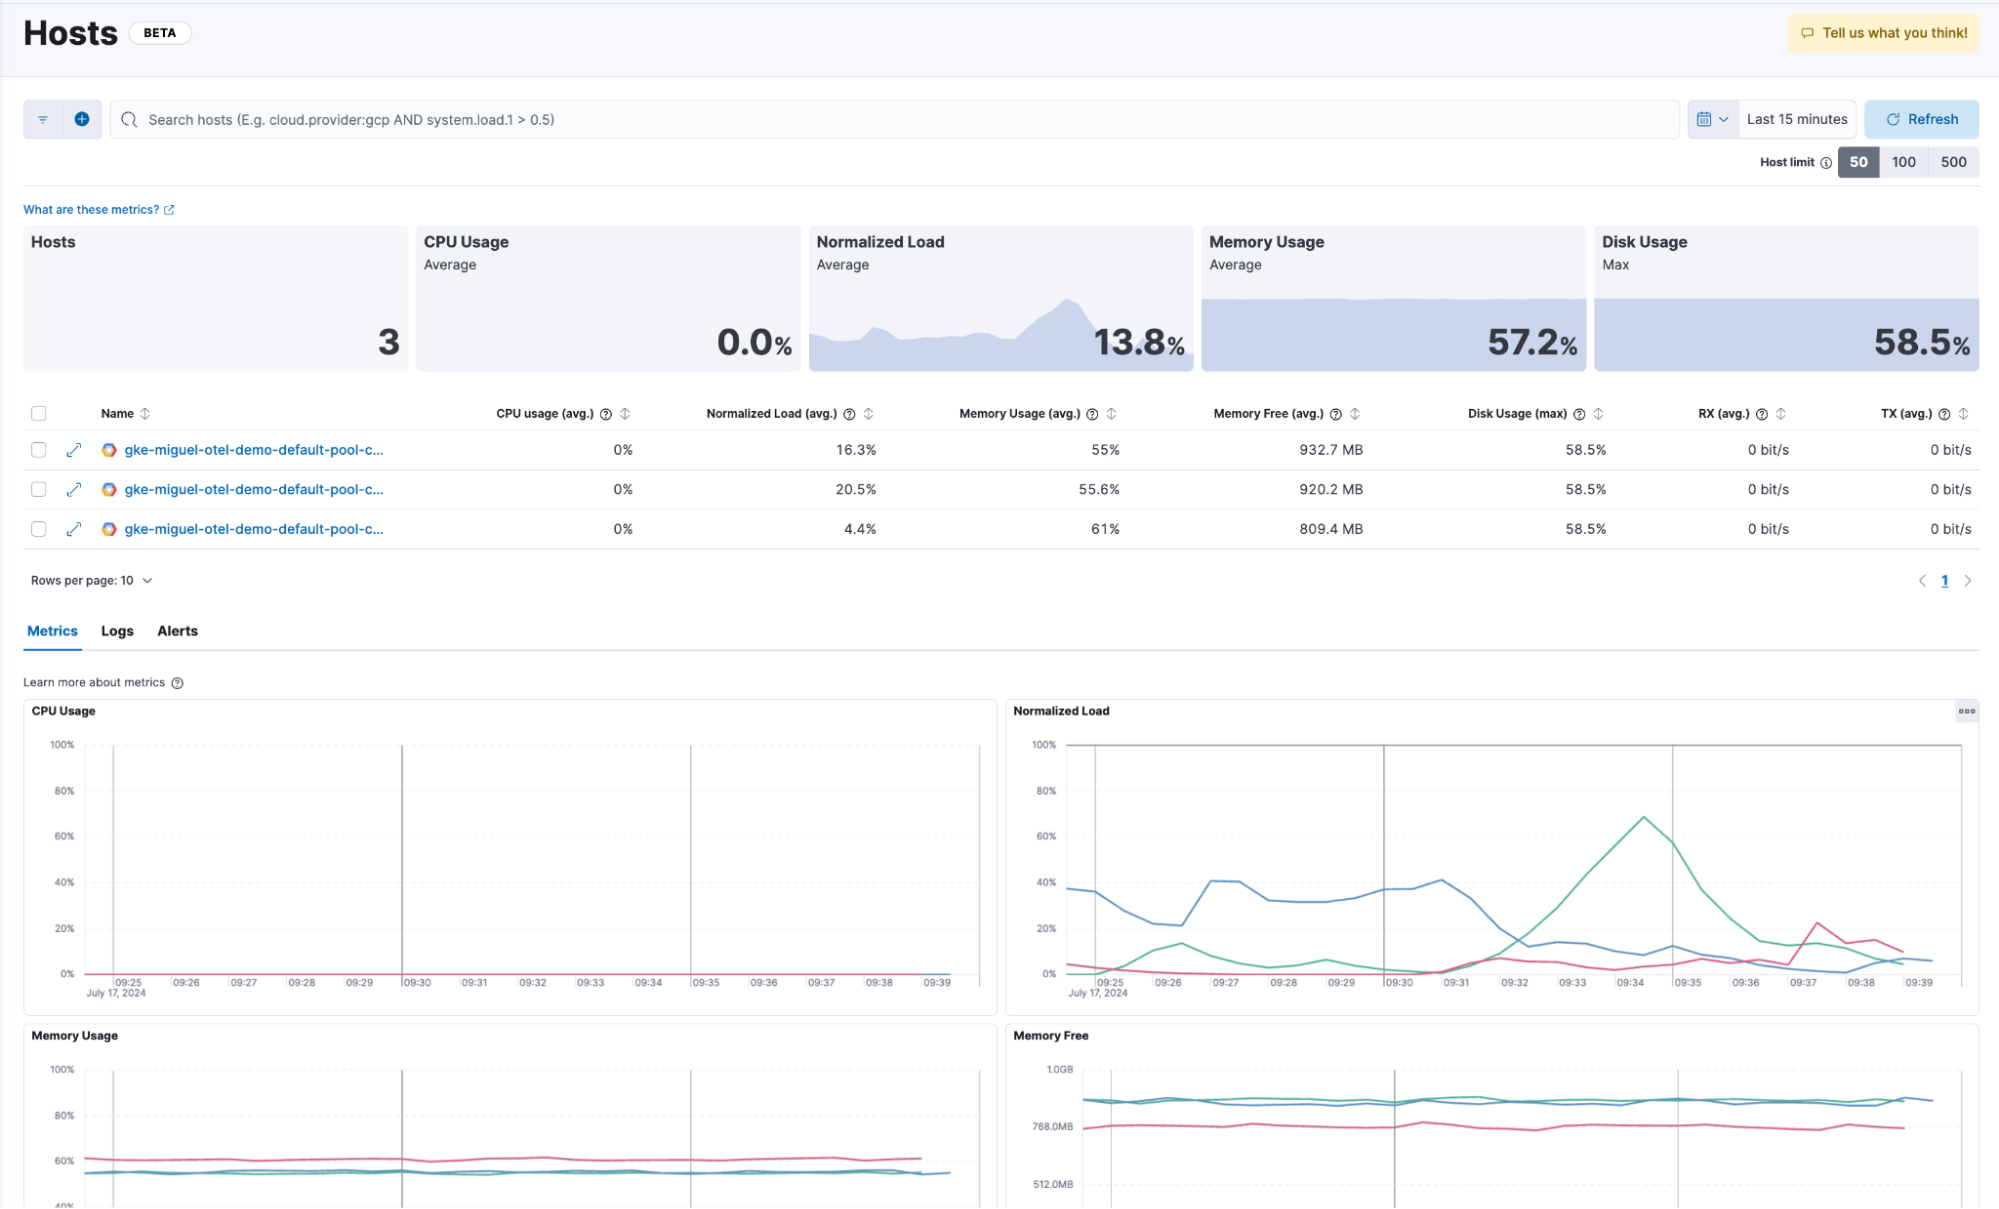
- Assess host health: Leverage the OpenTelemetry host metrics receiver to monitor and evaluate the performance of their hosts. This data can then be visualized and analyzed in Elastic’s Observability Hosts UI, providing deep insights into host performance and health.
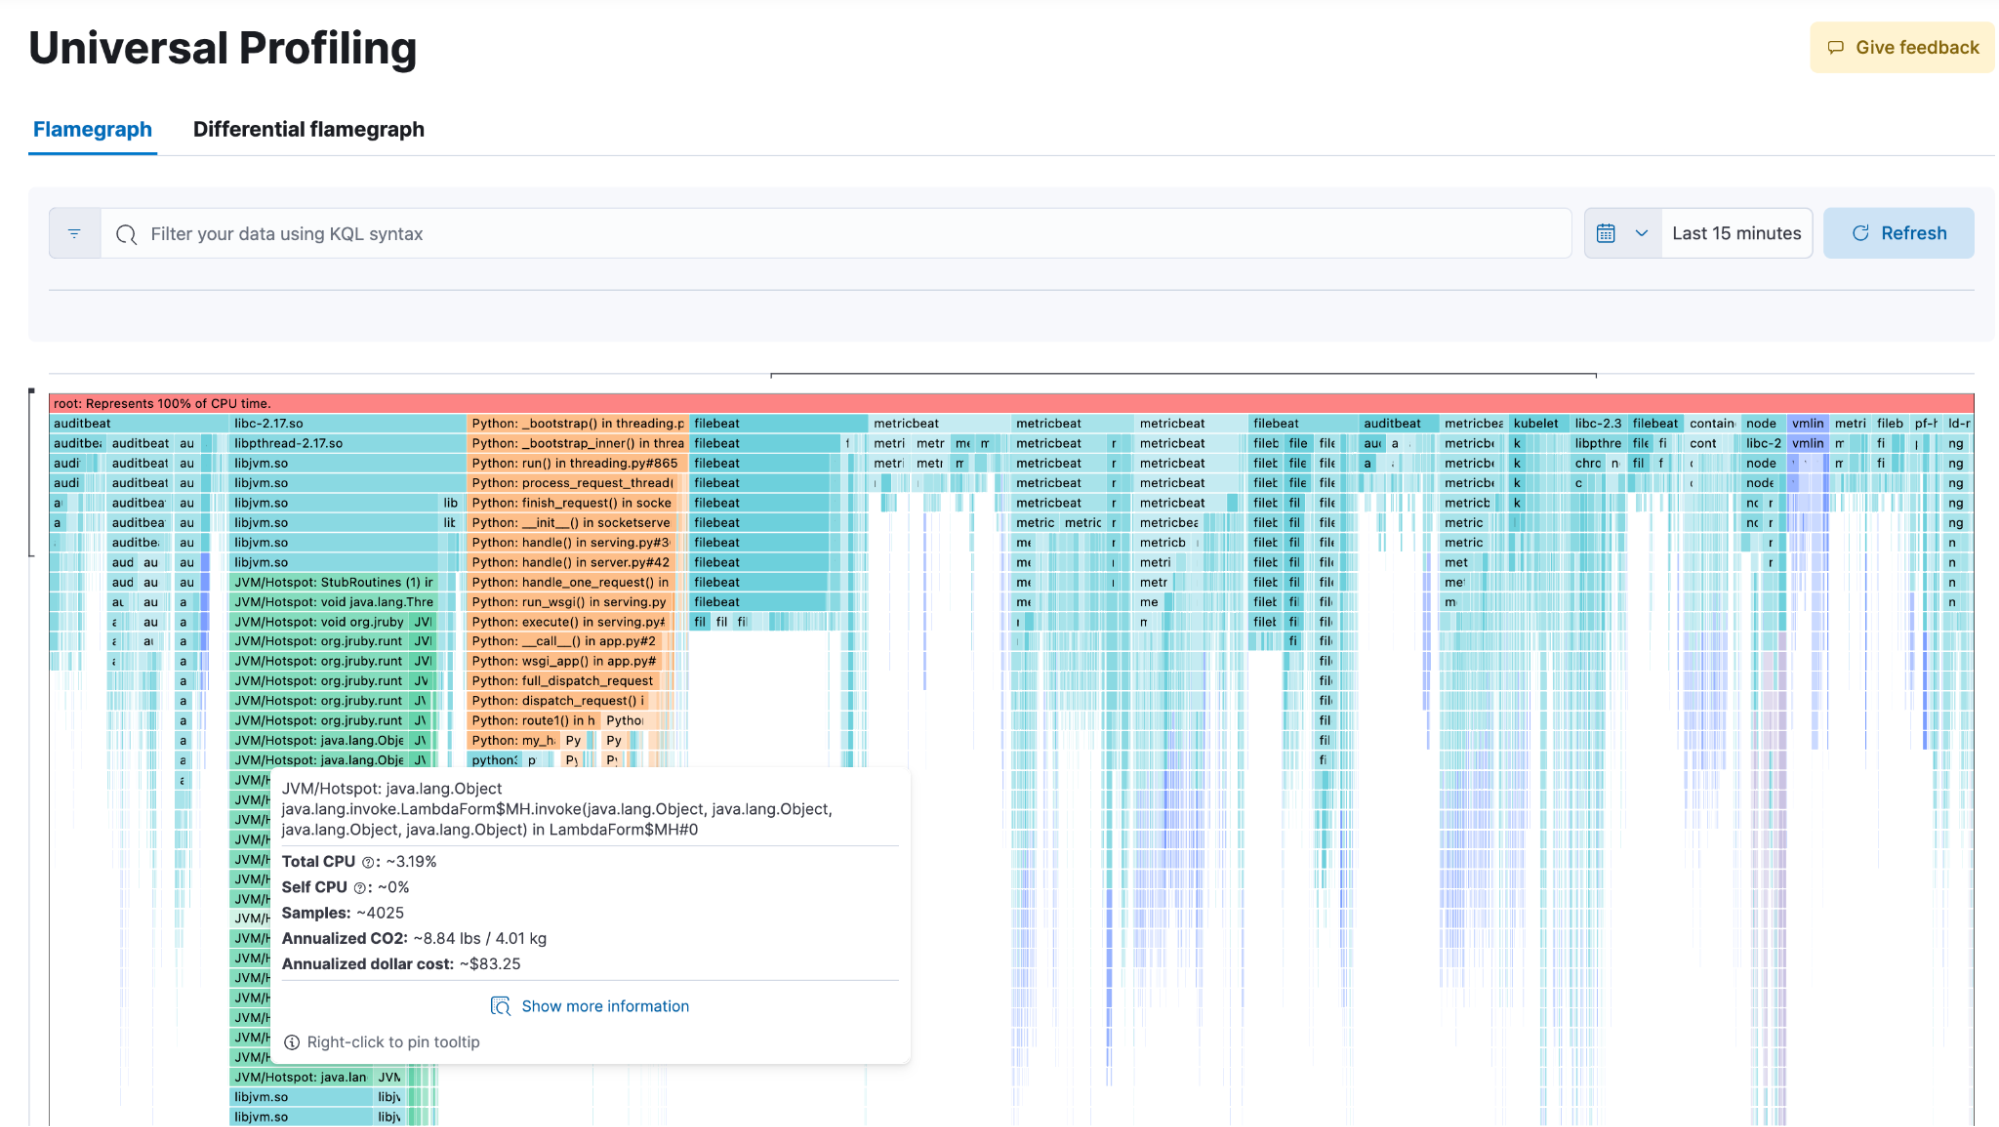
Elastic Cloud now accepts Universal Profiling data in OTLP format
We are adding support for Universal Profiling in OTLP format in Elastic Cloud (ESS). This functionality, now in technical preview, will enable users of our recently donated Universal Profiling agent to use OTLP with Elastic Cloud.
The Universal Profiling agent enables continuous profiling of applications, capturing detailed performance data that can now be sent to Elastic for in-depth analysis.
Elastic AI Assistant adds Google Gemini support and knowledge base index configuration
The Elastic AI Assistant can now take advantage of the Google Vertex AI and use the Gemini family of models. We recommend starting with Gemini 1.5 Pro for Elastic AI Assistant because of Gemini’s large context windows. It can be especially helpful for users who are running Elastic in GCP.
Also new in 8.15, the Elastic AI Assistant allows users to configure any index containing documents that have been vectorized with the Elastic Learned Sparse EncodeR (ELSER) ML model to be searched as part of the Elastic AI Assistant knowledge base. This provides flexibility for how knowledge base data is onboarded to inform whichever LLM that is being used.
LLM observability: Azure OpenAI
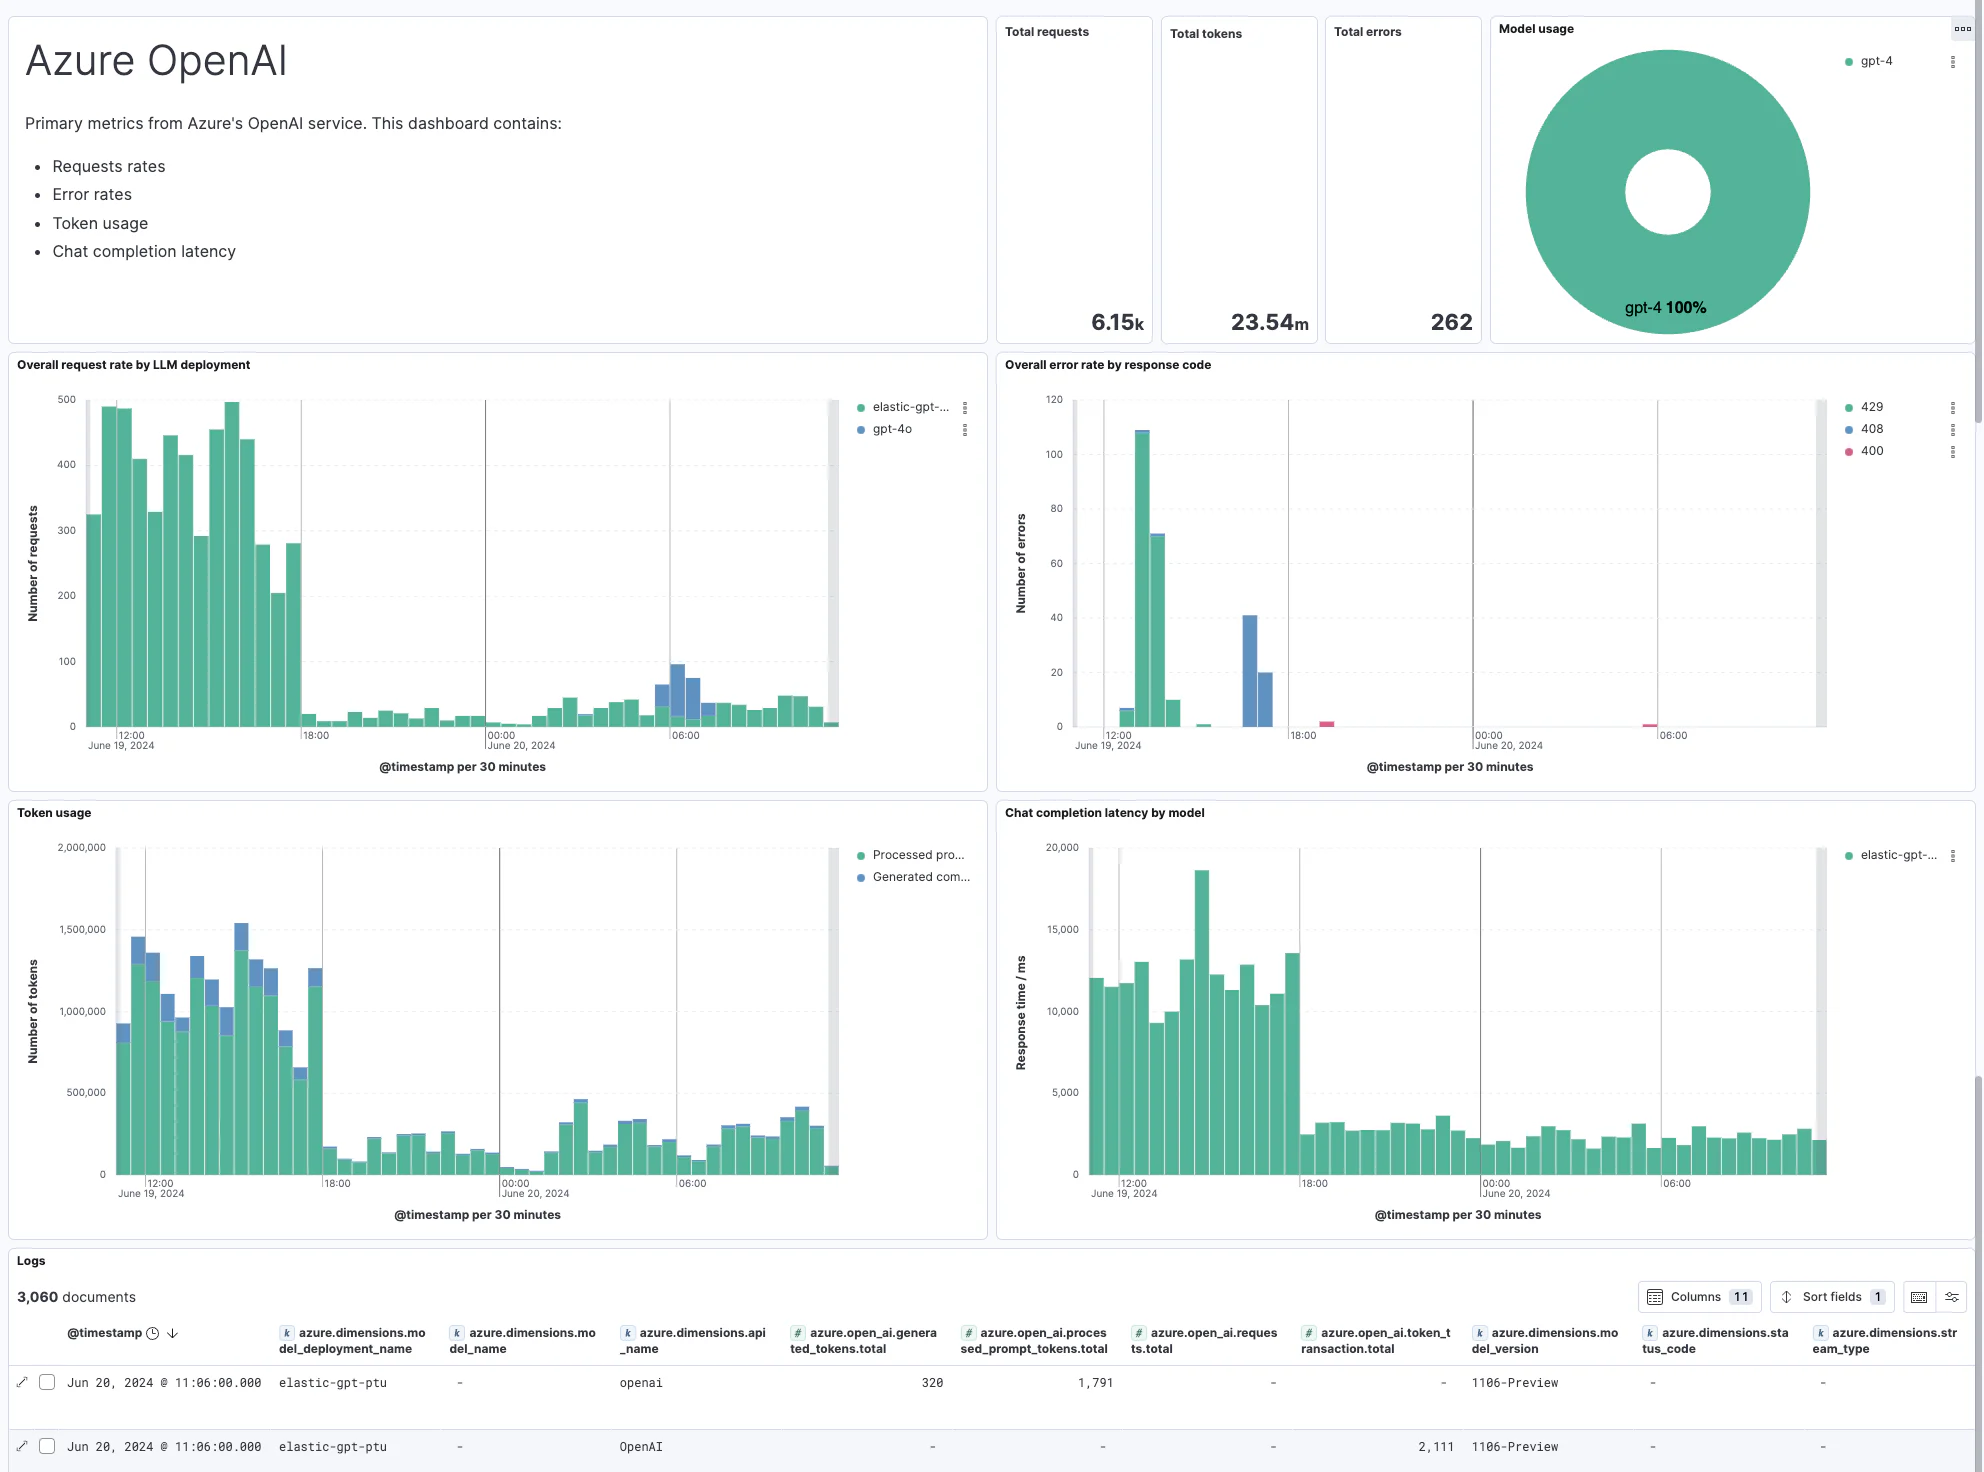
We are excited to announce the general availability of the Azure OpenAI integration that provides comprehensive Observability into the performance and usage of the Azure OpenAI Service!
While we have offered visibility into LLM environments for a while now, the addition of our Azure OpenAI integration enables richer out-of-the-box visibility into the performance and usage of Azure OpenAI based applications, further enhancing LLM observability.
For more information and to get started, please refer to the blog available in Elastic Observability Labs and the user guide!
Logs data set quality improvements
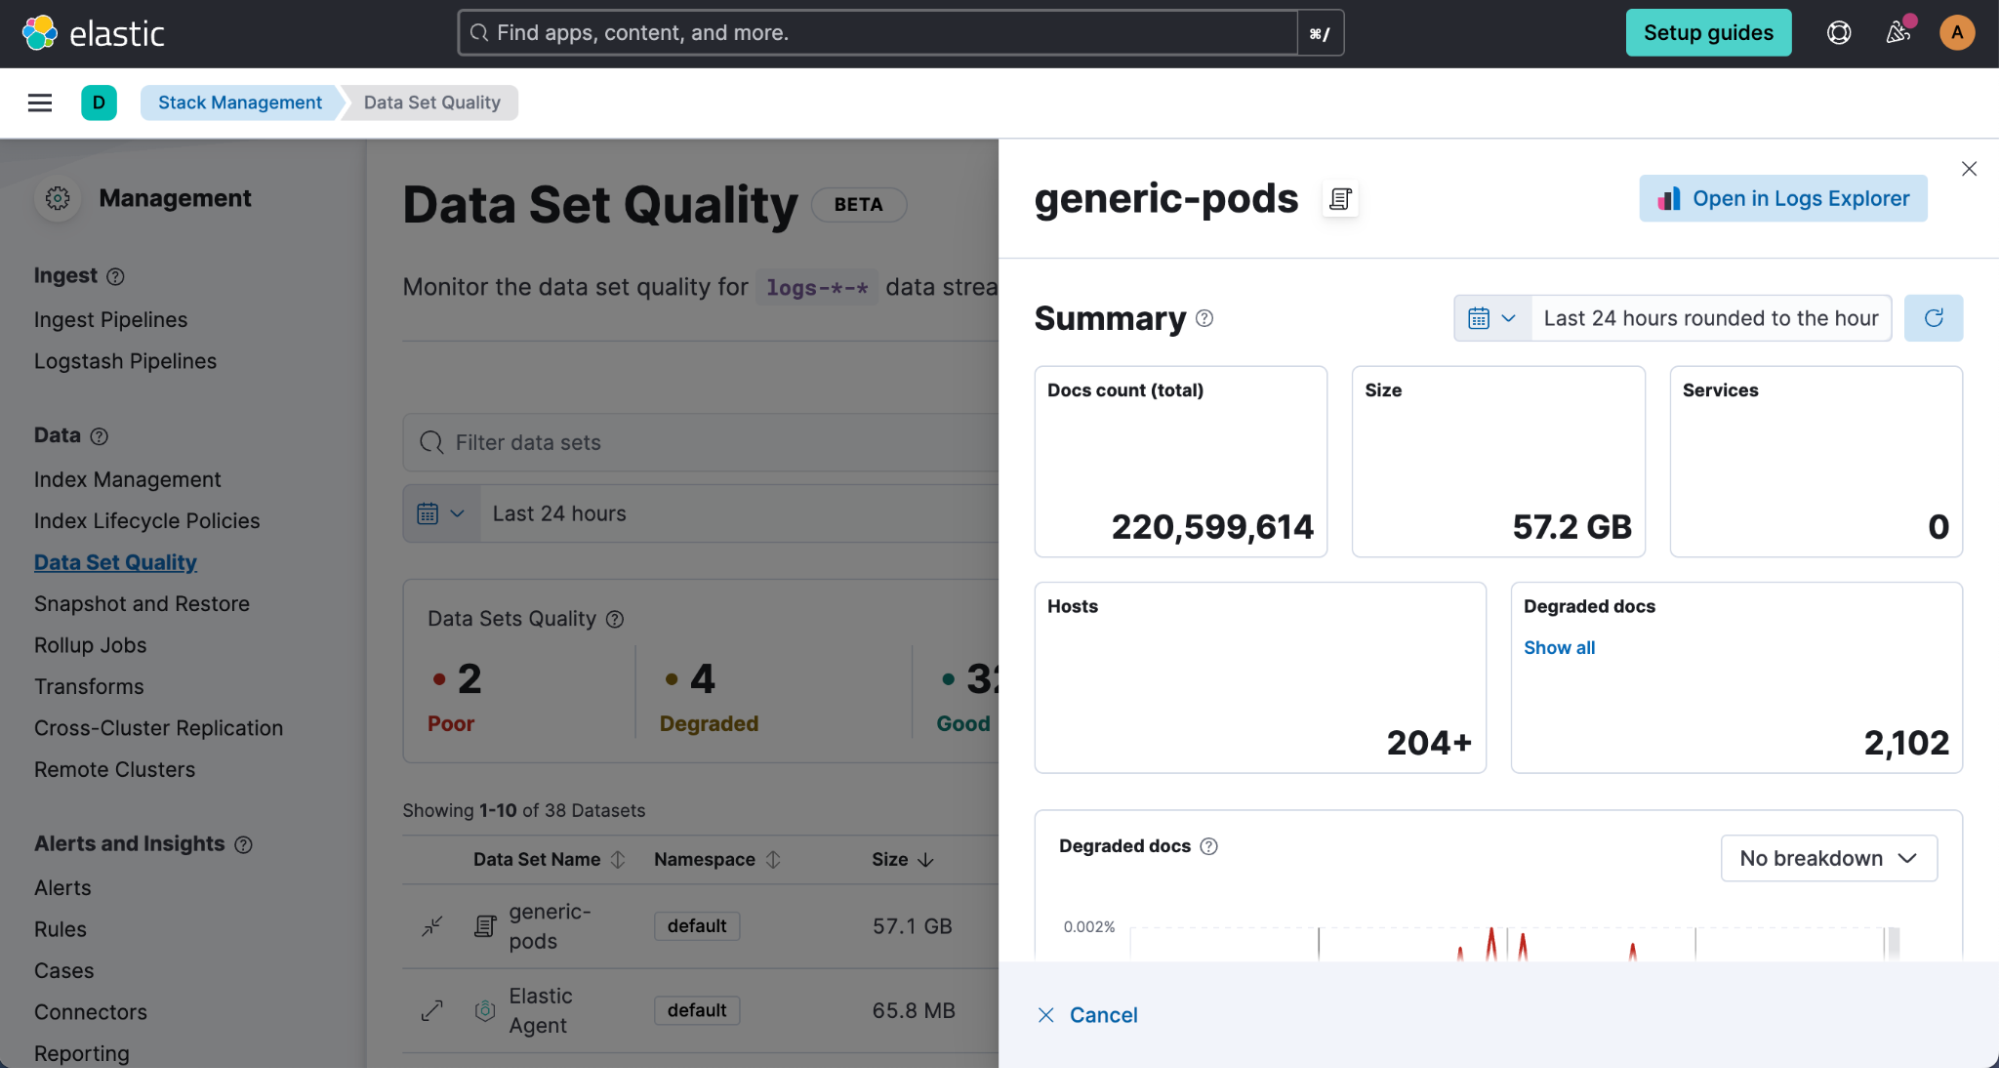
The beta release of our new data set quality feature in Elastic Observability allows users to identify and isolate any issues related to logs data quality, which could occur during ingestion, parsing, and field mapping. By providing an overview of all data sets with estimated size, ingested documents, and quality information based on degraded documents, users can view quality trends over time; identify responsible integrations, fields, and data types; and drill down into specific issues. The document viewer also highlights any problems with log ingestion and parsing, ensuring data completeness for each individual log message. Upgrade your cluster to the latest version to try this new experience yourself!
SLO history and status reporting

We have added a couple of updates to make navigating Service Level Objectives (SLOs) easier. We are introducing a History tab in the SLO Overview page, so users can now look back at any period of time and zoom in on what the status of the SLO was at that time, as well as zoom into the charts to refine the time period.

In addition to looking at the history of SLOs, we have implemented additional status options to manage the SLOs better. Added status conditions include “Stale” and “No Data,” which can be used to find SLOs that have stopped reporting data or that never started enabling users to edit them or clean them up.
Try it out
Read about these capabilities and more in the release notes.
Existing Elastic Cloud customers can access many of these features directly from the Elastic Cloud console. Not taking advantage of Elastic on cloud? Start a free trial.
The release and timing of any features or functionality described in this post remain at Elastic's sole discretion. Any features or functionality not currently available may not be delivered on time or at all.
In this blog post, we may have used or referred to third party generative AI tools, which are owned and operated by their respective owners. Elastic does not have any control over the third party tools and we have no responsibility or liability for their content, operation or use, nor for any loss or damage that may arise from your use of such tools. Please exercise caution when using AI tools with personal, sensitive or confidential information. Any data you submit may be used for AI training or other purposes. There is no guarantee that information you provide will be kept secure or confidential. You should familiarize yourself with the privacy practices and terms of use of any generative AI tools prior to use.
Elastic, Elasticsearch, ESRE, Elasticsearch Relevance Engine and associated marks are trademarks, logos or registered trademarks of Elasticsearch N.V. in the United States and other countries. All other company and product names are trademarks, logos or registered trademarks of their respective owners.
Share
- Share on Twitter
Share on Twitter
- Share on LinkedIn
Share on LinkedIn
- Share on Facebook
Share on Facebook
- Share by Email
Share by email
- Print this page
Print

