Elastic Platform 8.15: Native vector database now supports bit vectors, SIMD acceleration, and simple config


 Share on Twitter
Share on Twitter

 Share on LinkedIn
Share on LinkedIn

 Share on Facebook
Share on Facebook

 Share by Email
Share by Email

 Print this page
Print
Elastic Platform 8.15: Elasticsearch native vector database now supports bit vectors, SIMD acceleration, and int4 quantization to improve performance. The new semantic_text field type makes it simple to configure semantic search, chunk incoming text, and generate embeddings at both index and query time. ES|QL has an expanded UI experience in Kibana Discover and several key new query and aggregation capabilities.
These new features and others allow customers to:
Use Elasticsearch as a vector database for semantic search more easily and with greater performance with expanded SIMD acceleration, int4 scalar quantization, and new support for bit vectors
Use our new Elasticsearch Query Language (ES|QL) inside Kibana Discover with an expanded set of aggregations and geospatial functionality
Better track dashboard creation and editing in Kibana
Try the preview of LogsDB — a new index-level option that wraps up and expands on our best practices for logs, dramatically reducing storage requirements and increasing leniency for handling common issues
Elastic Platform 8.15 is available now on Elastic Cloud — the only hosted Elasticsearch offering to include all of the new features in this latest release. You can also download the Elastic Stack and our cloud orchestration products, Elastic Cloud Enterprise and Elastic Cloud on Kubernetes, for a self-managed experience.
What else is new in Elastic 8.15? Check out the 8.15 announcement post to learn more >>
Vector search enhancements
Semantic_text: the solution to chunking in RAG applications
The most frequent use case for vector search is for relevance ranking of text. This typically involves using a machine learning model to generate vectors from the text in the documents and queries. Semantic text data type and query simplify this process by removing intermediate steps like configuring ingestion pipelines or selecting the appropriate query to use. All the user needs to do is to define an inference endpoint, and Elasticsearch will handle the generation of the vectors and the query itself.
semantic_text also handles long texts by performing automatic chunking per an Elastic aware machine learning model and generates multiple vectors for every document. It provides support for both dense vectors and sparse vector models. It is usable with models deployed with an Elastic machine learning (ML) node or with other providers like Cohere. Customers can continue to use their own chunking strategy or choose to simplify their application logic and rely on our out-of-the-box defaults to accelerate new search projects.
It is yet another step in making the use of machine learning for relevance ranking simple, so subject matter experts can focus on their use cases instead of on configuring their search tool and performing ML operations tasks. It is more than just cost or time to market that is gained here; the simplicity allows additional users to use it even if they do not have a machine learning team.
The power of semantic_text is amplified with an expanded catalog of third-party inference providers that can be used with our open inference API. New task types (completions, reranking, embeddings) and new model providers, such as Mistral AI, Amazon Bedrock, and more, give search developers unified access for model usage across a variety of applications.
For a deeper review of semantic_text, visit Elasticsearch new semantic_text mapping: Simplifying semantic search.
Hamming distance and bit vectors
Hamming distance measures vector similarity by counting the number of dimensions in which two vectors have different values. For example, the distance between [0,1,0,1,1] and [1,1,1,0,0] is four because these two vectors have different values in four of their dimensions. Quite a few models use Hamming distance to compare bit vectors. The benefit of that is that the vectors are rather small and that comparing bit vectors by Hamming distance is economic in terms of computer resources. Elasticsearch now supports indexing bit vectors (of up to 32,768 dimensions) and performing relevance ranking on them using Hamming distance.
It is also possible to rerank the top results by another algorithm. For example, users may get the results from Cohere in the form of float32 vectors and of bit vectors and can then perform an initial ranking by bit vectors and Hamming distance followed by reranking of the top 1,000 results by the float32 vectors.
Automatic quantization journey: Int4 brings 8x memory savings
The majority of users use models that output vectors with float32 elements. A float32 can hold billions of individual values, and that is for every dimension in the vector. It comes as no surprise that frequently the same ranking order can be obtained from vectors with a much smaller data type for each dimension, reducing the index size and improving performance. Previously in 8.12, we added scalar quantization to int8, and after multiple improvements and optimizations, we made it the default option in 8.14.
In 8.15 we are adding scalar quantization to int4, reducing the size of the vectors to an eighth (!) of its original size. We make int4 available both for HNSW (int4_hnsw index type) and for brute force search (int4_flat index type). The quantization to int4 also positively impacts performance, in particular query latency. The slight reduction in recall can often be completely compensated for either by slightly increasing the number of candidates that are being evaluated or by reranking (a combination of both is also an option). To read more about the tradeoffs of using int4, see Understanding Int4 scalar quantization in Lucene.
Optional k parameter in kNN query
When we introduced the kNN query, we set k automatically to simplify using it. It seems to have worked for most users, but some expert users requested that we allow manual configuration of k, so we now make it an optional parameter.
Transition between vector index options
Dense vector fields have an optional configuration that allows users to define how they will be indexed. We have made the field type updateable so that it is now possible to switch between the different options (hnsw to int8_hnsw, int8_flat to hnsw or to int8_hnsw, and flat to any of the other options).
Ludicrous speed: Optimizing CPU instructions for vector search
Vector search is a textbook example for the benefit of Single Instructions Multiple Data (SIMD) because the whole process of comparing two vectors to see how similar they are to each other is performed by comparing each of their dimensions in one form or another. So, the same operation is repeated on each of the dimensions and that for each of the candidate vectors. Performing the same instruction on multiple data is literally the acronym of SIMD, and the need to perform that on every candidate document makes the performance (and cost) impact so crucial. For a deeper explanation about that, see Vector similarity computations — ludicrous speed.
Since Elasticsearch 8.9, we’ve been taking advantage of SIMD to optimize the performance of vector comparisons. Now, we’ve built upon this to further improve scalar quantized vectors. The way that scalar quantization is performed in Elasticsearch (and Lucene) means that the resulting quantized vectors have certain properties that can be optimized by even more parallel SIMD instructions.
In 8.14, we released these new SIMD based optimizations to improve the performance of vector comparison, but we enabled it only for merging index segments and only on ARM. Elasticsearch constantly generates new segments as documents are added or modified in the index and then merges them into larger and larger segments. Making this process more efficient released computing resources and optimized segment size, which indirectly improves query latency, but it did not directly influence vector comparison during query execution.
We now introduce the SIMD optimization for query time as well and expand the set of platforms to include both x64 and ARM. With these optimizations, we see improved query latency times across the board. For example, on ARM with the StackOverflow data set (2 million vectors of 768 dimensions), we see an X2 improvement in kNN search query latency. Our approach to adding support for these capabilities is a primary reason our vector database has continued to see a 8x performance improvement with a 32x efficiency increase over the last few releases. Even better, it is unique to Elastic’s implementation of Lucene and outperforms others out of the box.
Geospatial search with ES|QL
Elasticsearch has had powerful geospatial search and analytics capabilities for many years, but the API was quite different to what typical GIS users were used to. Over the past year, we’ve added the ES|QL, a piped query language. Now, we’re adding support for geospatial search and analytics within ES|QL.
Elasticsearch 8.12 and 8.13 brought basic support for geospatial types to ES|QL. This was enhanced with the addition of geospatial search capabilities in 8.14. Now in 8.15, we’ve added the highly sought-after function ST_DISTANCE, enabling higher performance distance search. More importantly, this support was designed to conform closely to the OGC standards used by many GIS tools, making this far easier to use for GIS experts familiar with SQL standards for spatial data. Note that all geospatial features in ES|QL are in technical preview, and some use cases are not yet optimized like sorting by distance. This will improve with each release, and we welcome feedback. For more information, check out the following geospatial search with ES|QL blog.
Even more functions and aggregations in ES|QL
In addition to the geo ST_DISTANCE described above, Elastic 8.15 continues to expand the usefulness of ES|QL by adding more functions and aggregations, including:
MV_APPEND: Append two values creating a single multi-value
REPEAT: Return a string concatenated to itself N times
IP_PREFIX: Return the prefix of an IP
CBRT: Cube root math function
top agg: Collect Top N values per bucket
- Weighted_avg agg (technical preview): Calculate the weighted average of a numeric expression
ES|QL handles field type mismatches with union types support
With ES|QL you can query across multiple indices or data streams, but what if they contain a field that is mapped differently? For example, an IP address field “client_ip” could be mapped as a keyword in one index and as IP in another index. Normally an ES|QL query across these indices would return null values for the client_ip since the type is a union of the different types in the various indices. Attempts to use this field with functions would result in an error.
Elasticsearch 8.15 makes it possible to work with mismatched field types. When you encounter one of these fields, use our type conversion functions, such as TO_IP to convert the field to a single type:
FROM events_*
| EVAL client_ip = TO_IP(client_ip)
or use the :: type conversion syntax:
FROM events_*
| EVAL client_ip = client_ip::ip
The union types support is in technical preview in 8.15.
Inject named variables into your ES|QL query
ES|QL has support for unnamed positional parameters (?1, ?2, etc.). In 8.15, named parameters now allow users to insert named variables into queries, which is especially useful for dynamic queries in dashboards, such as applying a time range filter. We plan to use named parameters in Kibana to link UI elements like the timepicker or custom controls directly to query parameters, improving user interaction and query management. You can also use them in your own queries:
POST /_query
{
 "query": """
  FROM library
  | EVAL year = DATE_EXTRACT("year", release_date)
  | WHERE page_count > ?page_count AND author == ?author
  | STATS count = COUNT(*) by year
  | WHERE count > ?count
  | LIMIT 5
 """,
 "params": [{"page_count" : 300}, {"author" : "Frank Herbert"}, {“count” : 0}]
}
One benefit of named parameters over positional parameters is the ability to reuse a parameter multiple times in the same query.
Introducing LogsDB index mode: You know, for logs
We want to remain the best platform for logs, so we’re making improvements to logs storage efficiency as well as increasing the chances that your logs get stored even in the event of common issues like mapping conflicts or pipeline errors. To make it easy to enable the relevant features and settings, we wrapped this in a new LogsDB index mode for logs data streams, which is out in technical preview in 8.15. This is similar to the time_series (TSDS) index mode, which optimizes an index for metrics.
Building on learnings from those optimizations for metrics time series data storage, LogsDB mode goes further to make storage for logs more efficient — our benchmarks show a 2x–3x storage reduction with possibly more in the future.
LogsDB mode uses smart index sorting, synthetic source, and smarter doc values compression to reduce the disk footprint of log data.
Index sorting: By default LogsDB indices are sorted by host.name and @timestamp fields at index time, enabling compression to be more efficient by placing similar data close together on disk. This can be overridden using existing index sort settings if your data has other fields that would be more optimal for run-length encoding.
Synthetic _source: Save space by not storing the _source field. We’ll reconstruct it on the fly if it is requested. To be able to apply synthetic _source to all log data, we made many improvements to synthetic _source like adding support for many more field types.
We’re also working on ways to make log ingest more reliable with LogsDB mode in a future release by enabling several index settings that increase the leniency toward issues with incoming documents.
Note that LogsDB mode is still in technical preview and therefore is not yet ready for production usage.
Control the usage of scripted metrics
Scripted metrics aggregations can be a powerful tool to create custom analytics not included out of the box. However, this comes with the risk of introducing performance problems as scripted metrics aggregations can use a lot of Java heap memory.
Over time, many scripted metrics use cases can probably be migrated to ES|QL. In the meantime, if you would like to restrict users from running some or all scripted metrics aggregations, Elasticsearch 8.15 adds new settings:
search.aggs.only_allowed_metric_scripts: Whether only explicitly allowed scripts can be used
search.aggs.allowed_inline_metric_scripts: List of inline scripts that are allowed
search.aggs.allowed_stored_metric_scripts: List of stored scripts that are allowed
By using the above, you can prevent users from running particularly slow or resource-intensive scripted aggregation queries, as only preapproved scripts will be allowed.
Kibana Dashboards and Discover enhancements
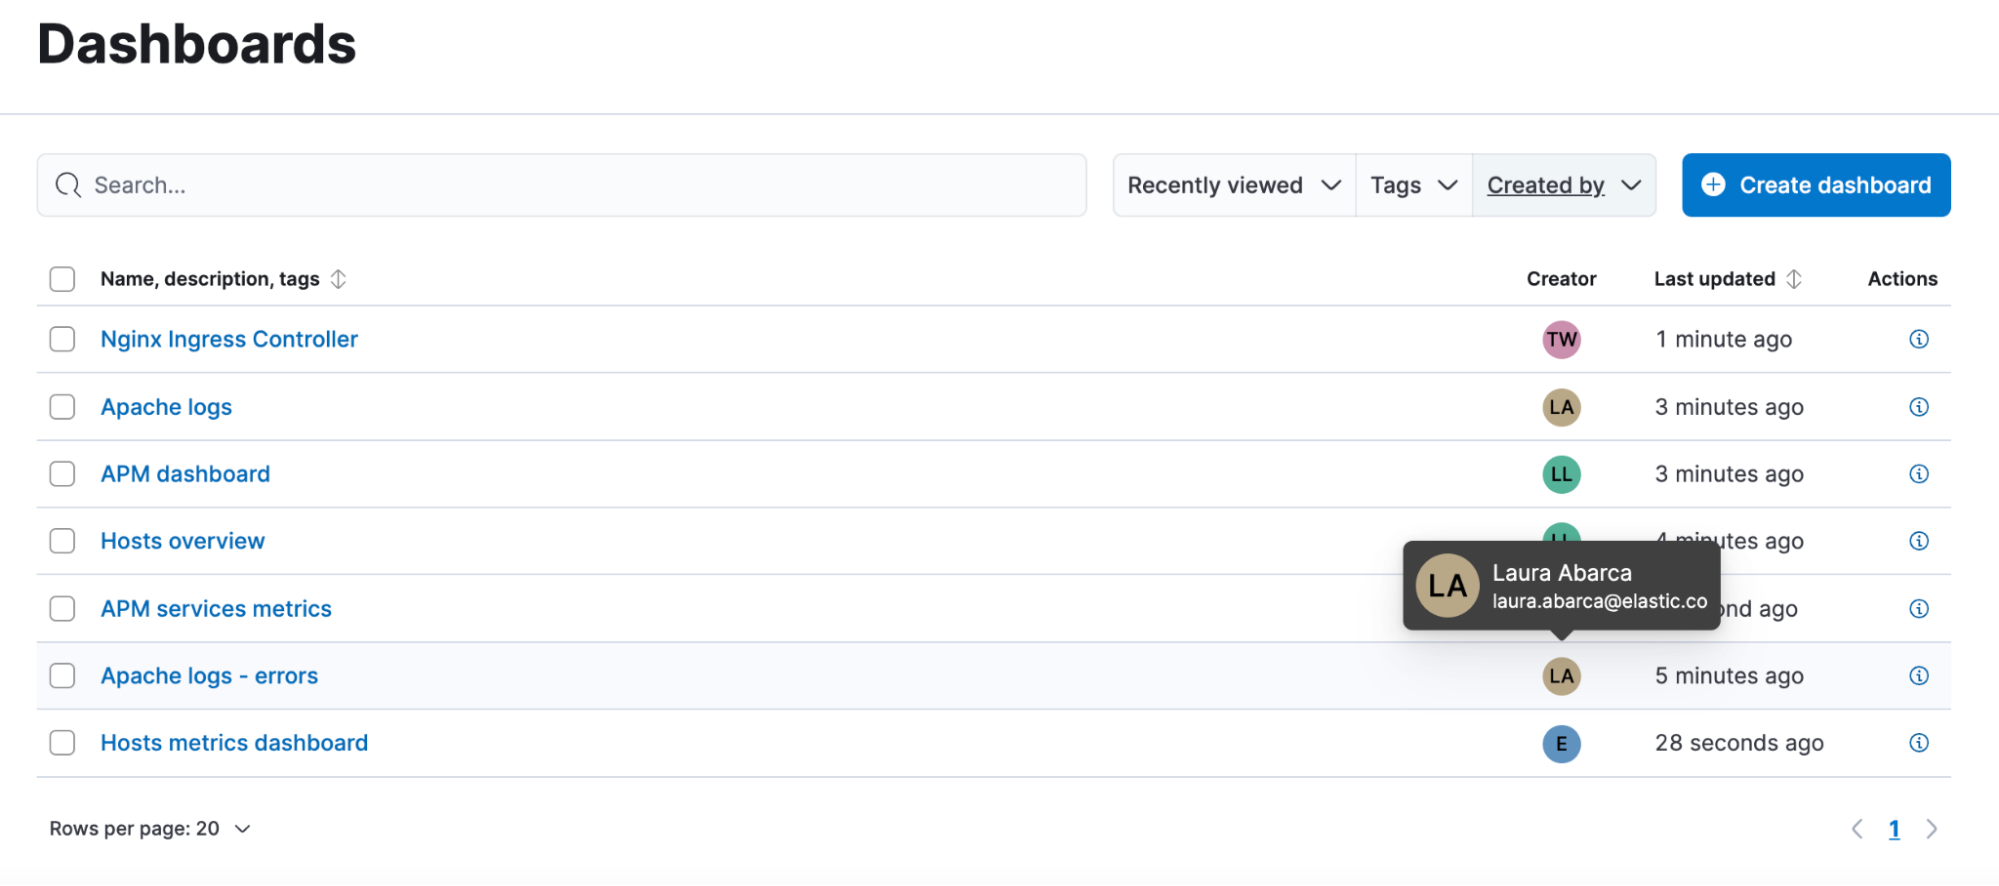
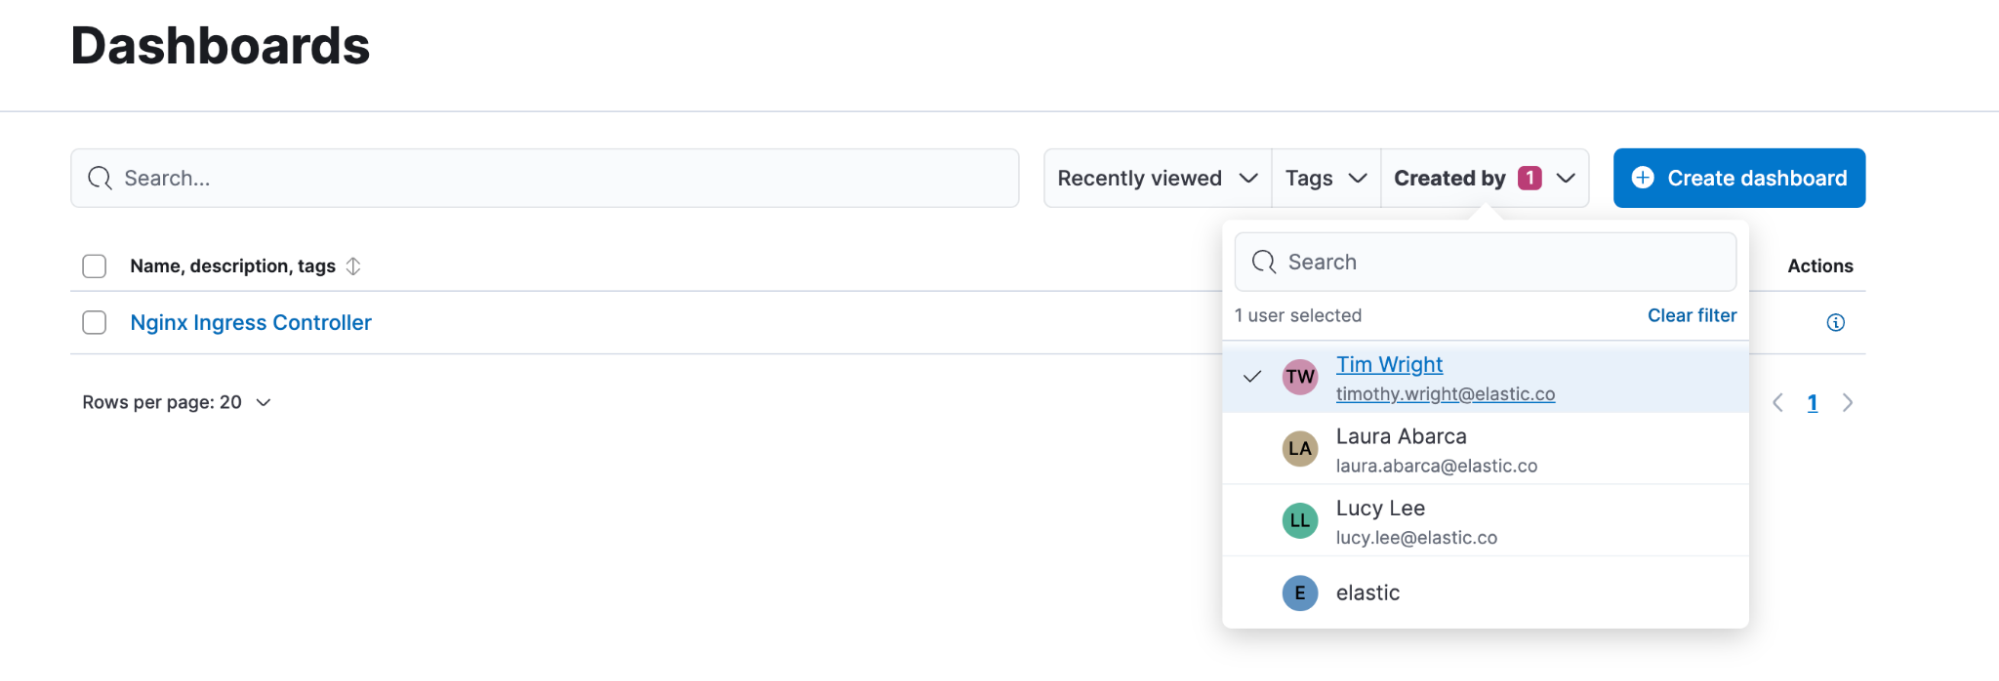
Dashboard creator and editor
Now, you can see who created a dashboard and who last updated a dashboard.
You can see the creator information in the dashboard listing page and you can filter by it. Note that the creator will be added to any dashboard created after version 8.14. For dashboards created in previous versions, the creator will be empty.
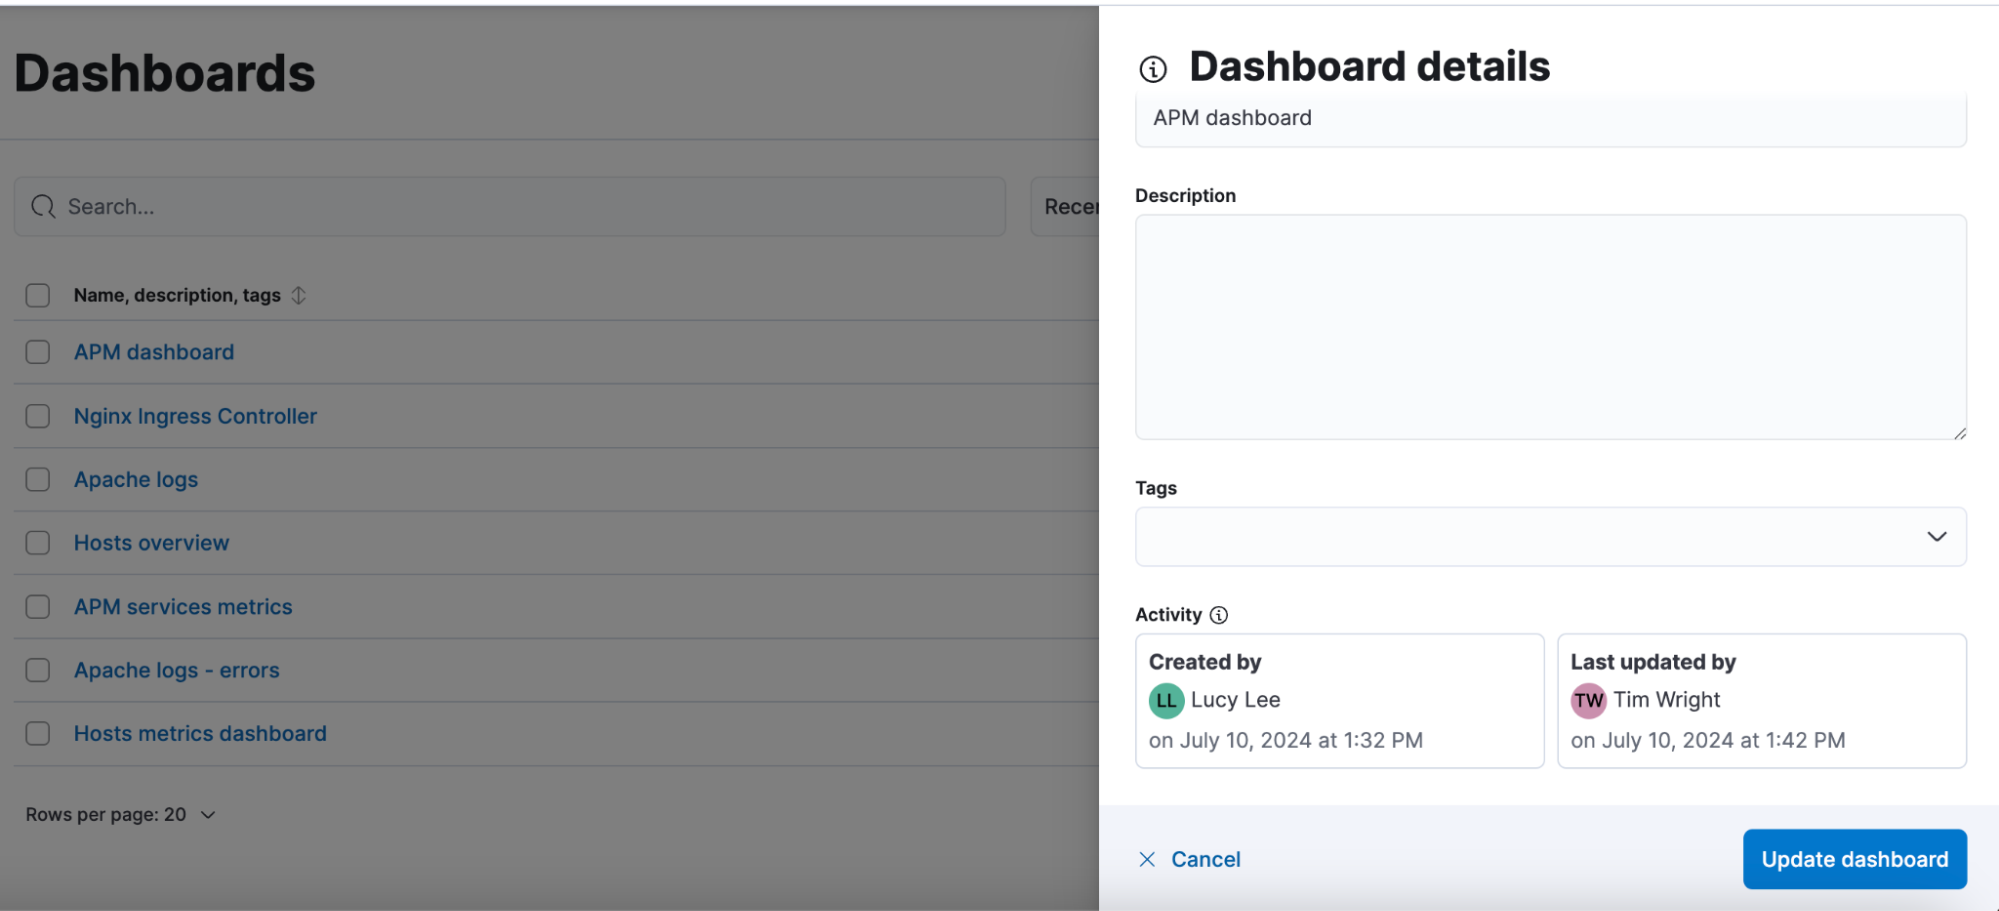
You can see who last updated a dashboard by clicking on the dashboard info icon from the listing page. You will also see the creator information there. This information is immutable and cannot be changed.
Field statistic in dashboards
Now, it’s easier than ever to include your field statistics view from Discover into Dashboards. While running investigations, it’s very common that you need to see some field information, such as unique values and the distribution to make sense of the data. Select the fields that you want with your ES|QL query and get the document count, values, and distribution in your dashboard, so you don’t have to navigate back and forth to Discover to see this information.

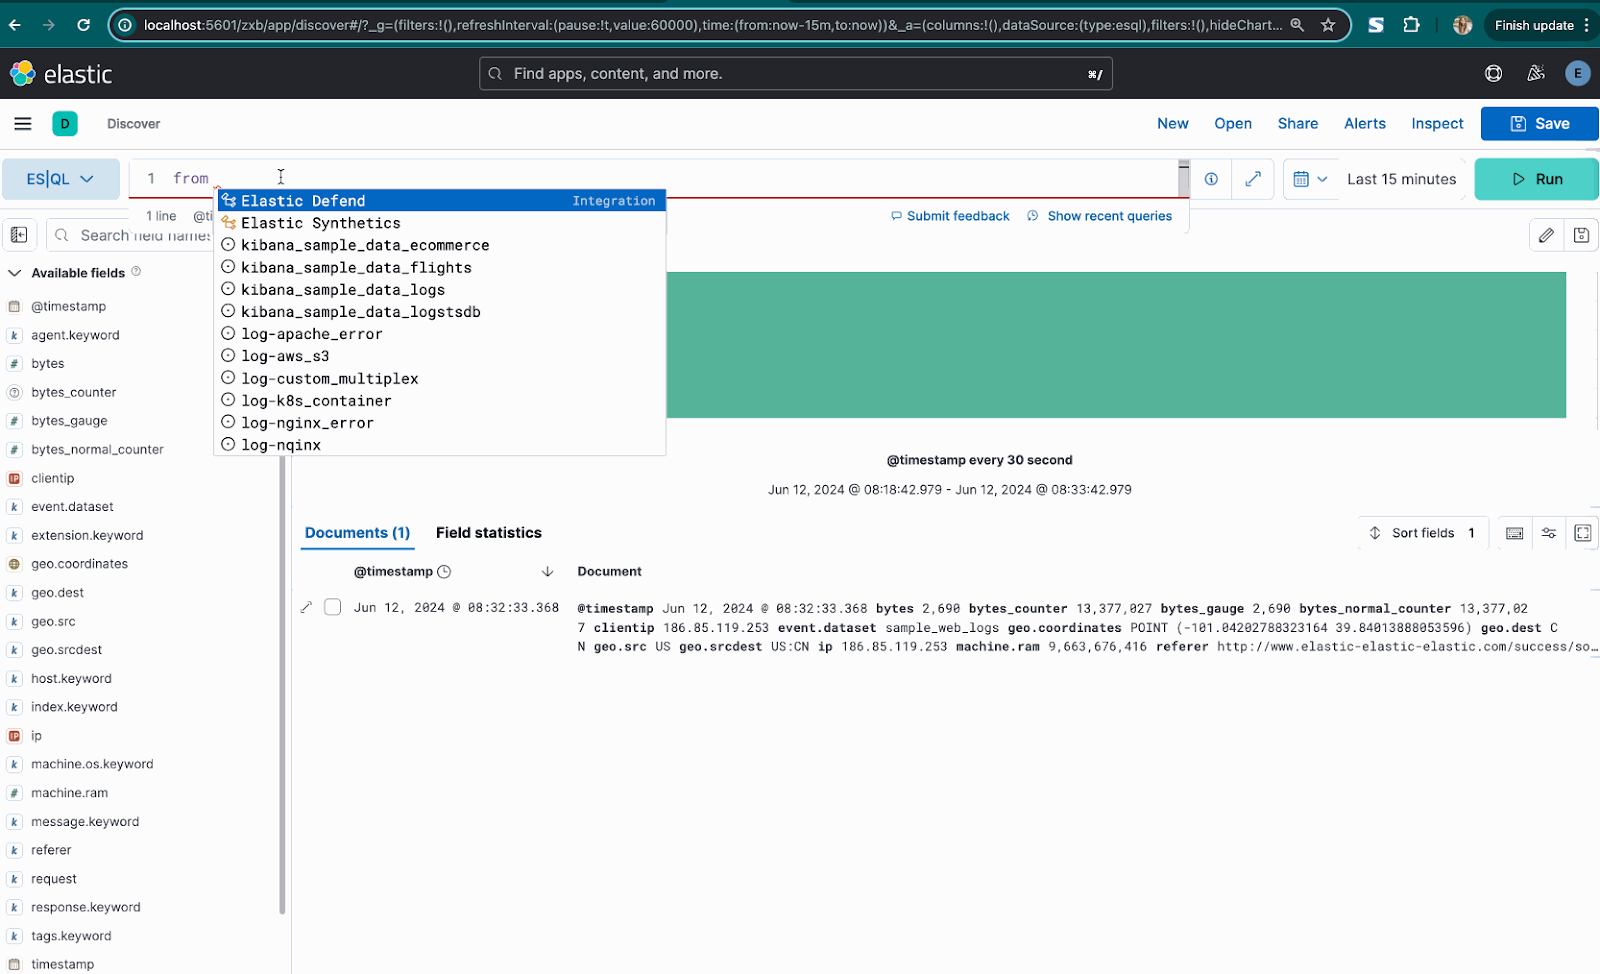
Integrations support in the ES|QL editor when using FROM command
We're excited to announce enhanced support for integrations in the ES|QL editor with the FROM command. Previously, users could only access indices, but now you can also view a list of installed integrations directly within the editor. This improvement streamlines your workflow, making it easier to manage and use various integrations while working with your data.
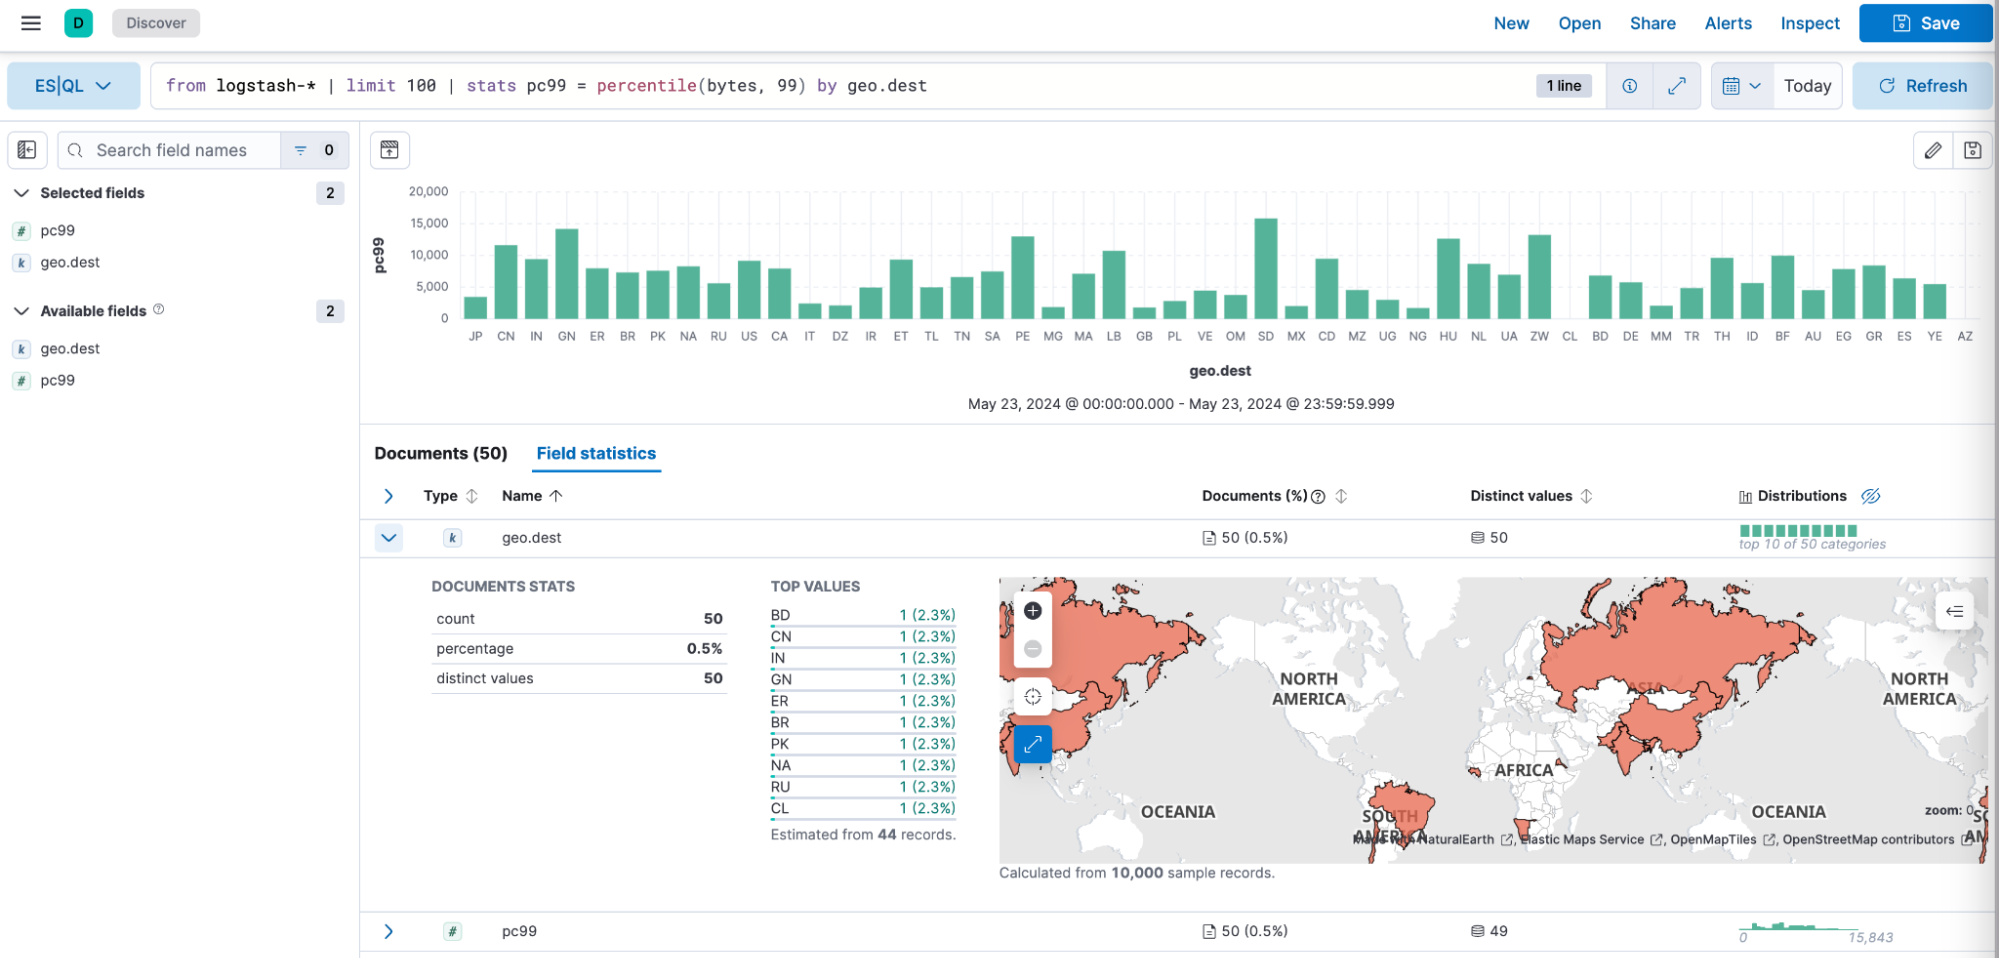
Field statistics in ES|QL
We're excited to introduce field statistics in ES|QL — a feature designed to provide comprehensive insights for each data field. With this enhancement, you can access detailed statistics, such as distributions, averages, and other key metrics, helping you quickly understand your data. This makes data exploration and quality assessment more efficient, providing deeper insights and streamlining the analysis of field-level data in ES|QL.
Logstash Elastic Agent-based monitoring is GA
After a successful technical preview in which customer feedback was overwhelmingly positive, Elastic Agent-based monitoring is now generally available and recommended to all users. New dashboards make it easy to understand how Logstash is functioning on an individual pipeline or plugin basis and include advanced metrics like throughput and worker utilization. Using Elastic Agents allows us to continually improve the Logstash monitoring experience and takes the guesswork out of Logstash administration.
Cross-cluster search enhancements
Users can see partial results with cross-cluster search even if one of the clusters doesn’t respond
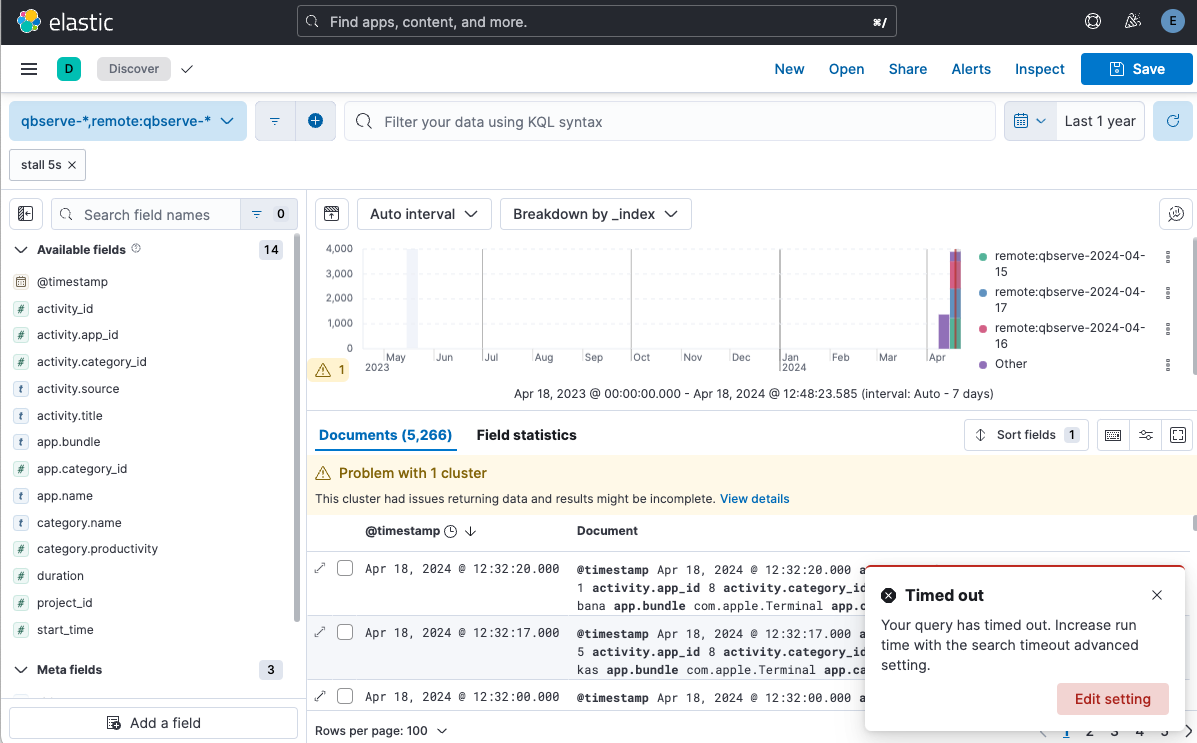
In Elastic 8.15, users are now empowered to continue their data exploration even when all clusters haven't responded within the Kibana search timeout timeframe (defaults to 10 minutes). When the timeout is reached, Kibana Discover and Dashboards will intelligently present the user with the partial results that have been received so far. This ensures that the insights from responsive clusters are not held back by the few that are slower to return data.
To ensure clarity and awareness, Kibana will show a distinct warning indicator when partial results are shown. This highlights to users that they are viewing an incomplete data set due to the search timeout being reached.
Users can then identify which clusters have contributed to the results and which have not by using the Clusters and shards tab of the Inspector.
Remote cluster status in stack management is more accurate
For administrators managing multiple remote clusters as part of CCS, having accurate and up-to-date information on the connection status of these clusters is crucial. It informs them about the potential end-user experience and aids in maintenance. With the 8.15 update, CCS now leverages the resolve cluster API to provide real-time status updates on remote clusters within the "Stack Management > Remote Clusters" section in Kibana. This ensures that administrators have the most current view of their cluster landscape, allowing for a more efficient management of the CCS environment.
Try it out
Read about these capabilities and more in the release notes.
Existing Elastic Cloud customers can access many of these features directly from the Elastic Cloud console. Not taking advantage of Elastic on cloud? Start a free trial.
The release and timing of any features or functionality described in this post remain at Elastic's sole discretion. Any features or functionality not currently available may not be delivered on time or at all.
Share
- Share on Twitter
Share on Twitter
- Share on LinkedIn
Share on LinkedIn
- Share on Facebook
Share on Facebook
- Share by Email
Share by Email
- Print this page
Print