Elasticsearch, Kibana, Elastic Cloud 8.2: Boost insights with data exploration in Discover

In 8.2, accelerate time to insights with an updated document explorer, in the Discover app in Kibana. Quickly and easily evaluate data fields and distributions, and slice and dice data subsets. Elasticsearch delivers speed, scale, relevance, and simplicity with enhancements to vector search, the new random sampler aggregation, and more.
In addition, Elastic Cloud has achieved Payment Card Industry Data Security Standard (PCI DSS) Certification as a Level 1 Service Provider so you can ensure the security and safety of your payment data.
Ready to dive in and get started? We have the links you need:
- Try the new features on Elastic Cloud
- Download the latest versions of Elasticsearch, Kibana, Elastic Cloud on Kubernetes
- Refer to the release notes: Elasticsearch, Kibana, Elastic Cloud, Elastic Cloud on Kubernetes
- See other Elastic 8.2 highlights in the Elastic 8.2 announcement post
- See Elasticsearch breaking changes and Kibana docs on what's new in 8.2
- See the latest regions available in Elastic Cloud.
Top news from Elastic Stack and Cloud
Analyze your data in Discover for faster time to insights
Move quickly from ingest to analysis with Discover’s data exploration tools. Understand your data at a bird’s eye view — or zoom in on specific sections to find anomalies and troubleshoot issues in Kibana. For any use case, propel your investigation forward with deeper knowledge of your data — when investigating security threats, minimize mean time to detect and respond with new ways to examine environmental activity and context.
With new Discover features, field statistics and document explorer, you can jumpstart your analysis by assessing all of your fields and documents at once.
- With field statistics (beta), look for completeness of your data, spot outliers, understand the distribution of values, and gain a holistic view
- As an updated and easily-configurable documents table, document explorer fits more of your data on the screen and provides the flexibility to change your view by adding relevant columns, sorting by fields, and highlighting search values.
Uncover markers of newly discovered exploits with ad-hoc searches. Dive into a subset of erroneous transactions to examine its impact on overall service performance. With new exploration options in Discover, you can quickly determine the scope and root cause of an incident and explore further with visualizations and dashboards or respond rapidly in the Security and Observability app.

Go Fast button for your aggregations
Data is not getting any smaller and the demand for aggregating information quickly across large and dense data sets is growing. And aggregating data is critical for threat detection and visualizing observability trends, but what if you just want a quick overview visualization to help look at the big picture without searching billions of documents?
With the new random sampler aggregation, in technical preview, developers can exponentially accelerate their aggregations for calculations, with a slight trade off in accuracy, by randomly sampling documents in a statistically robust manner.
How fast is fast? With an APM data set with 63 million documents, we were able to see up to 80X performance improvement on our count aggregation! The speed depends on a few factors like volume or data density and probability, but these are within your control.
The random sampler utilizes a probability parameter and a seed variable allowing you to customize the speed and accuracy based on the volume and density of your data. This gives you the control and flexibility of the speed and accuracy.
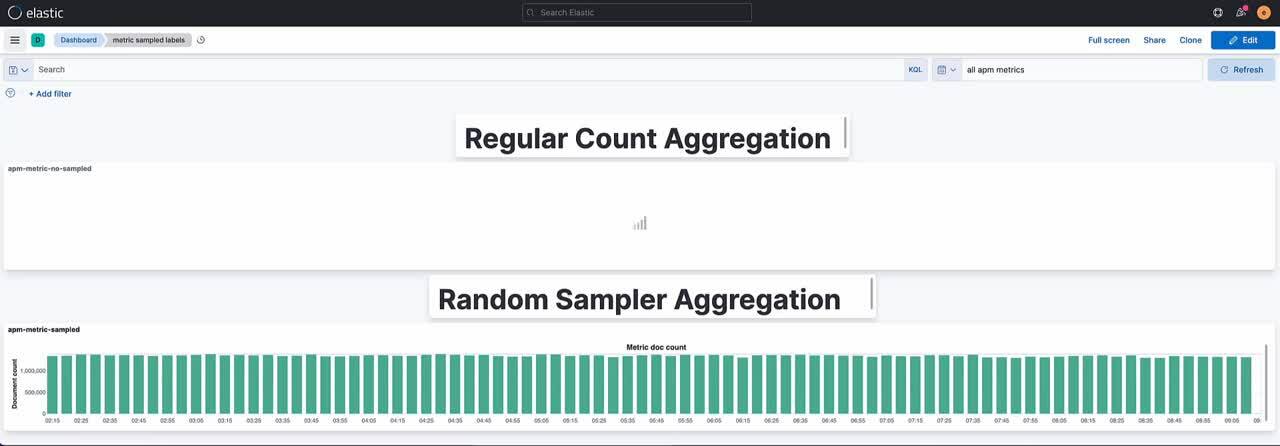
Another benefit of randomly sampling documents is the reduced computational overhead regardless of the number of documents being searched. This provides an even greater scale of data to search within Elasticsearch.
The random sampler aggregation can be used to accelerate any application that utilizes aggregations for calculations.
To learn more about random sampler aggregation including uncovering how sampling works, best practices, and ensuring performance reliability check out the Random Sampling in Elasticsearch blog.
Hail to the vectors
Vector search - the technology powering the newest breed of search experiences such as image search, generative question answering and semantic search - continues on its fast-evolving journey with the addition of native filtering functionality.
Until now the HNSW implementation in Lucene supported only a hierarchy of two layers of the graph. In Lucene 9.1 we added the ability to have multiple layers in the hierarchy, and we are using this in Elasticsearch 8.2. The immediate benefits are improved and more stable query latency, as can be seen in the Lucene benchmarks.
In 8.2, ANN filtering capability, now in tech preview, provides more effective ways to query data without configuration. Filters in Elasticsearch helped narrow the results from a search by applying conditions in the query string. With support for combining ANN with filters you can ask “What are the most similar documents that also satisfy this query?”.
With HNSW algorithm, Elasticsearch will automatically determine the best approach to ANN by switching between filtering HNSW or taking a brute force approach. The determining factor is the size of the filtered data result sets. Small data sets are easily filtered with brute force as it compares all data points. For larger datasets filtering HNSW is more optimal as it traverses quicker to find similar vectors.
Use PCI certification for compliance
In 8.2, Elastic Cloud has achieved Payment Card Industry Data Security Standard (PCI DSS) Certification as a Level 1 Service Provider. You will now benefit from security controls to process, handle, or store payment card information. Learn more in our blog.
Simplify security, optimize costs, and more
Simplify your authentication and authorization, choose new hardware types in Elastic Cloud, or easily migrate your current deployment(s) to lower-cost instance types with these 8.2 features.
Drop it like it’s JWT
In 8.2, we are introducing a new way to authorize and authenticate Elasticsearch’s API calls using JSON Web Tokens (JWT) now in beta.
Encapsulating the user's claims in a JWT avoids the need for each service to connect to a central identity store. The use of JWT also provides security between the layers, reduces the extent to which each service must trust the caller, and eliminates the need to create bridges to perform conversions from JWT to other forms like API keys, or to authenticate against Kibana before using Elasticsearch API.
If you already have a system that is interacting via OIDC you can integrate your cluster and perform direct calls to the Elasticsearch API.
Leverage new Microsoft Azure instance types
Take advantage of additional virtual machine (VM) types when you deploy Elastic on Microsoft Azure. You can now select hardware profiles backed by Edsv4, Ddv4, and Fsv2 series VMs. Leverage additional combinations of compute, memory, and disk to help ensure the optimal resource configuration for your use case–that’s up to 70% more cost effective compared to previous generations.
It’s easy to get started. From the Elastic console you can create a deployment, or migrate an existing deployment using the new hardware profiles. Learn more in the Optimize performance and cost with new virtual machine types on Elastic Cloud blog.
Unmatched flexibility with lookup runtime field
Lookup runtime fields, now in technical preview, offer the flexibility to enrich data at query time by defining a key on separate indices that links documents together. This capability allows you to define a “lookup index” for data that frequently changes or gives you the choice of when to update the “search index” with the additional data.
Lookup runtime fields deliver exciting new ad-hoc analysis possibilities where disparate data lives in different indices. Combine data that is constantly changing like weather, metrics, APM, and security data with static data like usernames, DNS records, or business intelligence for a new level of analysis.
Enhanced observability and alerting with xMatters
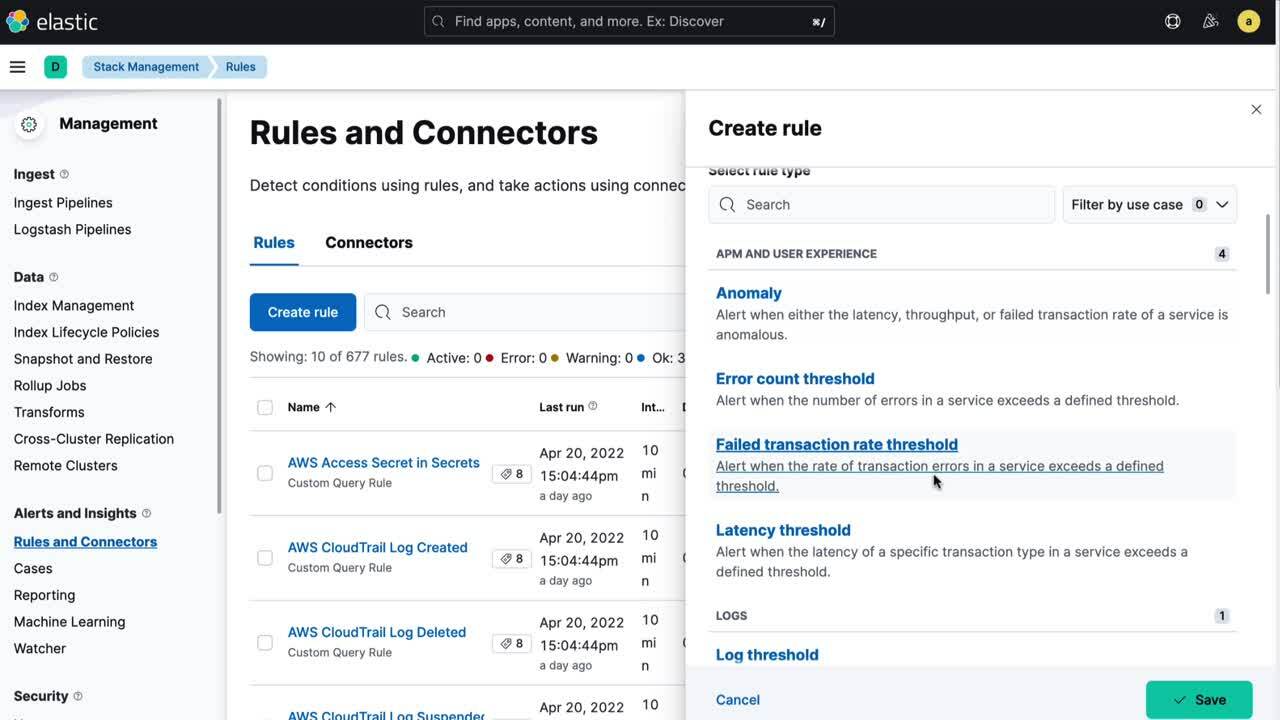
New alerting features in 8.2 build upon our vision for alerting in Kibana allowing you to drive awareness and action in your workflows, and more efficiently identify critical alerts. Elastic has partnered with xMatters in bringing a community-developed connector to joint users — create associated incidents in the xMatters’s automated incident management platform with all the context needed for the correct teams to engage and respond quickly. Check out more alerting enhancements in Kibana docs for 8.2 features.
Bonjour to a new French translation for Elastic
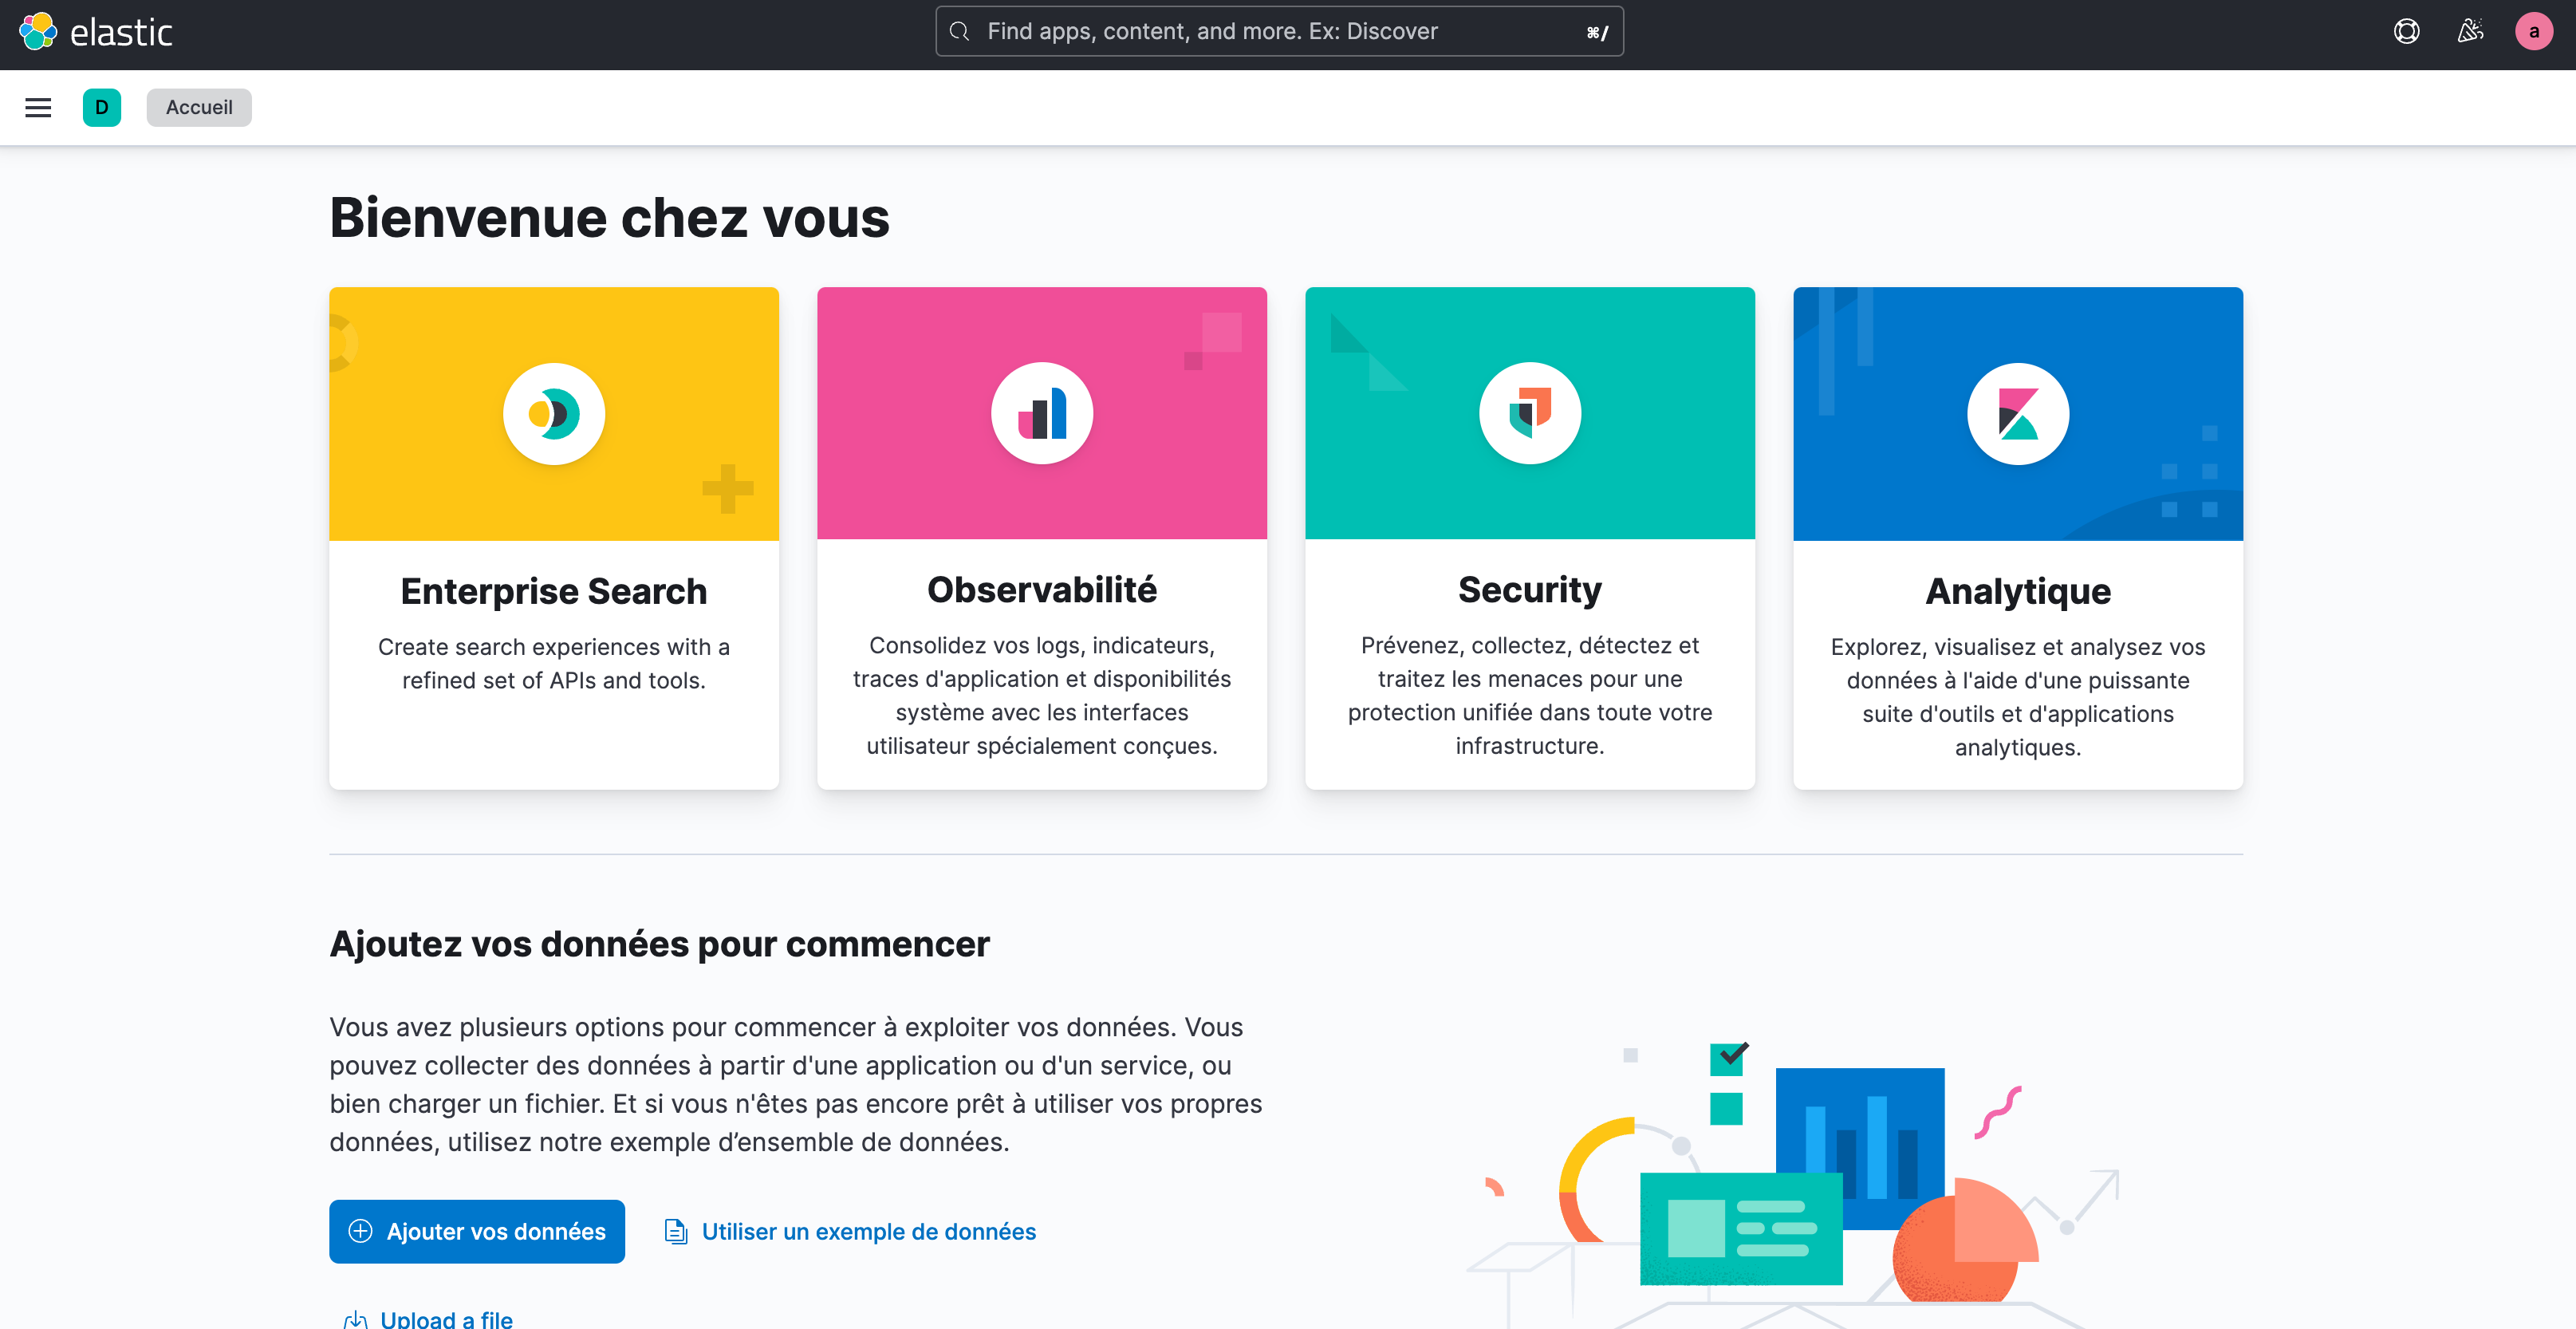
French-speaking users can now use a localized French UI (beta) in Kibana for Elastic’s solutions and apps.
Wait…there’s more
8.2 is packed with so many features we couldn’t fit them all in this blog. Be sure to check out the release notes for more news on Elasticsearch, Kibana, and Elastic Cloud.
Try it out
Existing Elastic Cloud customers can access these features from the Elastic Cloud console, and check out the Quick Start guides. You can get started with a free 14-day trial of Elastic Cloud or download the free self-managed version.
The release and timing of any features or functionality described in this post remain at Elastic's sole discretion. Any features or functionality not currently available may not be delivered on time or at all.