Maintaining Excellence in Commercial Performance
Automatic Detection of Intrusions
By indexing server activity, Elastic enables the detection of spy robots and cyber-attacks and automatically triggers counter-measures.
IT Incidents Resolved in a Matter of Minutes
It used to take hours to search through dozens of servers whenever incidents occurred. Now we simply use dashboards that provide a summary of server logs.
A Promotion for the Technical Team
Company Overview
As the number one French online tourism site, and even the first e-commerce site in France, Oui.SNCF is the expert distribution channel for French railways. The SNCF subsidiary reached a turnover of 4.1 million in 2016 thanks to the annual sale of 86 million tickets, with up to 40 tickets sold per second during peak times. Receiving on average 13 million individual visitors per month, 63% of these visitors access the company’s services through mobile devices. Its V. application has been downloaded 15 million times, and a third of its transactions are completed via the app. In IT terms, Oui.SNCF's business is supported by 4,000 servers, split between two data centers, under the aegis of the Oui.SNCF branch, which is responsible for the technical management. These servers are teeming with potential indicators for the improvement of sales and business services.
Visualizing Data to Enhance Sub-Department Efficiency
Oui.SNCF currently utilizes 400 dashboards, some of which are permanently displayed on wall screens in order to monitor its business activity in real time. This improvement has been made possible thanks not only to the indexing of data lifted from the company site and mobile app by the Elastic Stack, but also to Kibana's dashboard creation facility. This has enabled sub-departments to maximize the performance of their services.
Oui.SNCF's Experience with Elastic
Dominique Debruyne is in charge of the Big Data technical arm at Oui.SNCF-Technologies. His current objective is to build a technical platform for sending, storing, archiving, processing, and restoring a maximum number of internal and external data sources in order to gain a better understanding of the company's customers, conduct predictive analyses, and to monitor the performance of information systems in real time. However, these are relatively new tasks. With Oui SNCF-Technologies in charge of the development, hosting, and deployment of IT tools to respond to sub-department needs, Dominique Debruyne's initial objective was in fact to guarantee the QoS and SLAs of structured data stored in relational databases.
To simplify performance monitoring, which was becoming ever more complex due to the increasing number of information systems and applications, we centralized our servers' logs in a data lake, from which we were then able to derive specific indicators. This system quickly proved hugely valuable for the technical team, and it was quite obvious that it would make sense to further extend it to meet the needs of the sub-departments as well and to get even more value out of it. And that's how the Big Data team was born, two and a half years ago.
Oui.sncf’s Journey with Elastic
The Challenge: Maintaining a High Quality of Service Despite Increased IT Complexity
At Oui.sncf, an increase in servers from 2013 onward had a negative impact on the efficiency of both the technical teams as well as the sub-departments. The technical teams were losing time downloading logs on their Windows desktops in order to monitor the proper functioning of material. Meanwhile, the sub-departments were suffering with requests that would slow down the system when attempting to analyze their commercial data within what was by now a sprawling Oracle base.
In very little time at all, we'd gone from several dozen servers to several thousand! In the early days, the moment a customer raised an anomaly with us, we needed to go and search for their processes within a very large quantity of logs in order to identify exactly where the problem was. This took us time, and posed a risk to the quality of our service level.
The Solution: Collect Data, Index It, and Visualize It via Dashboards
We took part in technical conferences to find a solution that would enable the restoration, analysis, and intuitive visualization of data in real time. The decision to use Elasticsearch was agreed across the board. We saw several advantages to it: the fact that it is one unique platform rather than diverse tools, that it can withstand the majority of different usage scenarios, that it is scalable to the point that you simply need to roll out the infrastructure twice for it to double its capacity on its own, and, ultimately, that it was very simple to maintain.
Deployment: Allow Each Sub-Department to Find its Own Points of Interest
The Elastic platform enables sub-departments to interact with events that are currently unfolding, to compare them to events from the days leading up to them in order to track their progression. At the same time, this data is stored in Hadoop for three years, for long-term Business Intelligence purposes. The analysis in Hadoop functions per batch, while Elasticsearch helps us do it in real time.
Since 2017, the architecture has been enriched with Apache Kafka, which allows peak loads to be absorbed and prevents any slowdowns in Oui.sncf's activity. Ingestion of the data itself is currently entrusted to Flume, an Apache Foundation open-source project. As this declines in popularity, it should soon be replaced with NiFi, its Apache successor. The architecture has been designed to facilitate predictive analysis functionalities and anomaly detection, with the latter made possible thanks to the Elastic machine learning function available within X-Pack.

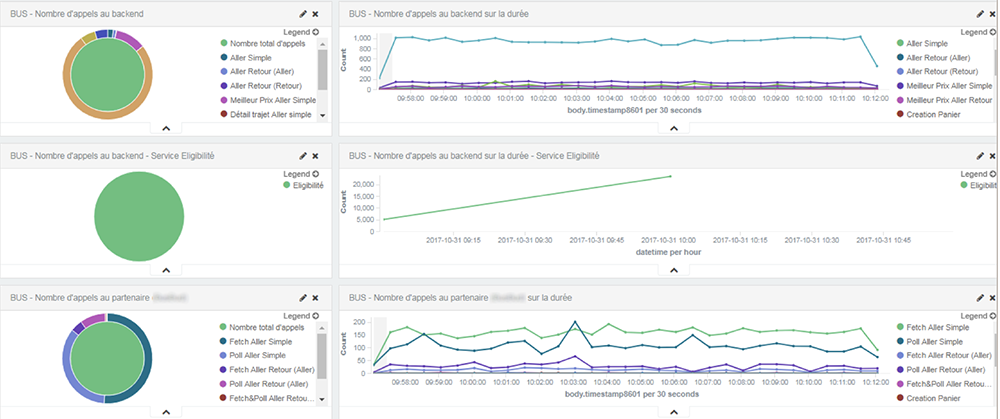
Fig. 1: Visualisation showing the amount and type of requests on the web services exposed to multiple applications
Regarding the dashboards, the greatest effort doesn't take place in Kibana, but beforehand. We first needed to normalize the data: in other words, develop log templates that included all of the technical and departmental information we wanted to trace, so that our dashboards were based on coherent data that could easily be cross-checked. To do this, we worked with a dedicated team for a year to produce Java, PHP or Python libraries for our applications developers which would produce normalized logs in accordance with a dozen templates, before being indexed by Elasticsearch. We are pleased to have undertaken this professional type of approach.
The Results: 50 Projects Supervised by 400 Dashboards and a Security System that Works on its Own
To date, Kibana is being used for more than 50 projects, through 400 dashboards handling 2 billion documents per day. Of these, 200 dashboards are used daily to monitor that service remains at the maximum level, to find areas for improvement, and to have as clear an idea as possible on activity.
Oui.sncf installed wall screens for the display of Kibana dashboards within each of their services, enabling employees to continually follow the course of events of interest to them. This is a visual, color-coded check: if all indicators are green, all is well. If we see that the curves are starting to drift, we head to our workstations to open up interactive tables that will help us check for problems.

Fig. 2: Kibana and Grafana wall screens
We use information indexed by Elasticsearch to, for example, identify any robots scanning our sites, in order to block them at the firewall level. Almost half of our web traffic comes from the activity of these robots. So, by dividing the number of visits in two, we have lightened the network load, and in the end, this helps us to make savings. In the same way, we are able to detect anomalies in our load balancers and can automatically trigger preventative actions to prevent us from succumbing to denial of service attacks.

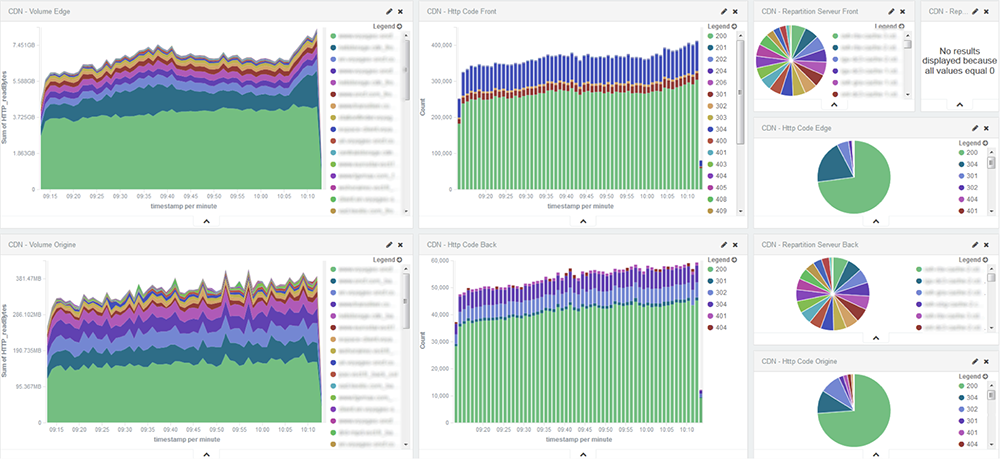
Fig. 3: This dashboard allows us to visualize in real time the amount and type of HTTP responses per application, server or per client on our CDN
The visibility the Elastic Stack gives us has formed an essential element of Oui.sncf's commercial success.
The Oui.sncf’s Clusters
- Clusters10
- Indexes> 3,000
- Nodes40
- Query Rate400,000 with batches
- Hosting EnvironmentFrom assembly to production
- Replicas1
- Documents80 billion
- Time-based IndicesDaily, weekly and monthly
- Total Data Size80 TB
- Node Specifications64 GB - 128 GB, local storage
- Daily Ingest Rate2 TB

