Elastic Observability 8.16: Enhanced OpenTelemetry support, advanced log analytics, and streamlined onboarding

Elastic Observability 8.16 announces several key capabilities:
Amazon Bedrock integration for LLM observability adds comprehensive monitoring capabilities for LLM applications built on Amazon Bedrock. This new integration provides out-of-the-box dashboards and detailed insights into model performance, usage patterns, and costs — enabling SREs and developers to effectively monitor and optimize their generative AI (GenAI) applications built on Amazon Bedrock in addition to existing support for applications that use Azure OpenAI.
Unified Kubernetes observability with Elastic Distributions of OpenTelemetry (EDOT) delivers automated deployment and configuration of OpenTelemetry collectors through the OpenTelemetry Operator. This streamlined approach includes zero-code instrumentation options and preconfigured dashboards, allowing organizations to quickly gain comprehensive visibility into their Kubernetes environments without manual setup.
Enhanced log analytics and streamlined onboarding introduce a context-aware Discover experience and new quickstart onboarding workflows. The improved Discover interface automatically adjusts data presentation based on content type, while the new onboarding workflows simplify the setup process for host monitoring, Kubernetes monitoring, and the Amazon Firehose delivery stream.
Elastic Observability 8.16 is available now on Elastic Cloud — the only hosted Elasticsearch offering to include all of the new features in this latest release. You can also download the Elastic Stack and our cloud orchestration products — Elastic Cloud Enterprise and Elastic Cloud for Kubernetes — for a self-managed experience.
What else is new in Elastic 8.16? Check out the 8.16 announcement post to learn more >>
Amazon Bedrock integration for LLM observability
As LLM-based applications continue to grow, it's essential for SREs and developers to monitor both the performance and cost of these GenAI applications.
Our new Amazon Bedrock integration (technical preview) for Elastic Observability provides comprehensive insights into Amazon Bedrock LLM performance and usage with an out-of-the-box experience that simplifies the collection of Amazon Bedrock metrics and logs, making it easier to gain actionable insights and efficiently manage models. This integration is straightforward to set up and includes prebuilt dashboards. With these capabilities, SREs can now seamlessly monitor, optimize, and troubleshoot LLM applications that use Amazon Bedrock and gain real-time insight into invocation rates, error counts, and latency across different models. The Bedrock integration also adds to the existing abilities to ingest and analyze LangChain tracing data via OpenTelemetry to provide comprehensive observability for LLMs and LLM-based applications.
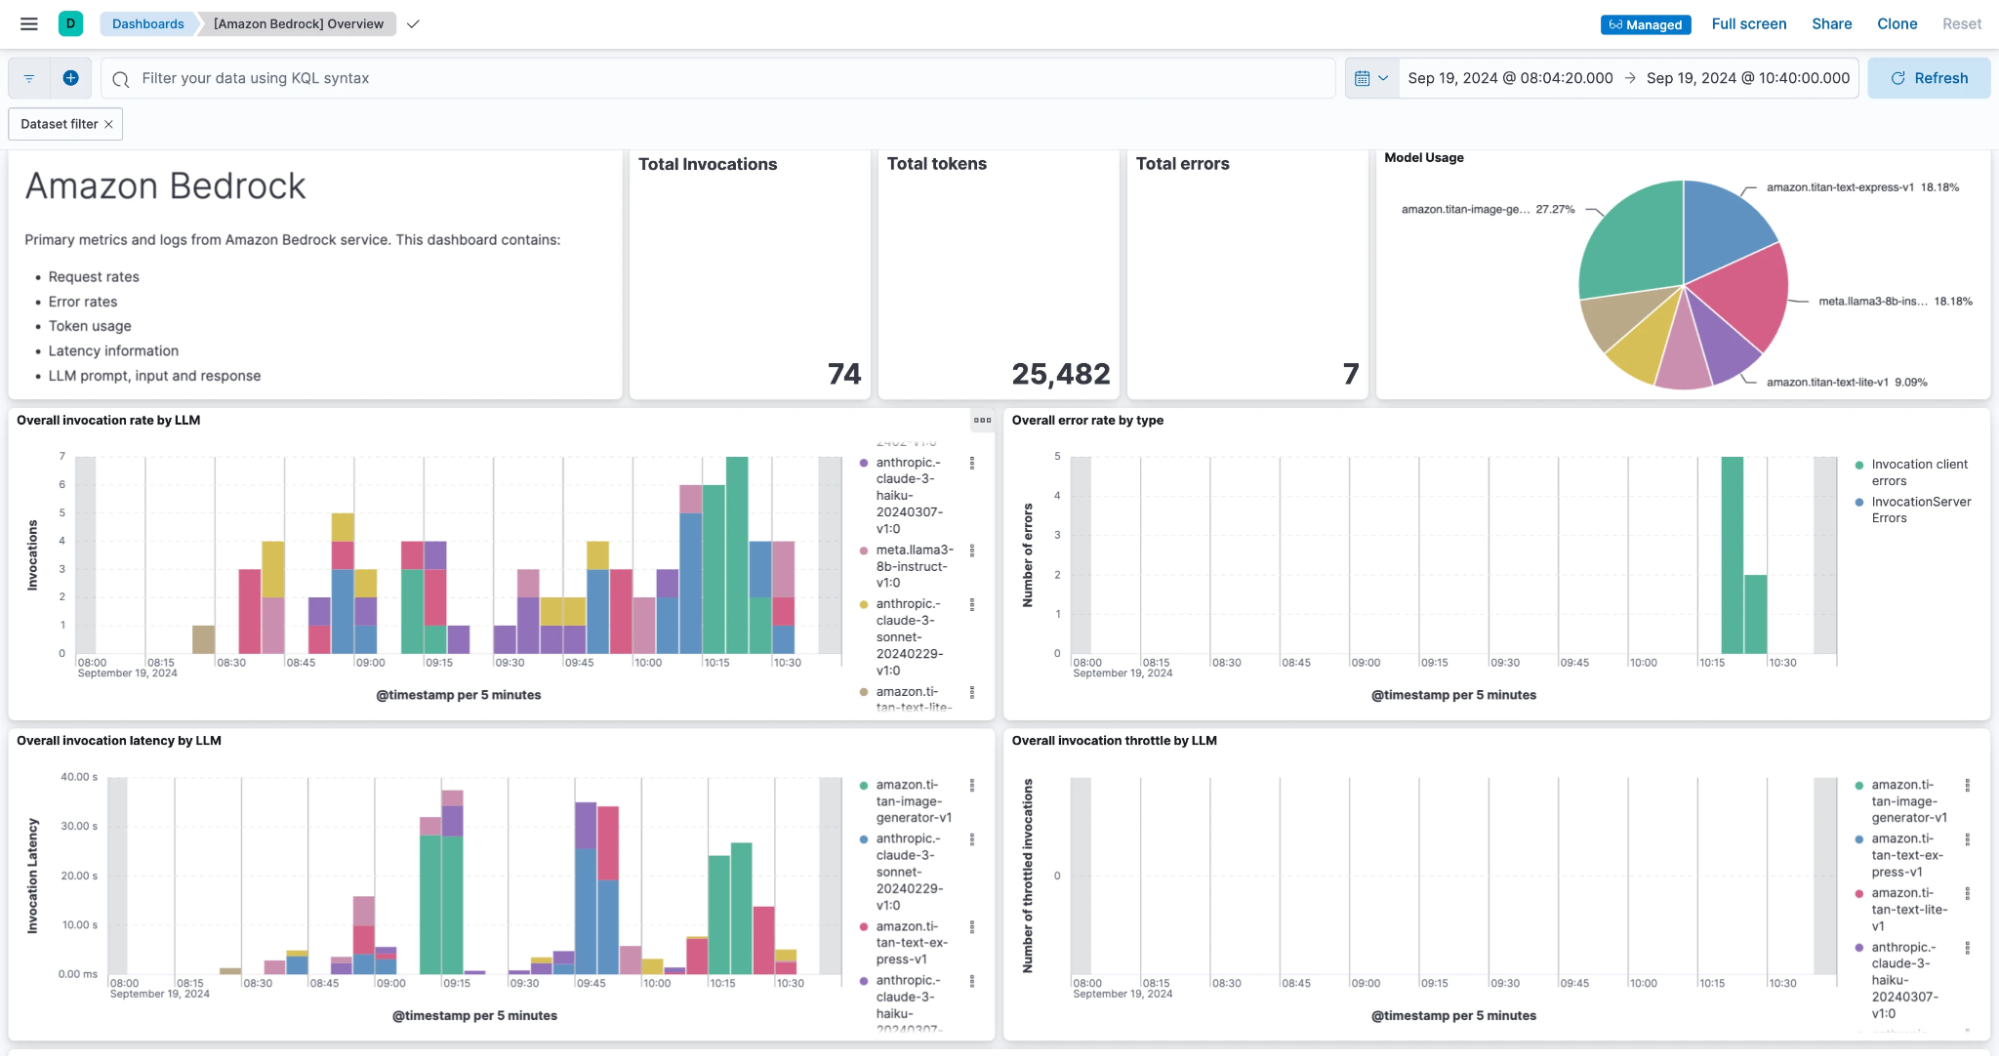
The Amazon Bedrock integration offers rich out-of-the-box visibility into the performance and usage information of models in Amazon Bedrock, including text and image models. The Amazon Bedrock overview dashboard below provides a summarized view of the invocations, errors, and latency information across various models.
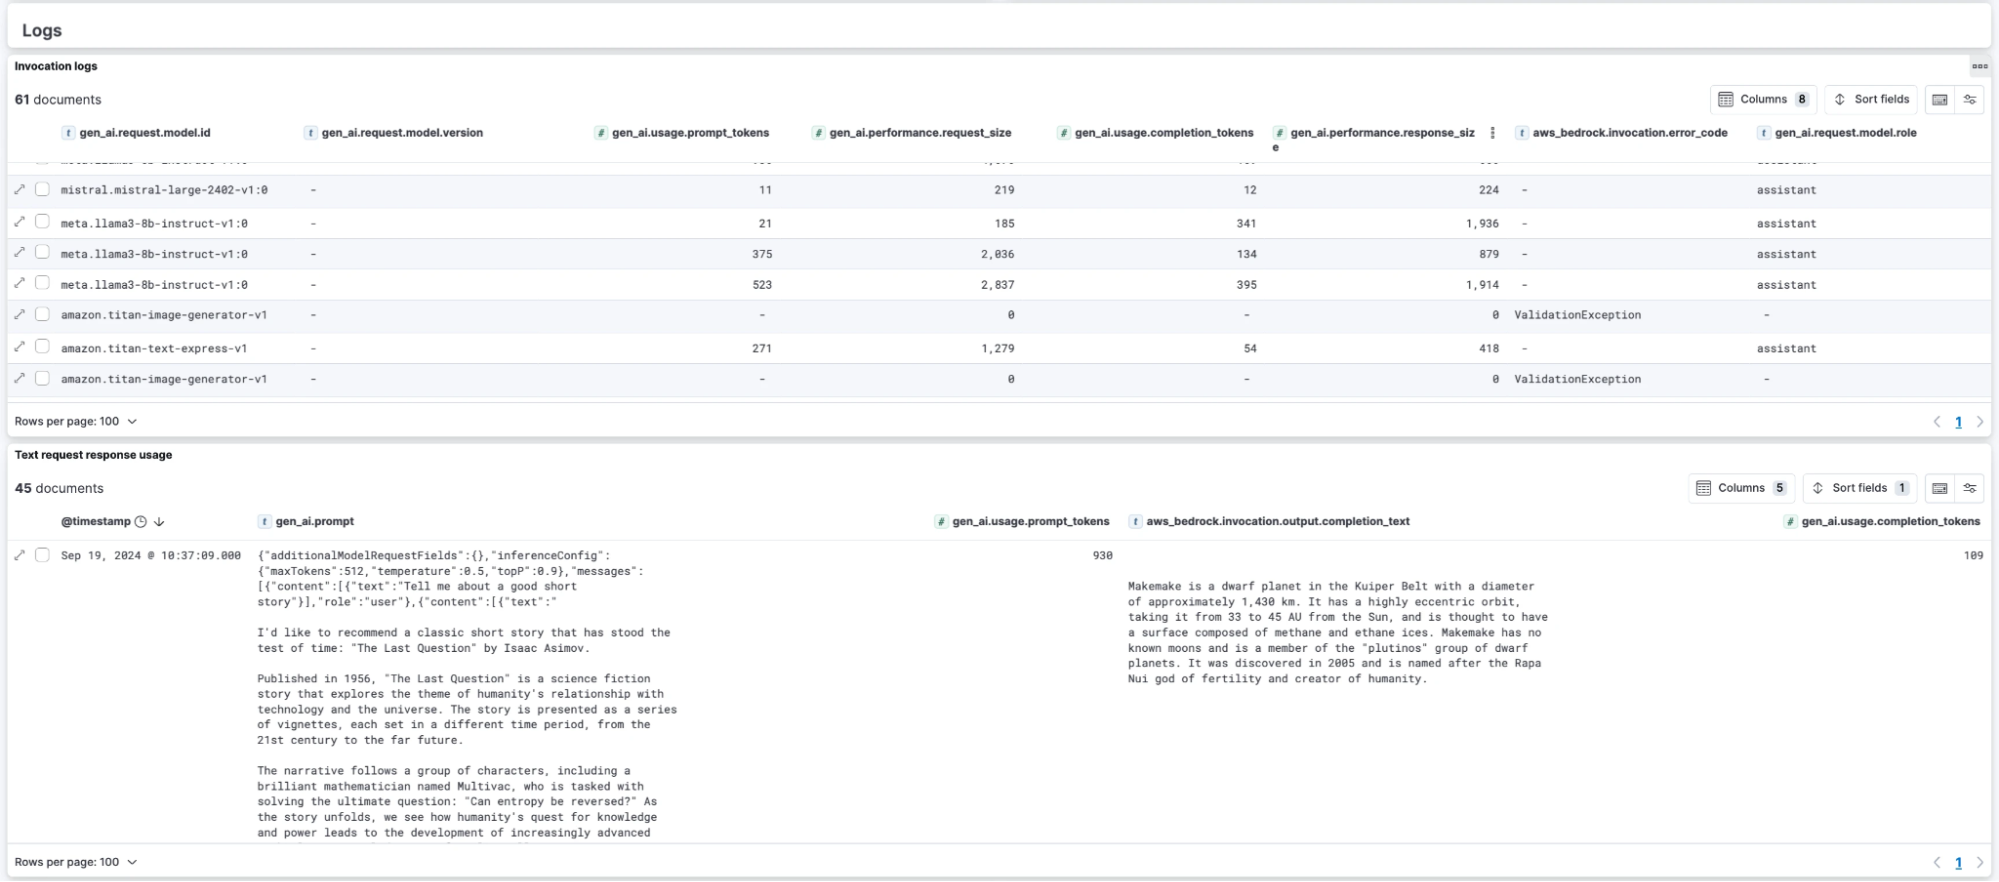
The detailed logs view below provides full visibility into raw model interactions, capturing both the inputs (prompts) and the outputs (responses) generated by the models. This transparency enables you to analyze and optimize how your LLM handles different requests, allowing for more precise fine-tuning of both the prompt structure and the resulting model responses. By closely monitoring these interactions, you can refine prompt strategies and enhance the quality and reliability of model outputs.
The Amazon Bedrock overview dashboard provides a comprehensive view of the initial and final response times. It includes a percentage comparison graph that highlights the performance differences between these response stages, enabling you to quickly identify efficiency improvements or potential bottlenecks in your LLM interactions.

As with any Elastic integration, Amazon Bedrock logs and metrics are fully integrated into Elastic Observability, allowing you to leverage features like SLOs, alerting, custom dashboards, and detailed logs exploration.
OpenTelemetry (OTel) data ingestion that simply works
Automated Kubernetes infrastructure and application monitoring
We have streamlined Kubernetes monitoring by integrating OpenTelemetry with automated onboarding and preconfigured dashboards. This minimizes manual intervention, allowing organizations to focus on data insights rather than infrastructure management.
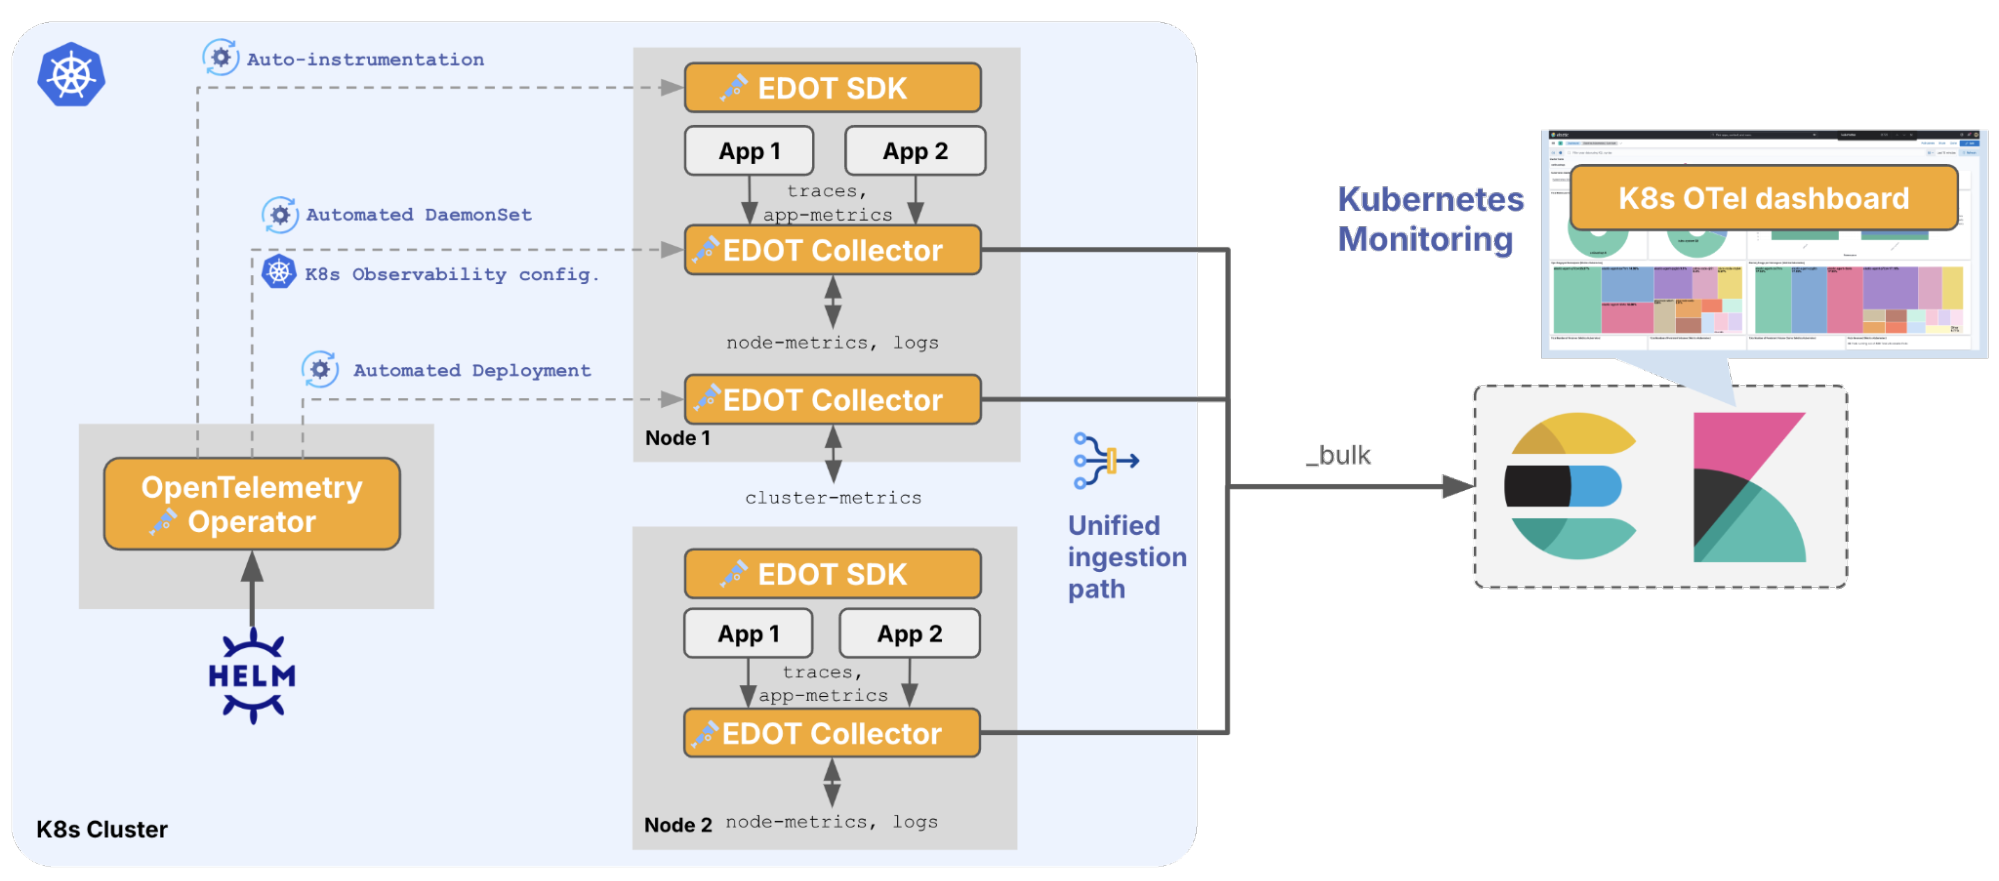
The OTel operator-powered orchestration of EDOT automates tedious tasks like deploying collectors and also provides a self-serve approach by enabling app teams to use annotations based zero-code instrumentation of applications running in Kubernetes.
1. Automated OTel Collector lifecycle and application auto-instrumentation with EDOT SDKs
We now use the OpenTelemetry Operator to automate the entire EDOT collector lifecycle, from deployment to scaling and updating. With automatic instrumentation via EDOT SDKs that support multiple languages like Node.js, Java, Python, and more, users can focus on applications instead of observability instrumentation.
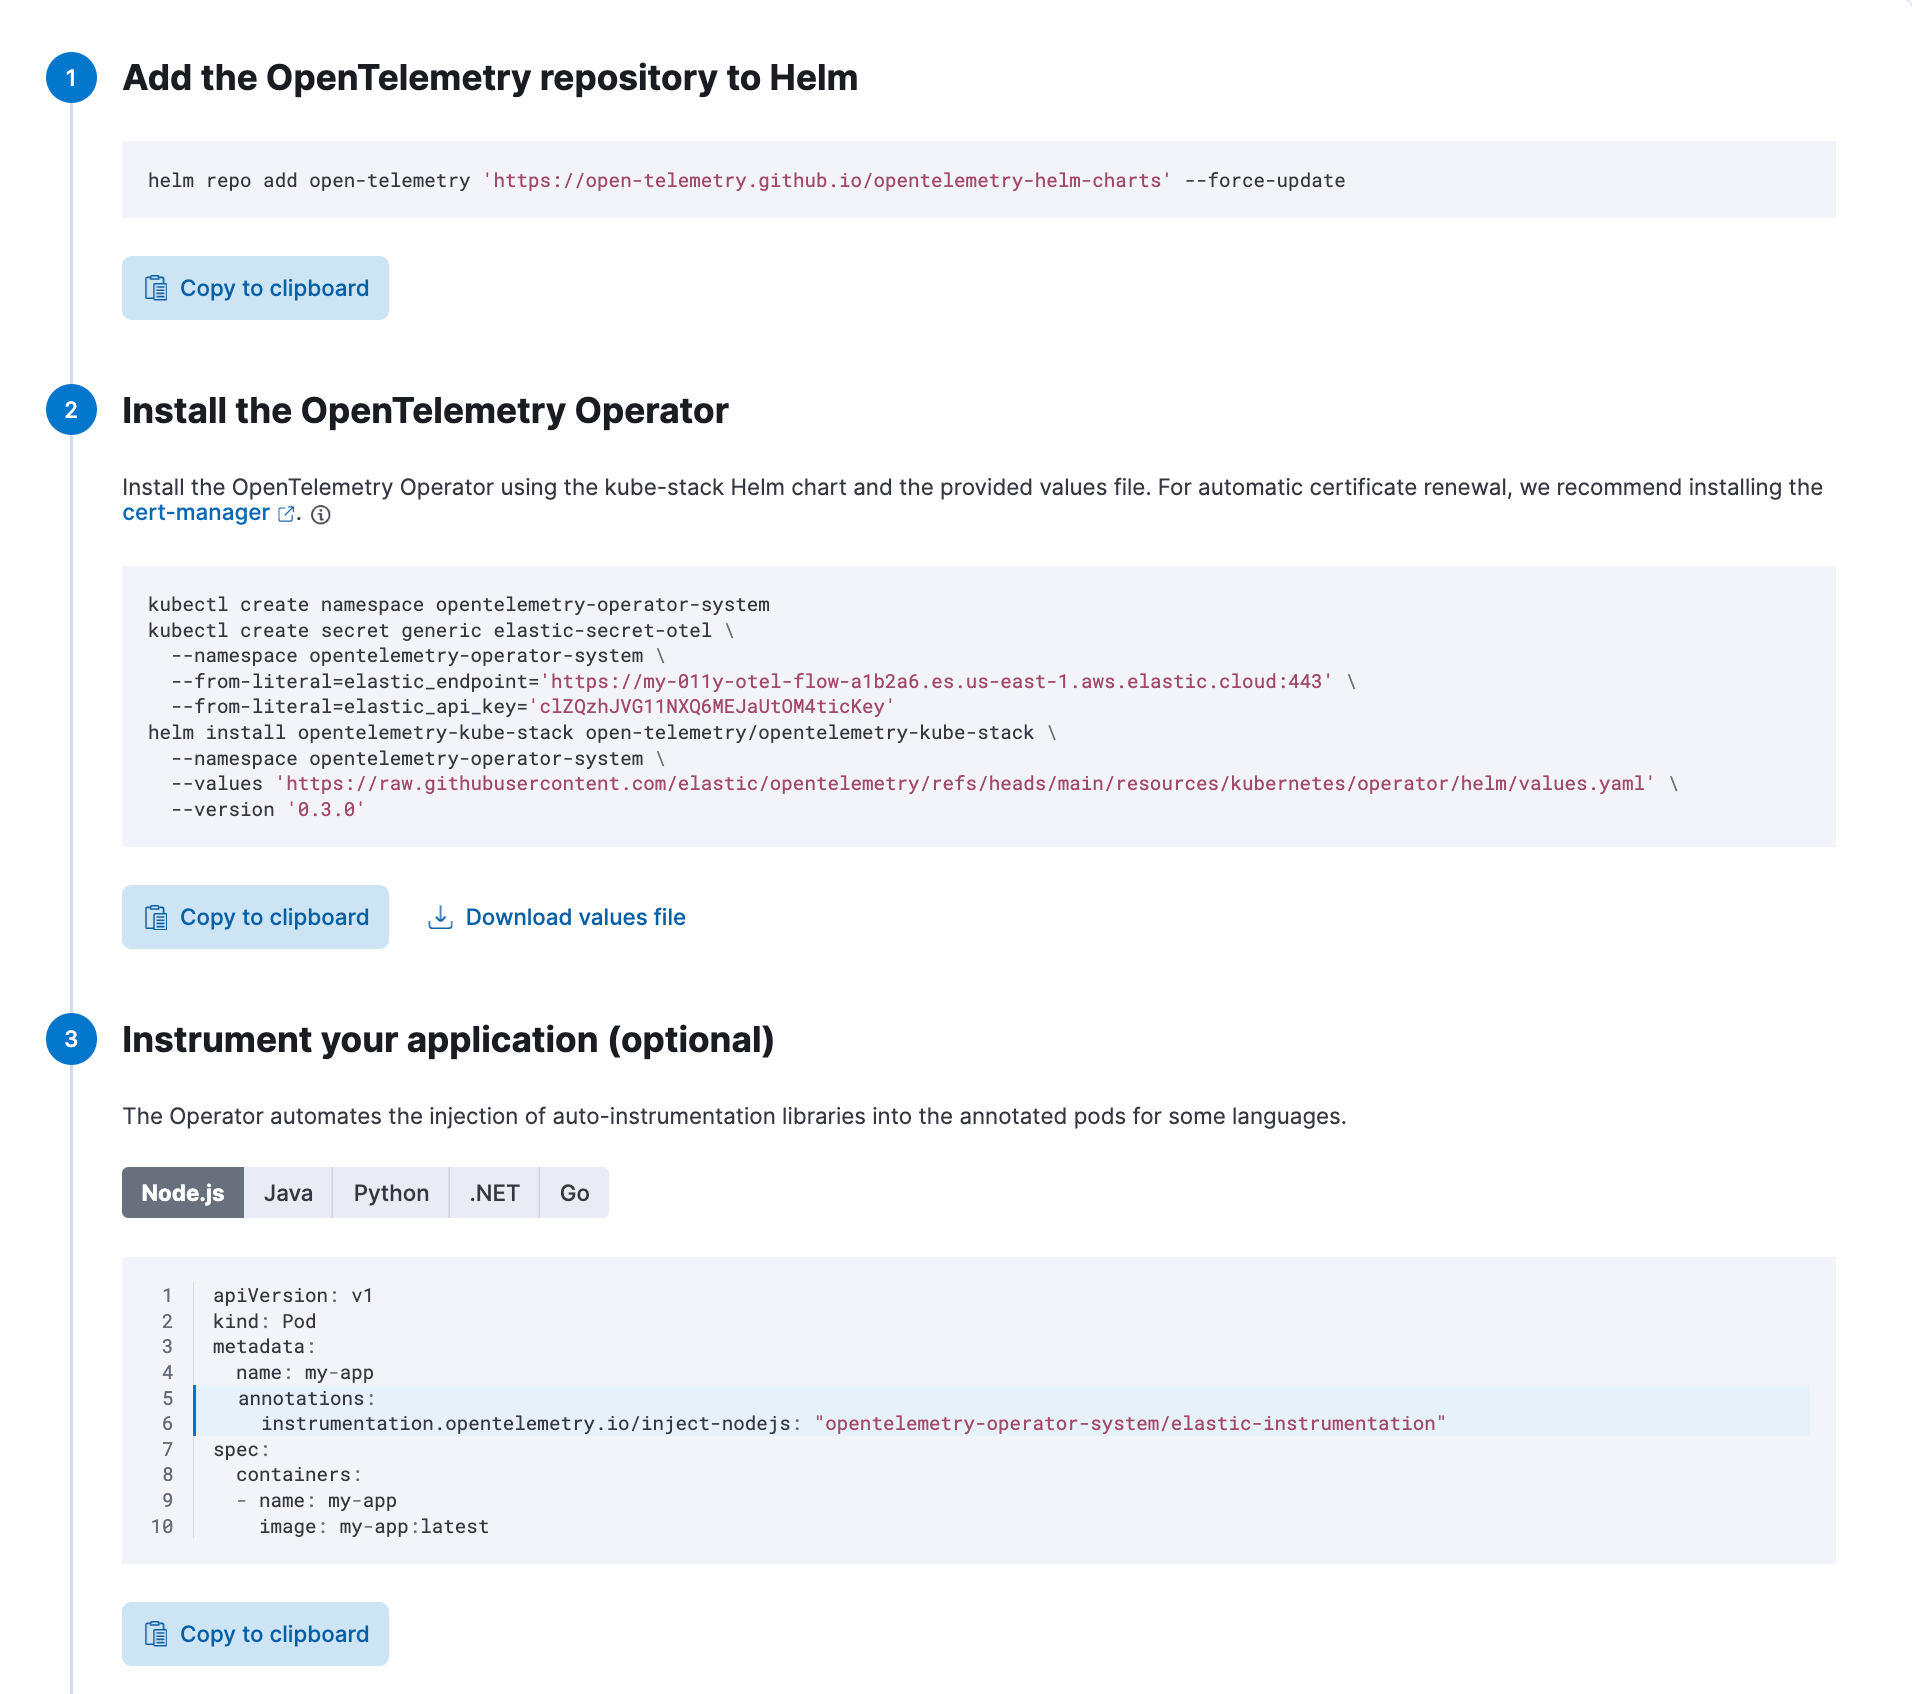
This three-step flow simplifies the deployment of OpenTelemetry for Kubernetes with Helm. First, users add the OpenTelemetry repository to Helm for streamlined access. Then, the OpenTelemetry Operator is installed with a single command, automating the setup and configuration. Finally, optional instrumentation is made easy by auto-injecting libraries into annotated pods. This process enables fast, hassle-free observability for Kubernetes environments.
2. Prepackaged OTel Kubernetes
We have bundled all essential OTel components for Kubernetes observability, including receivers and processors. OTel-native Kibana dashboards give you comprehensive observability without manual configuration. By leveraging receivers like the Kubernetes and Kubeletstats Receivers, we now bring you turnkey observability that simplifies the monitoring process across Kubernetes environments.
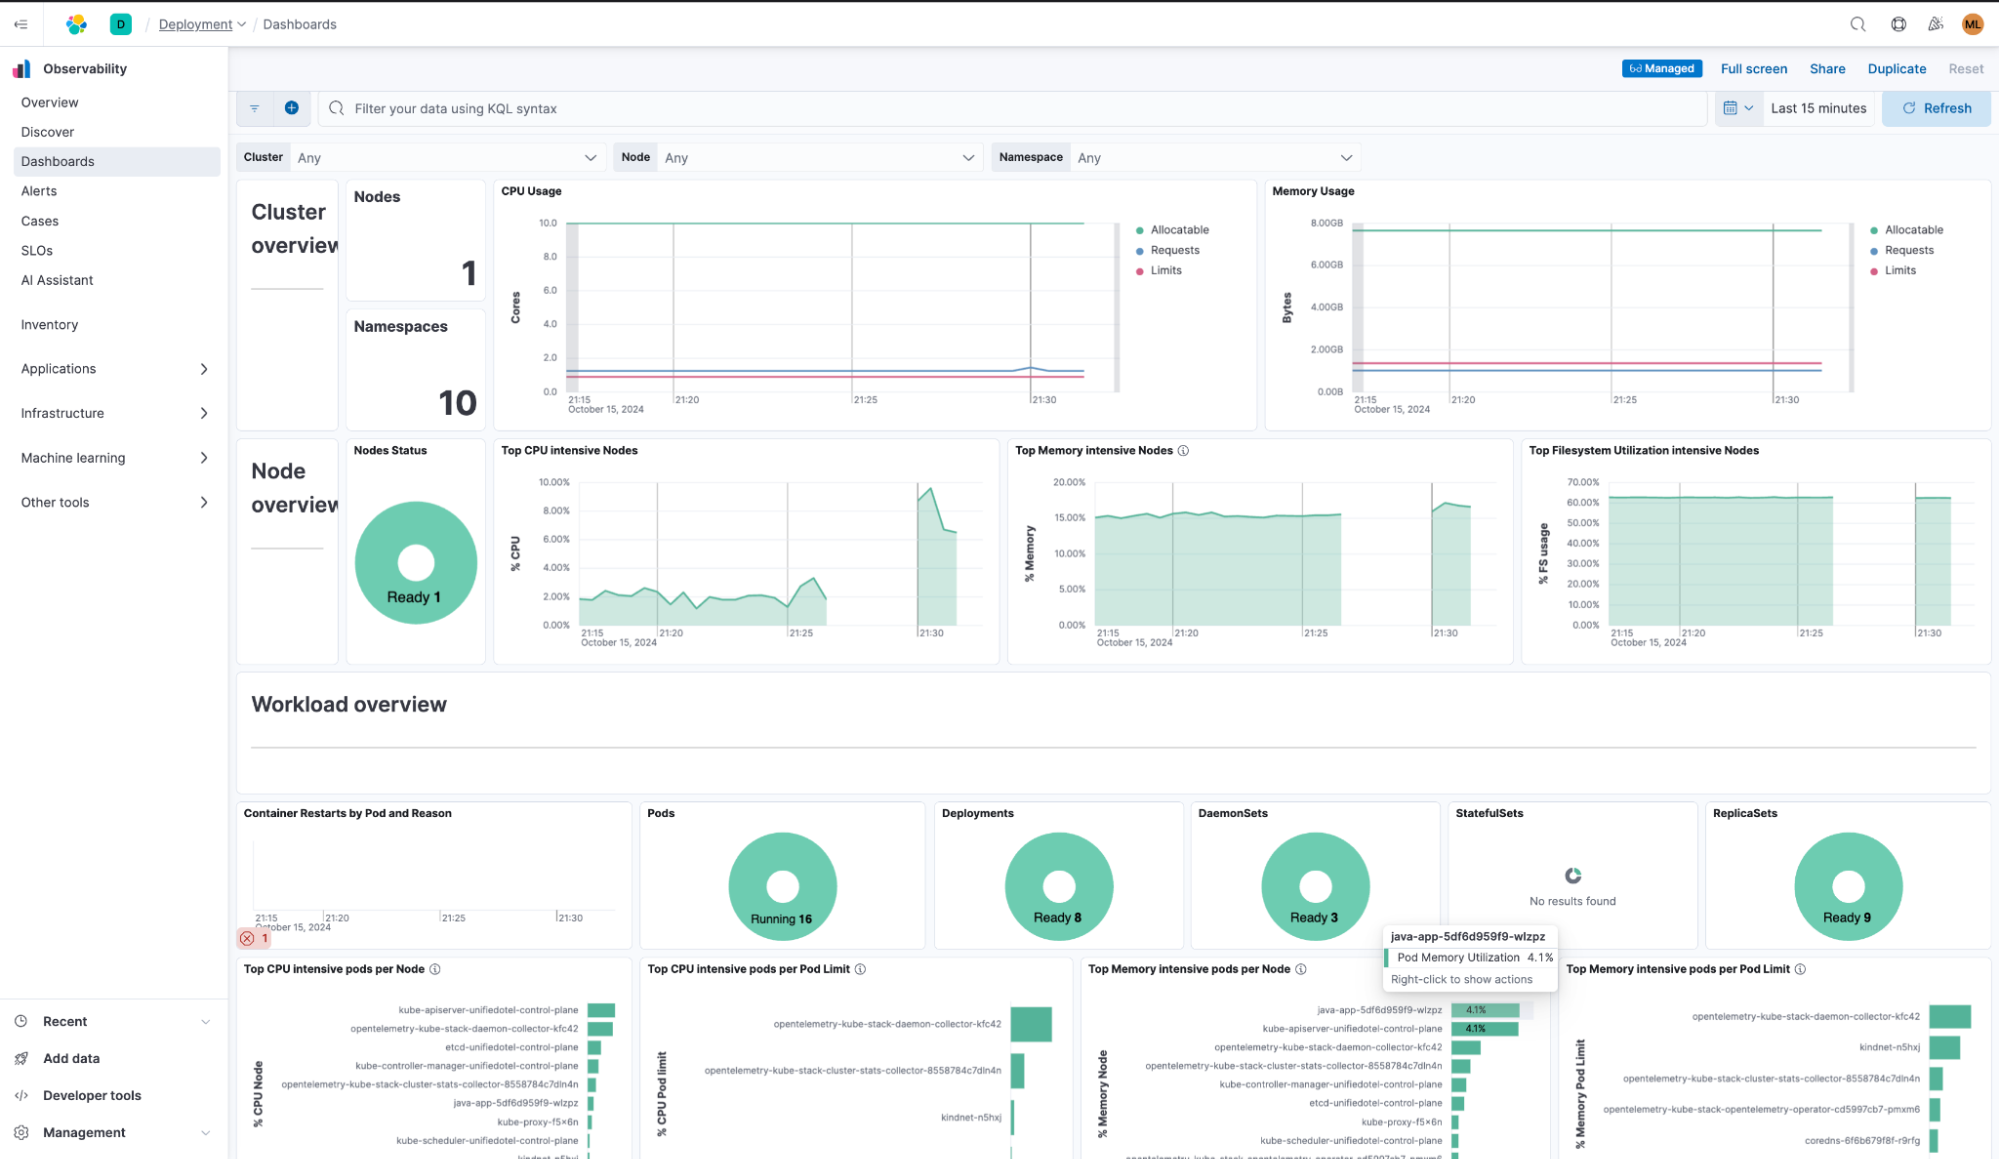
3. Direct tracing to Elasticsearch with EDOT Collector — no schema conversions!
EDOT Collector eliminates the need for an APM server, allowing trace data to flow directly into Elasticsearch via the Elasticsearch exporter. This reduces infrastructure overhead while maintaining rich, real-time performance insights. By consolidating APM functionality into the EDOT ecosystem, Elastic reduces operational complexity and costs — offering a streamlined, scalable observability solution.
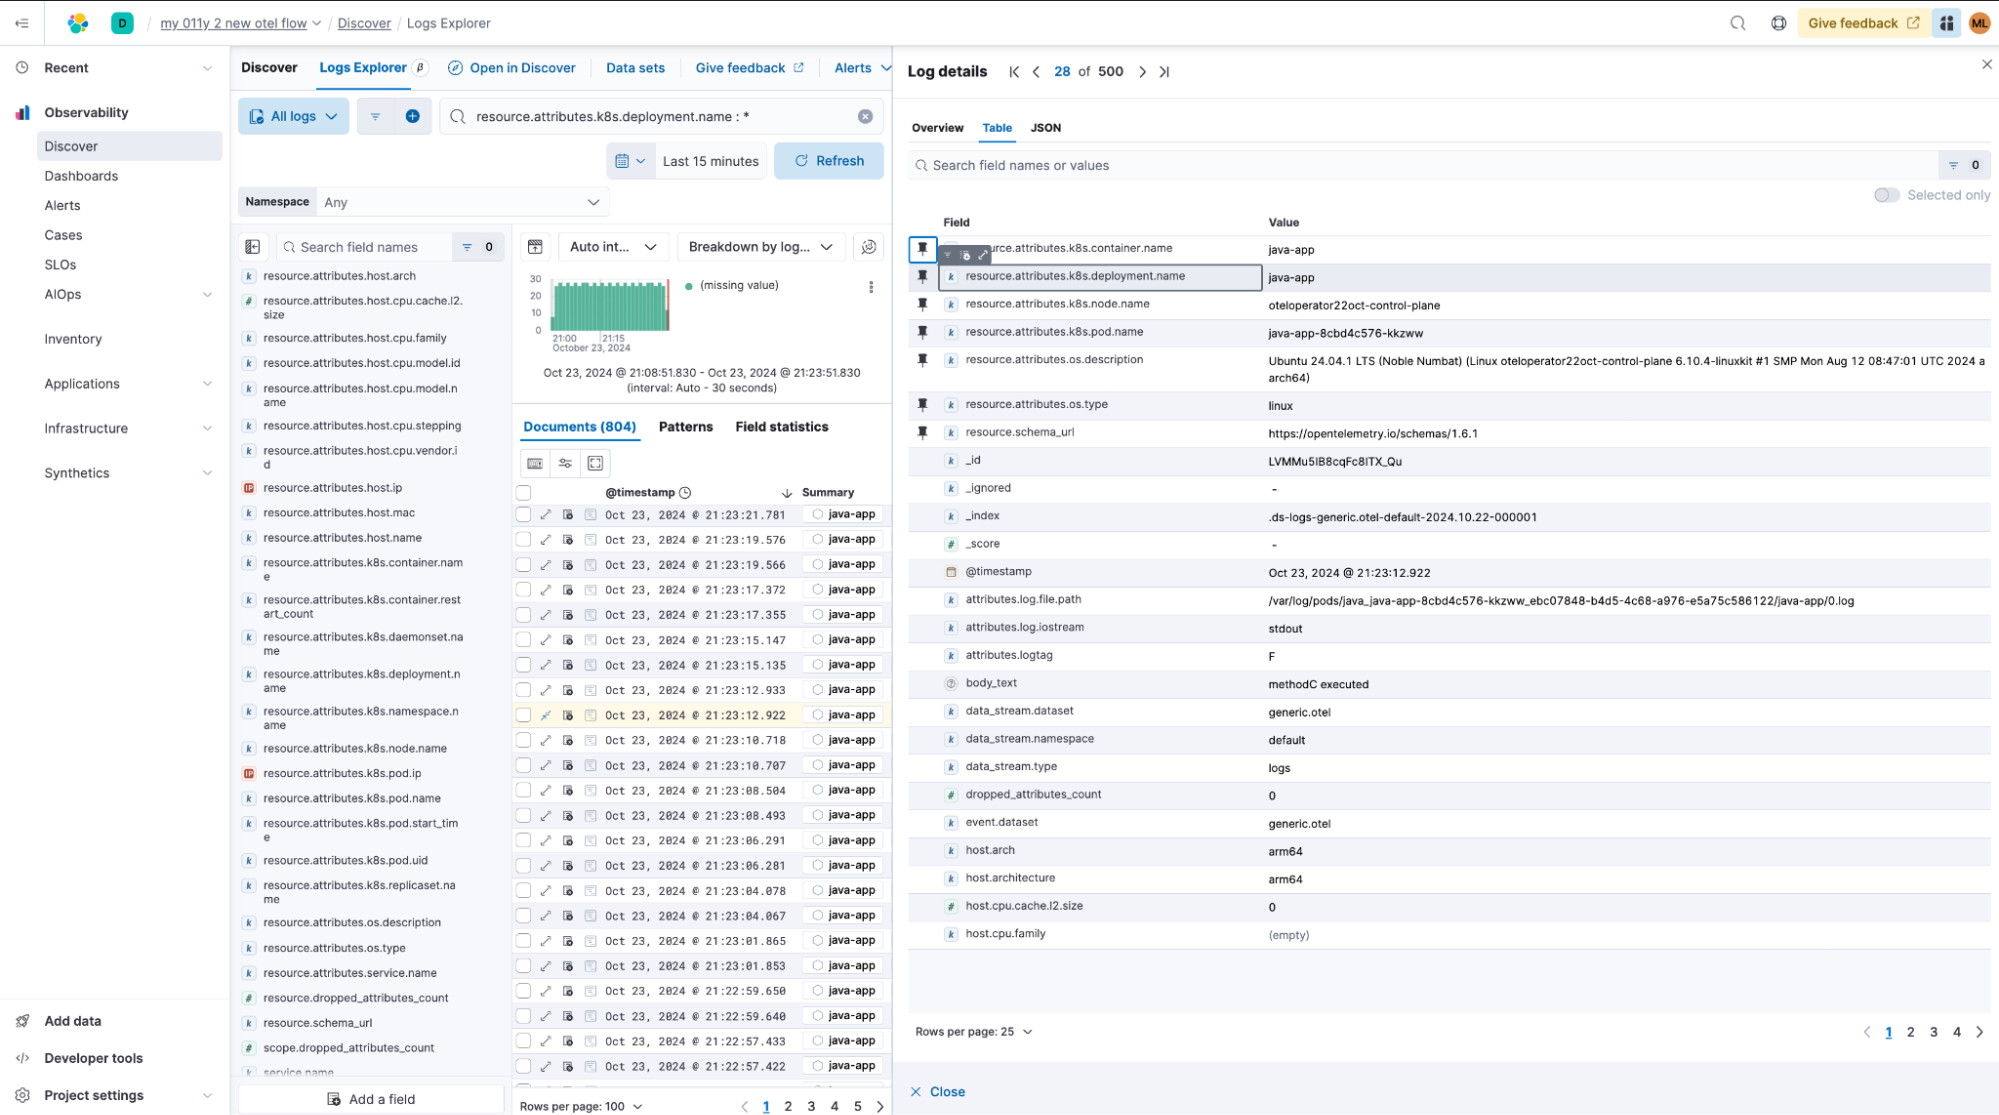
This approach ensures we fully preserve OpenTelemetry’s semantic conventions and data structure, including resource attributes, for consistent and reliable observability.
Log analytics enhancements
Contextual Discover experience
Discover in Kibana 8.16 now automatically adjusts data table presentation based on the type of data being explored. This streamlined, context-aware approach boosts productivity by simplifying data exploration and highlighting key log insights without the need for additional configuration. This is just the start of our ongoing effort to make Discover the go-to place for log analysis.
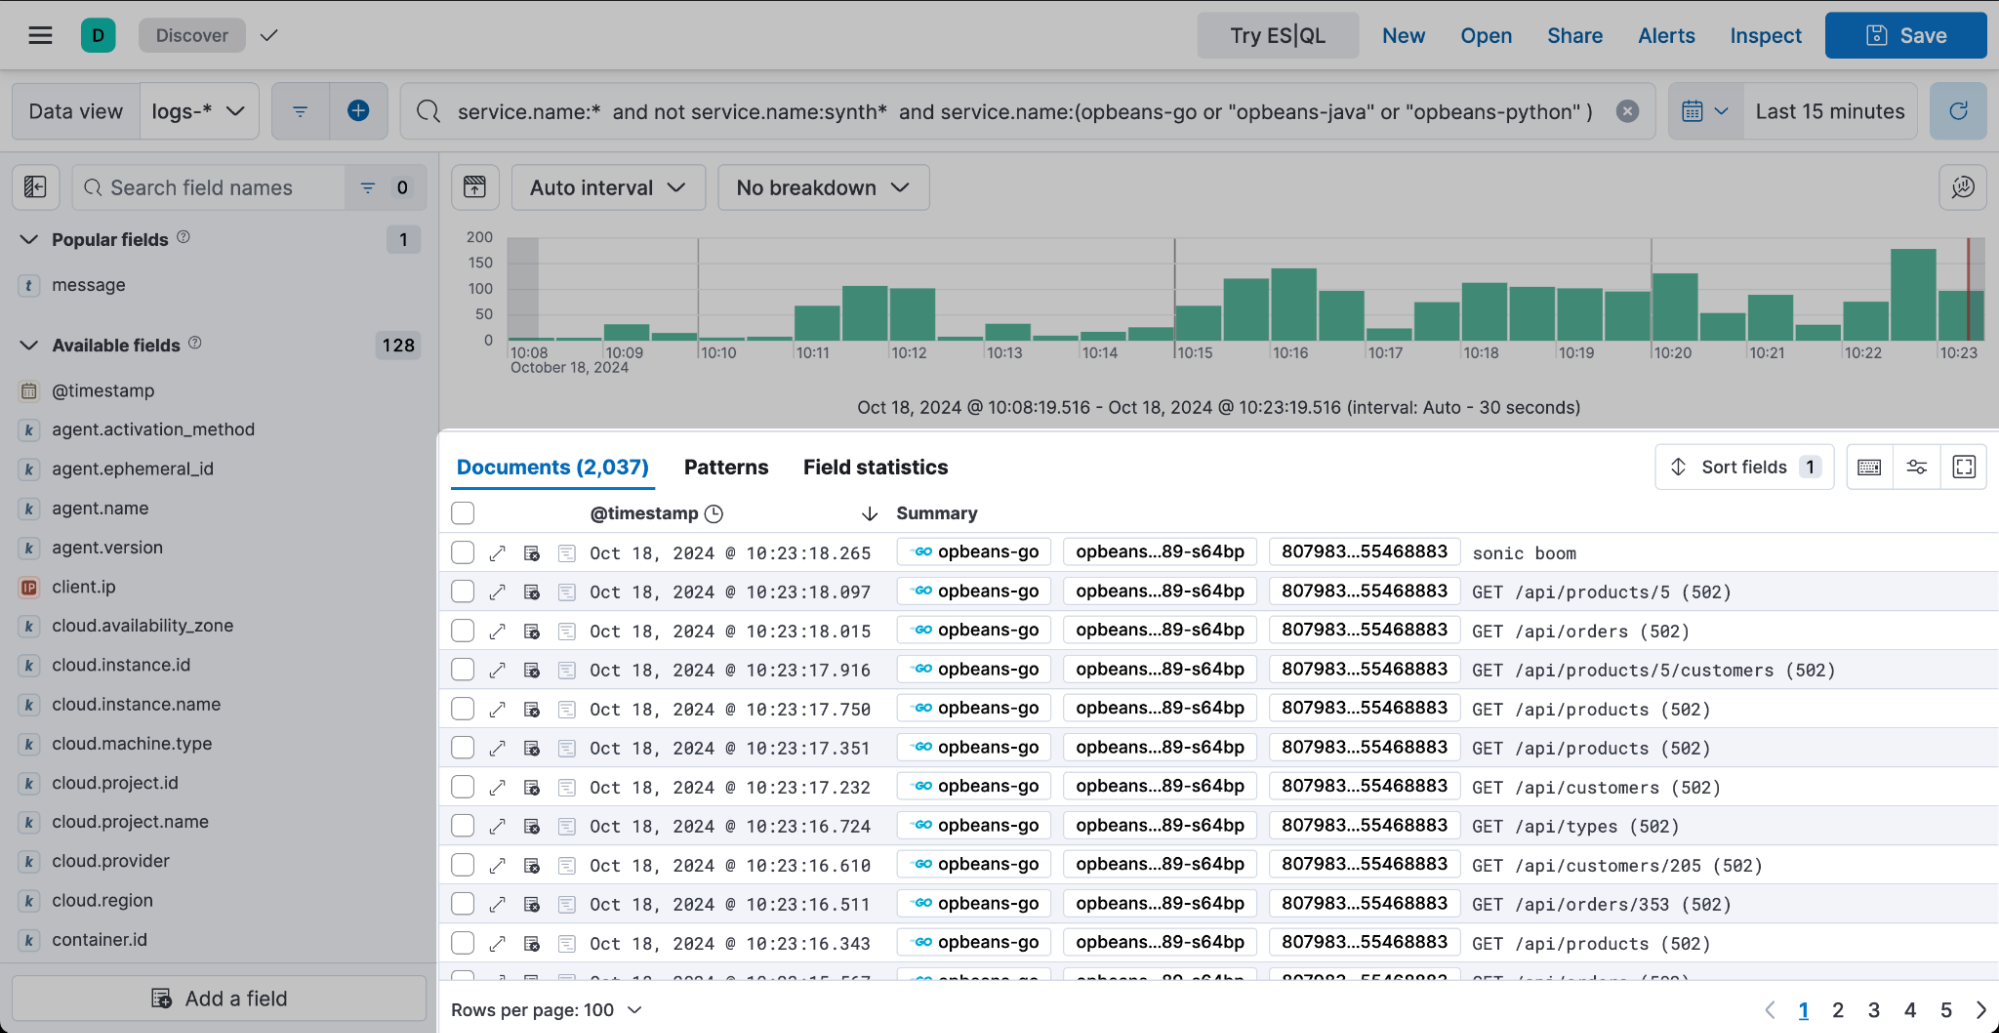
The new summary column allows you to view important information at a glance. Service names are highlighted and important resource fields are displayed by default, followed by the log message, error, or stacktrace.
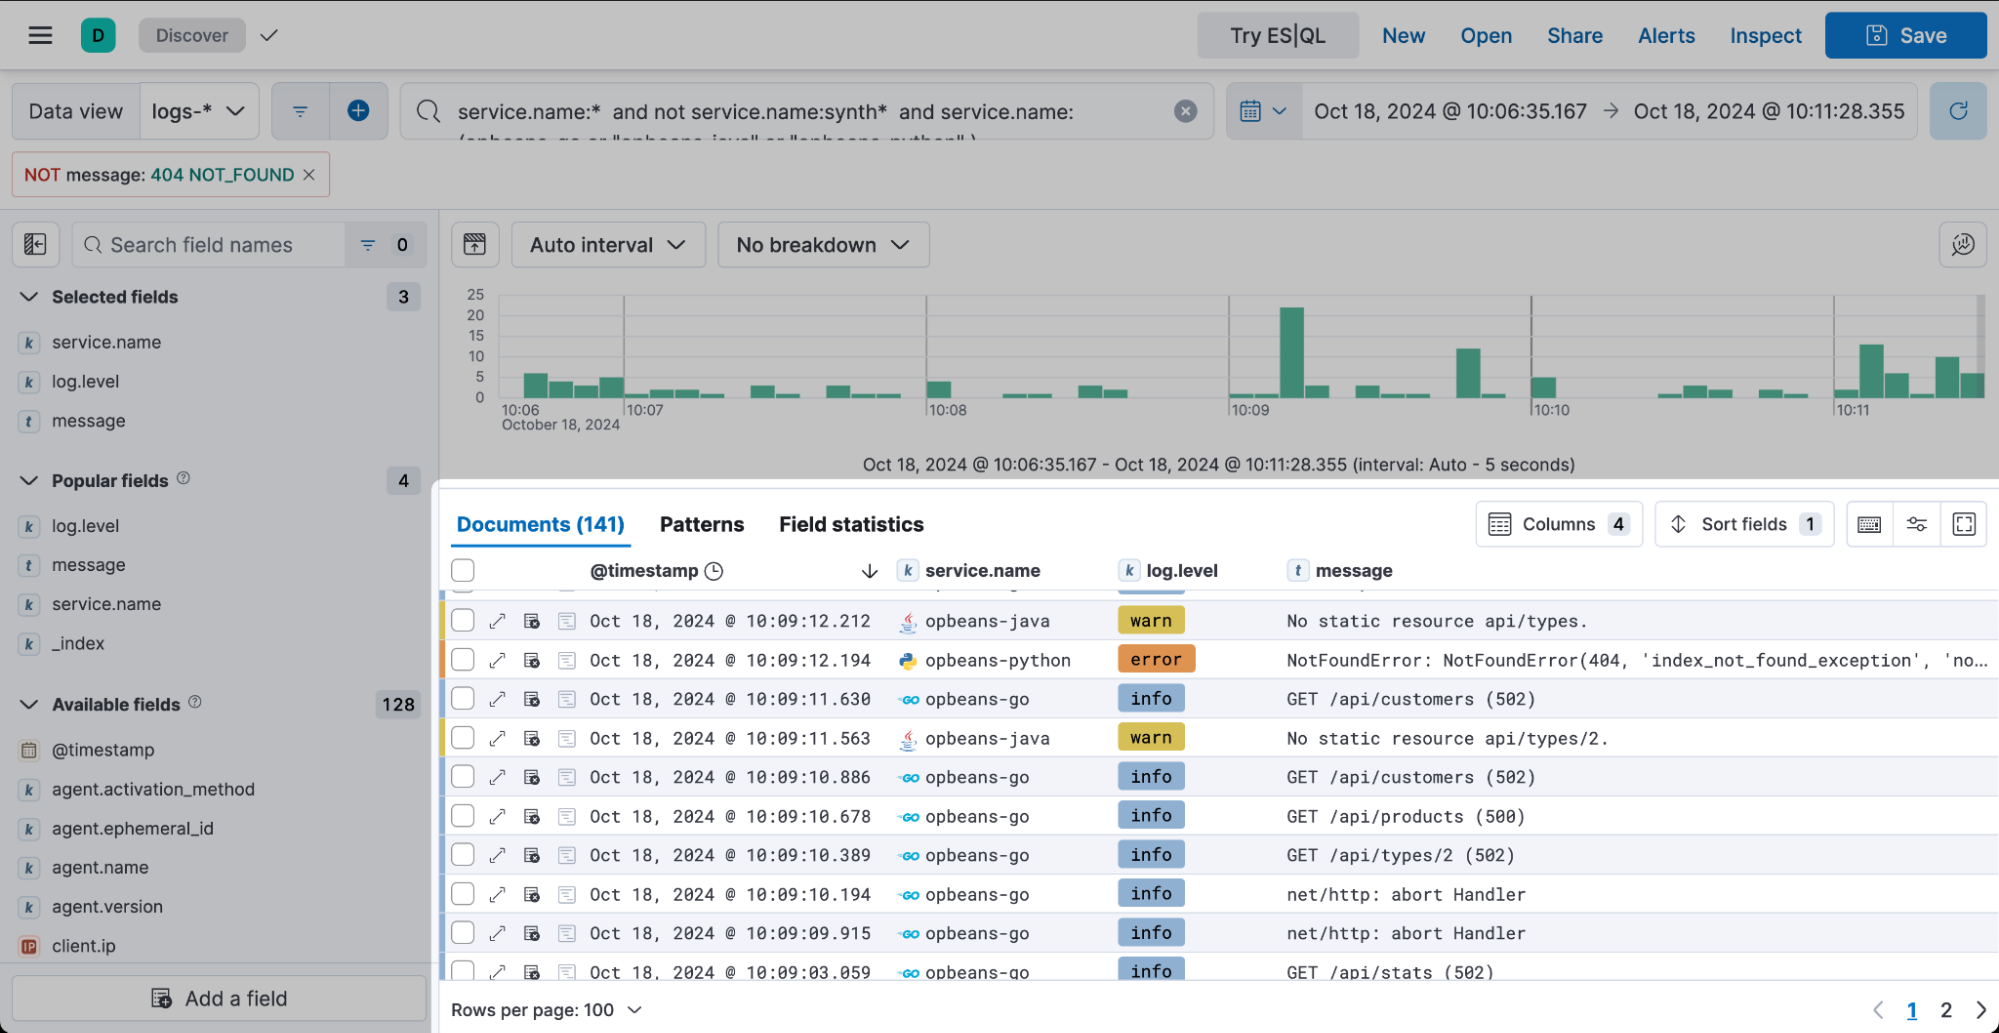
Similar improvements are also present for select fields, such as “log.level” and “service.name” when adding them individually as a dedicated column. The log level is highlighted based on the severity, and the service name also has the richer display state and offers direct links to the APM UI.
Data Set Quality page with more detail information
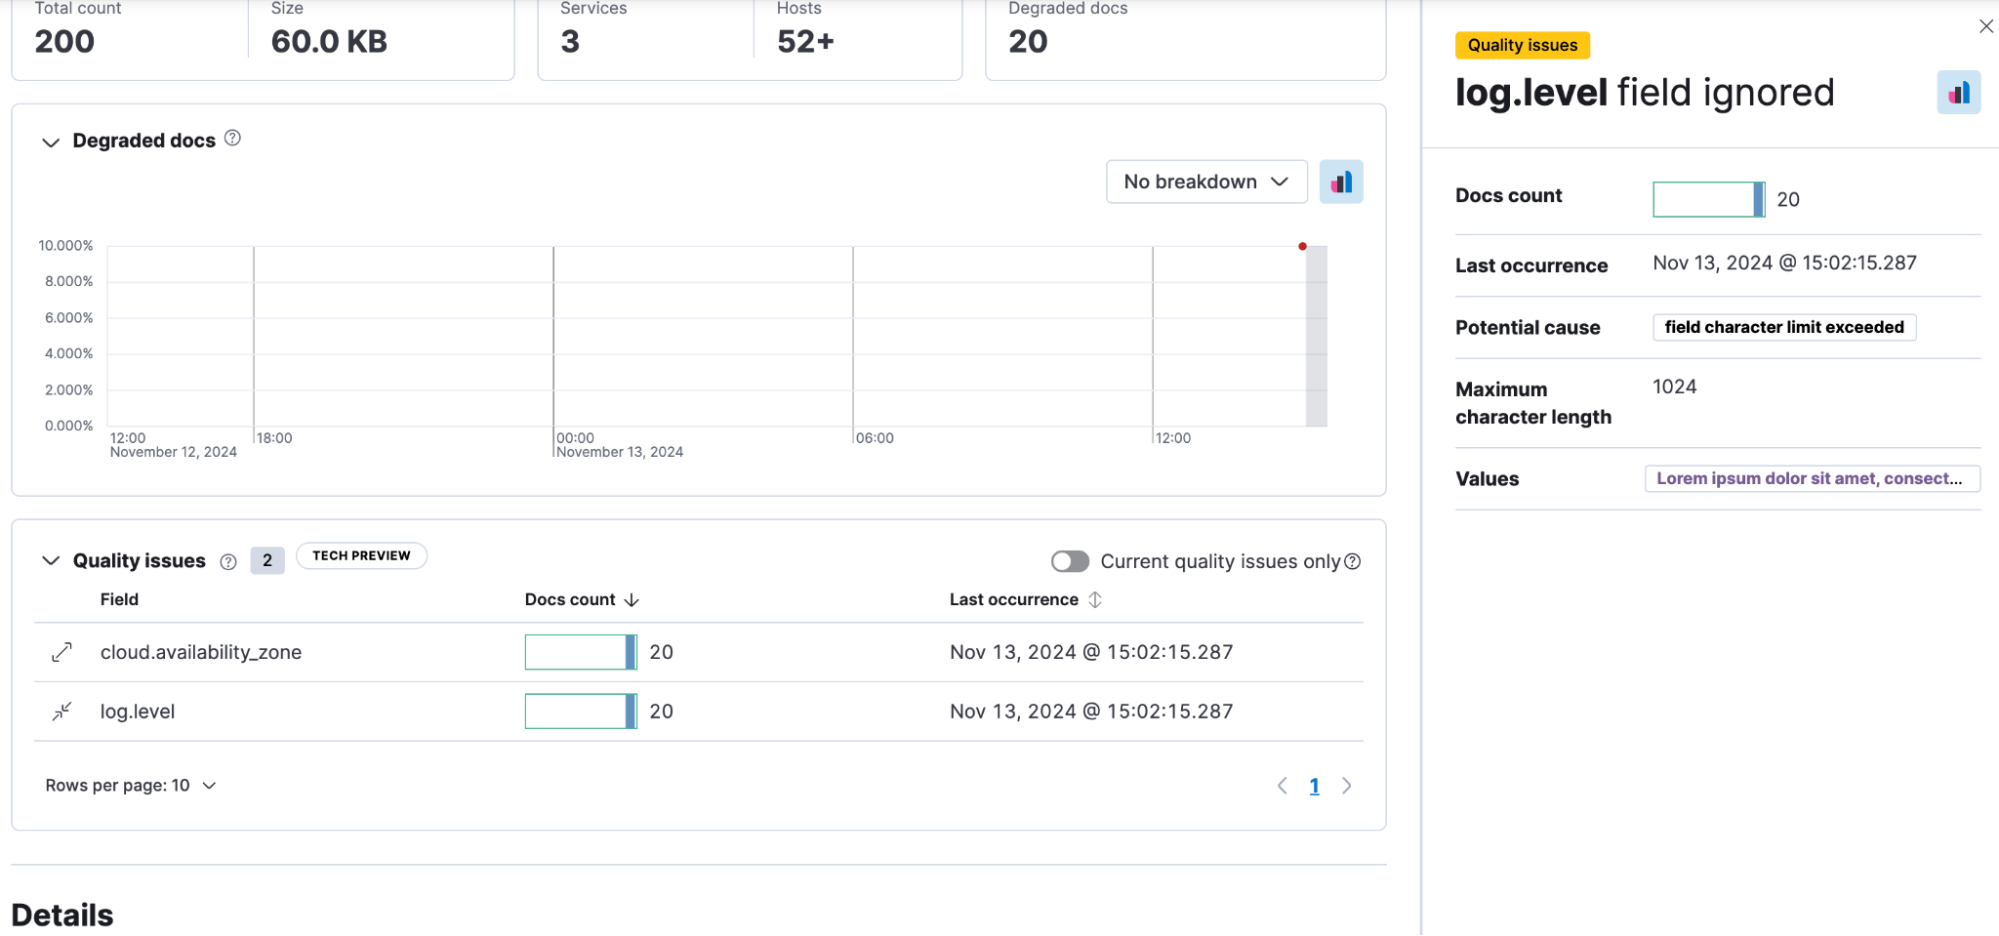
The Data Set Quality page has been extended with additional details to address common issues that result in _ignored fields. The UI now gives users additional details around the data quality issues.
Streamlined onboarding and host monitoring
We're moving our hosts feature to general availability, helping you detect and resolve problems with your hosts more effectively. Key improvements include:
Viewing hosts and their metrics detected by APM (even if you aren't explicitly observing them)
Onboarding your hosts easily
Gaining consistent metrics for your hosts in Observability, such as hosts, infrastructure inventory, dashboards
Quickstart onboarding workflows
We're introducing three new quickstart onboarding workflows in the Add Data page to streamline the setup or telemetry data ingestion process — host monitoring, Kubernetes monitoring, and Amazon Data Firehouse (technical preview).
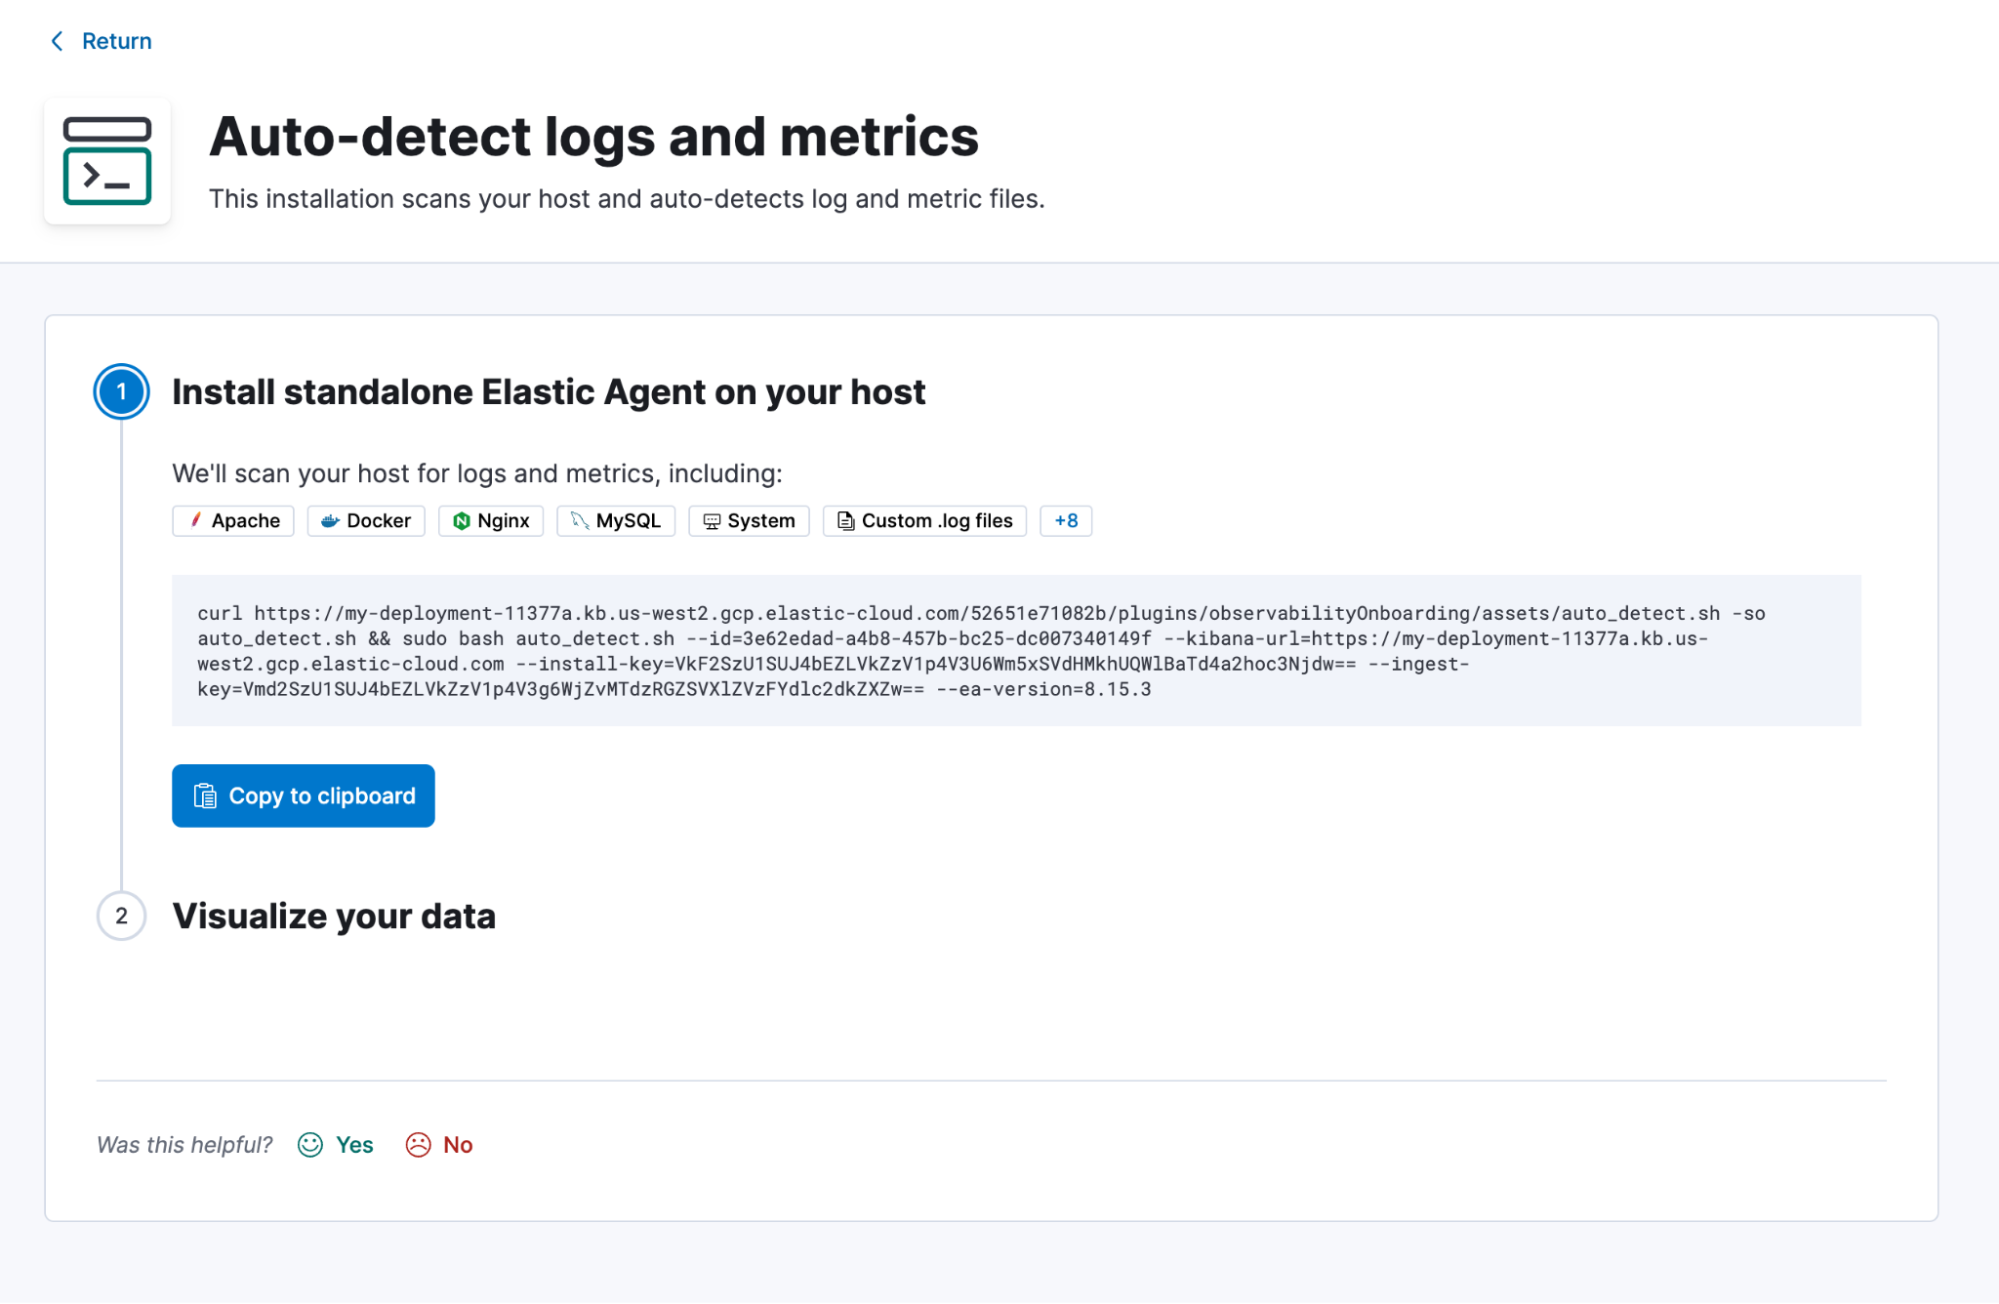
Host monitoring: Scans for logs and metrics on the host and auto-installs the following integrations: System, Custom, Apache, Docker, Nginx, Redis, MySQL, RabbitMQ, Kafka, MongoDB, Apache Tomcat, Prometheus, and Haproxy. When a user follows this quickstart-guided workflow for host monitoring (Linux and macOS), they will obtain a configuration file for the standalone Elastic Agent with predefined defaults for the detected integrations. Users can tweak the provided configuration file based on their needs and use their existing infrastructure-as-code tooling for the Agent lifecycle management in their production environment.
At the end of this guided workflow, users are provided a link to the appropriate prebuilt dashboard for each integration so that they can explore their data.
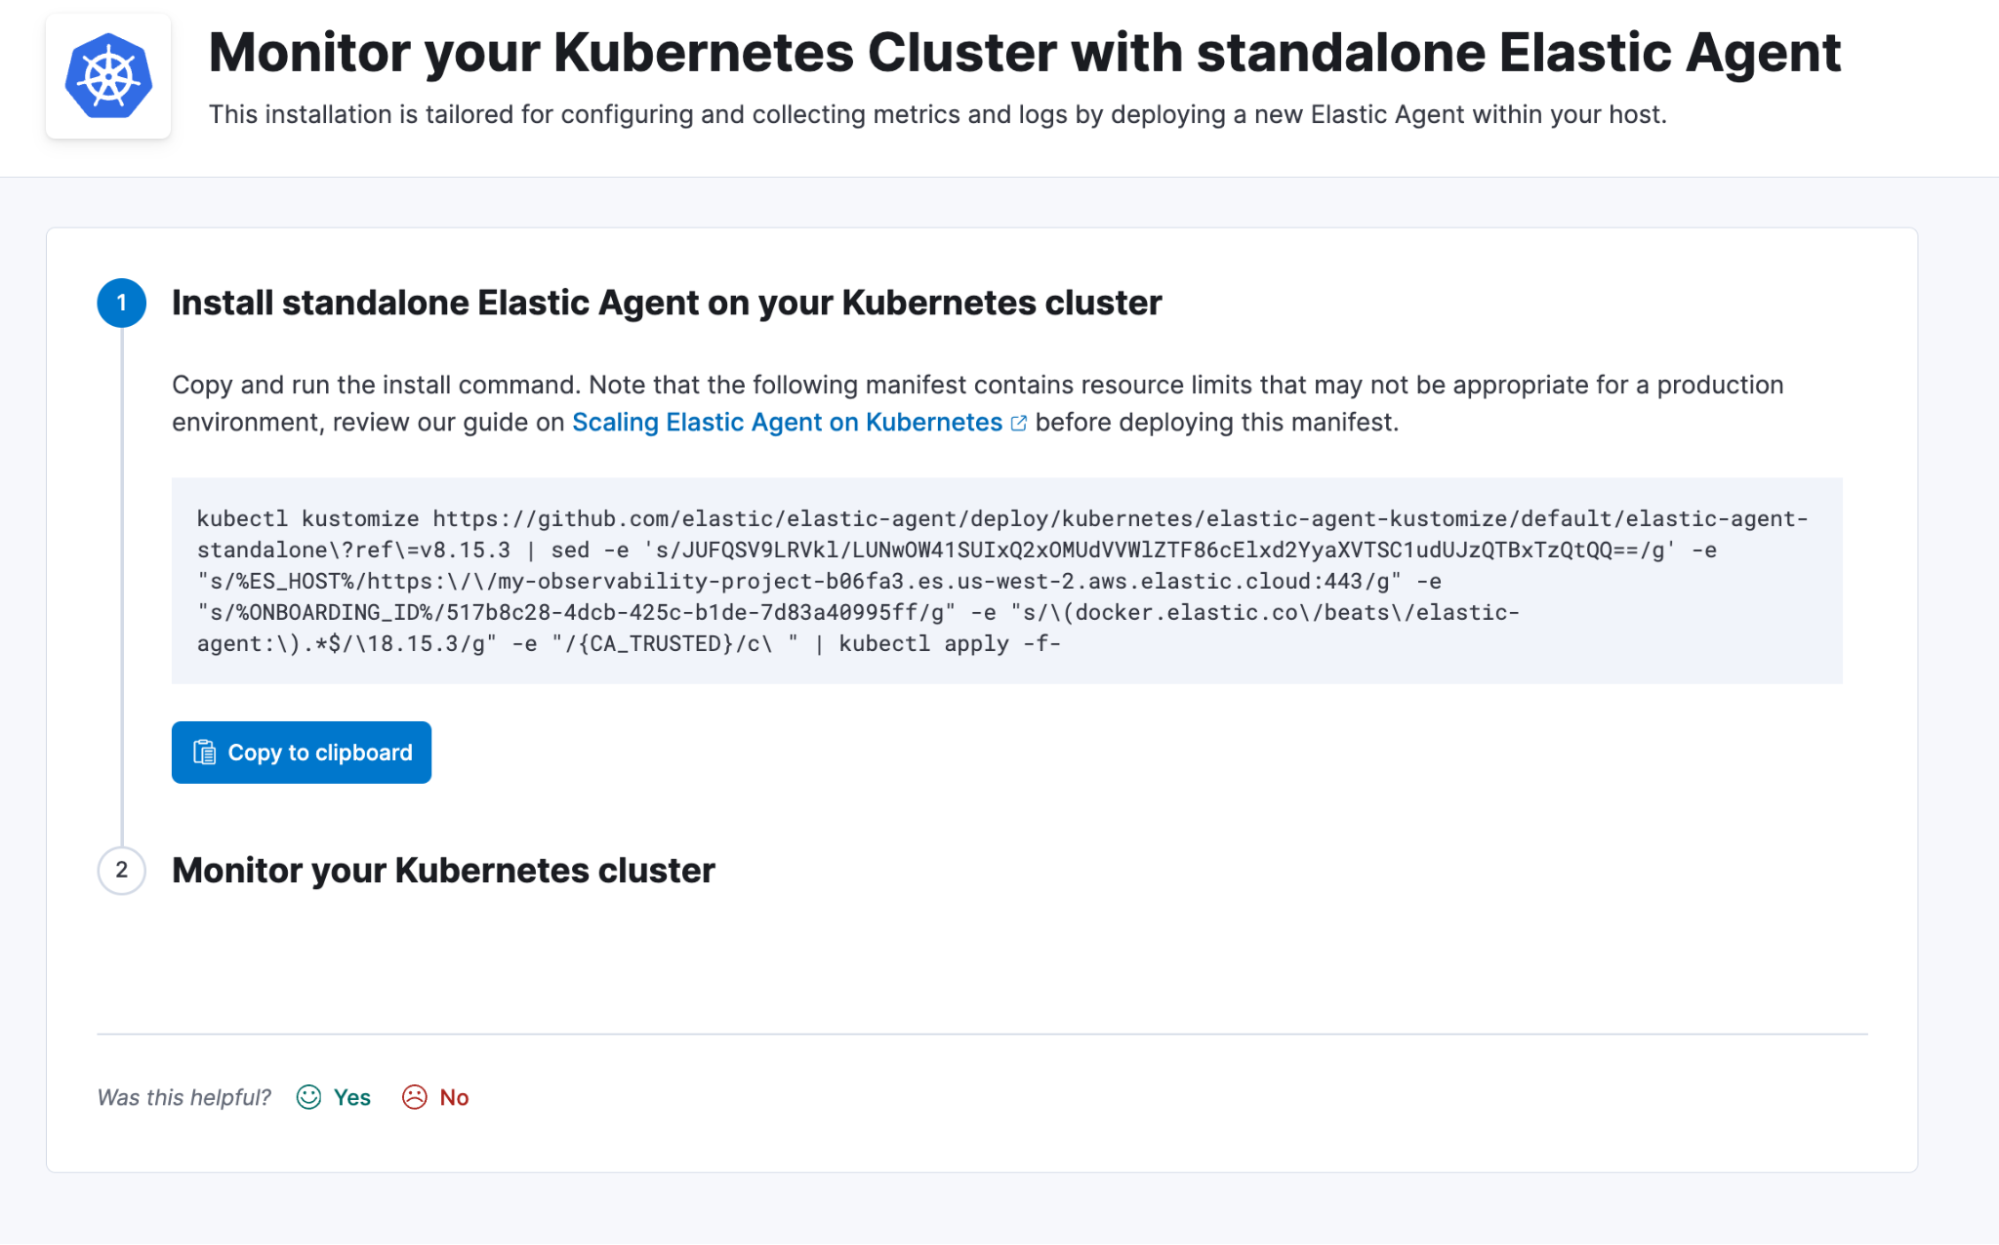
Kubernetes monitoring: Sets up monitoring of the Kubernetes cluster and the container workloads using the standalone Elastic Agent. When a user follows this quickstart-guided workflow for Kubernetes monitoring from the Add Data page, they will obtain a Kubernetes manifest file with predefined defaults for logs and metrics collection. The System and Kubernetes integrations are also automatically installed in Kibana. Users can tweak the provided manifest file based on their needs and use their existing infrastructure-as-code tooling for the Agent lifecycle management in their production environment.
At the end of this guided workflow, users are provided a link to the Kubernetes cluster overview dashboard so that they can explore the metrics and logs that have just been ingested.
Amazon Data Firehose (technical preview): This guided workflow simplifies the setup of an Amazon Data Firehose delivery stream using a prepopulated Amazon CloudFormation template, ingesting all of the available Amazon CloudWatch Logs and Metrics across multiple services for a given customer account.
Users can either use the AWS console or the AWS CLI to complete this guided workflow, as shown in the illustration below. Users are not required to provision or manage any agent as part of this workflow (agentless).
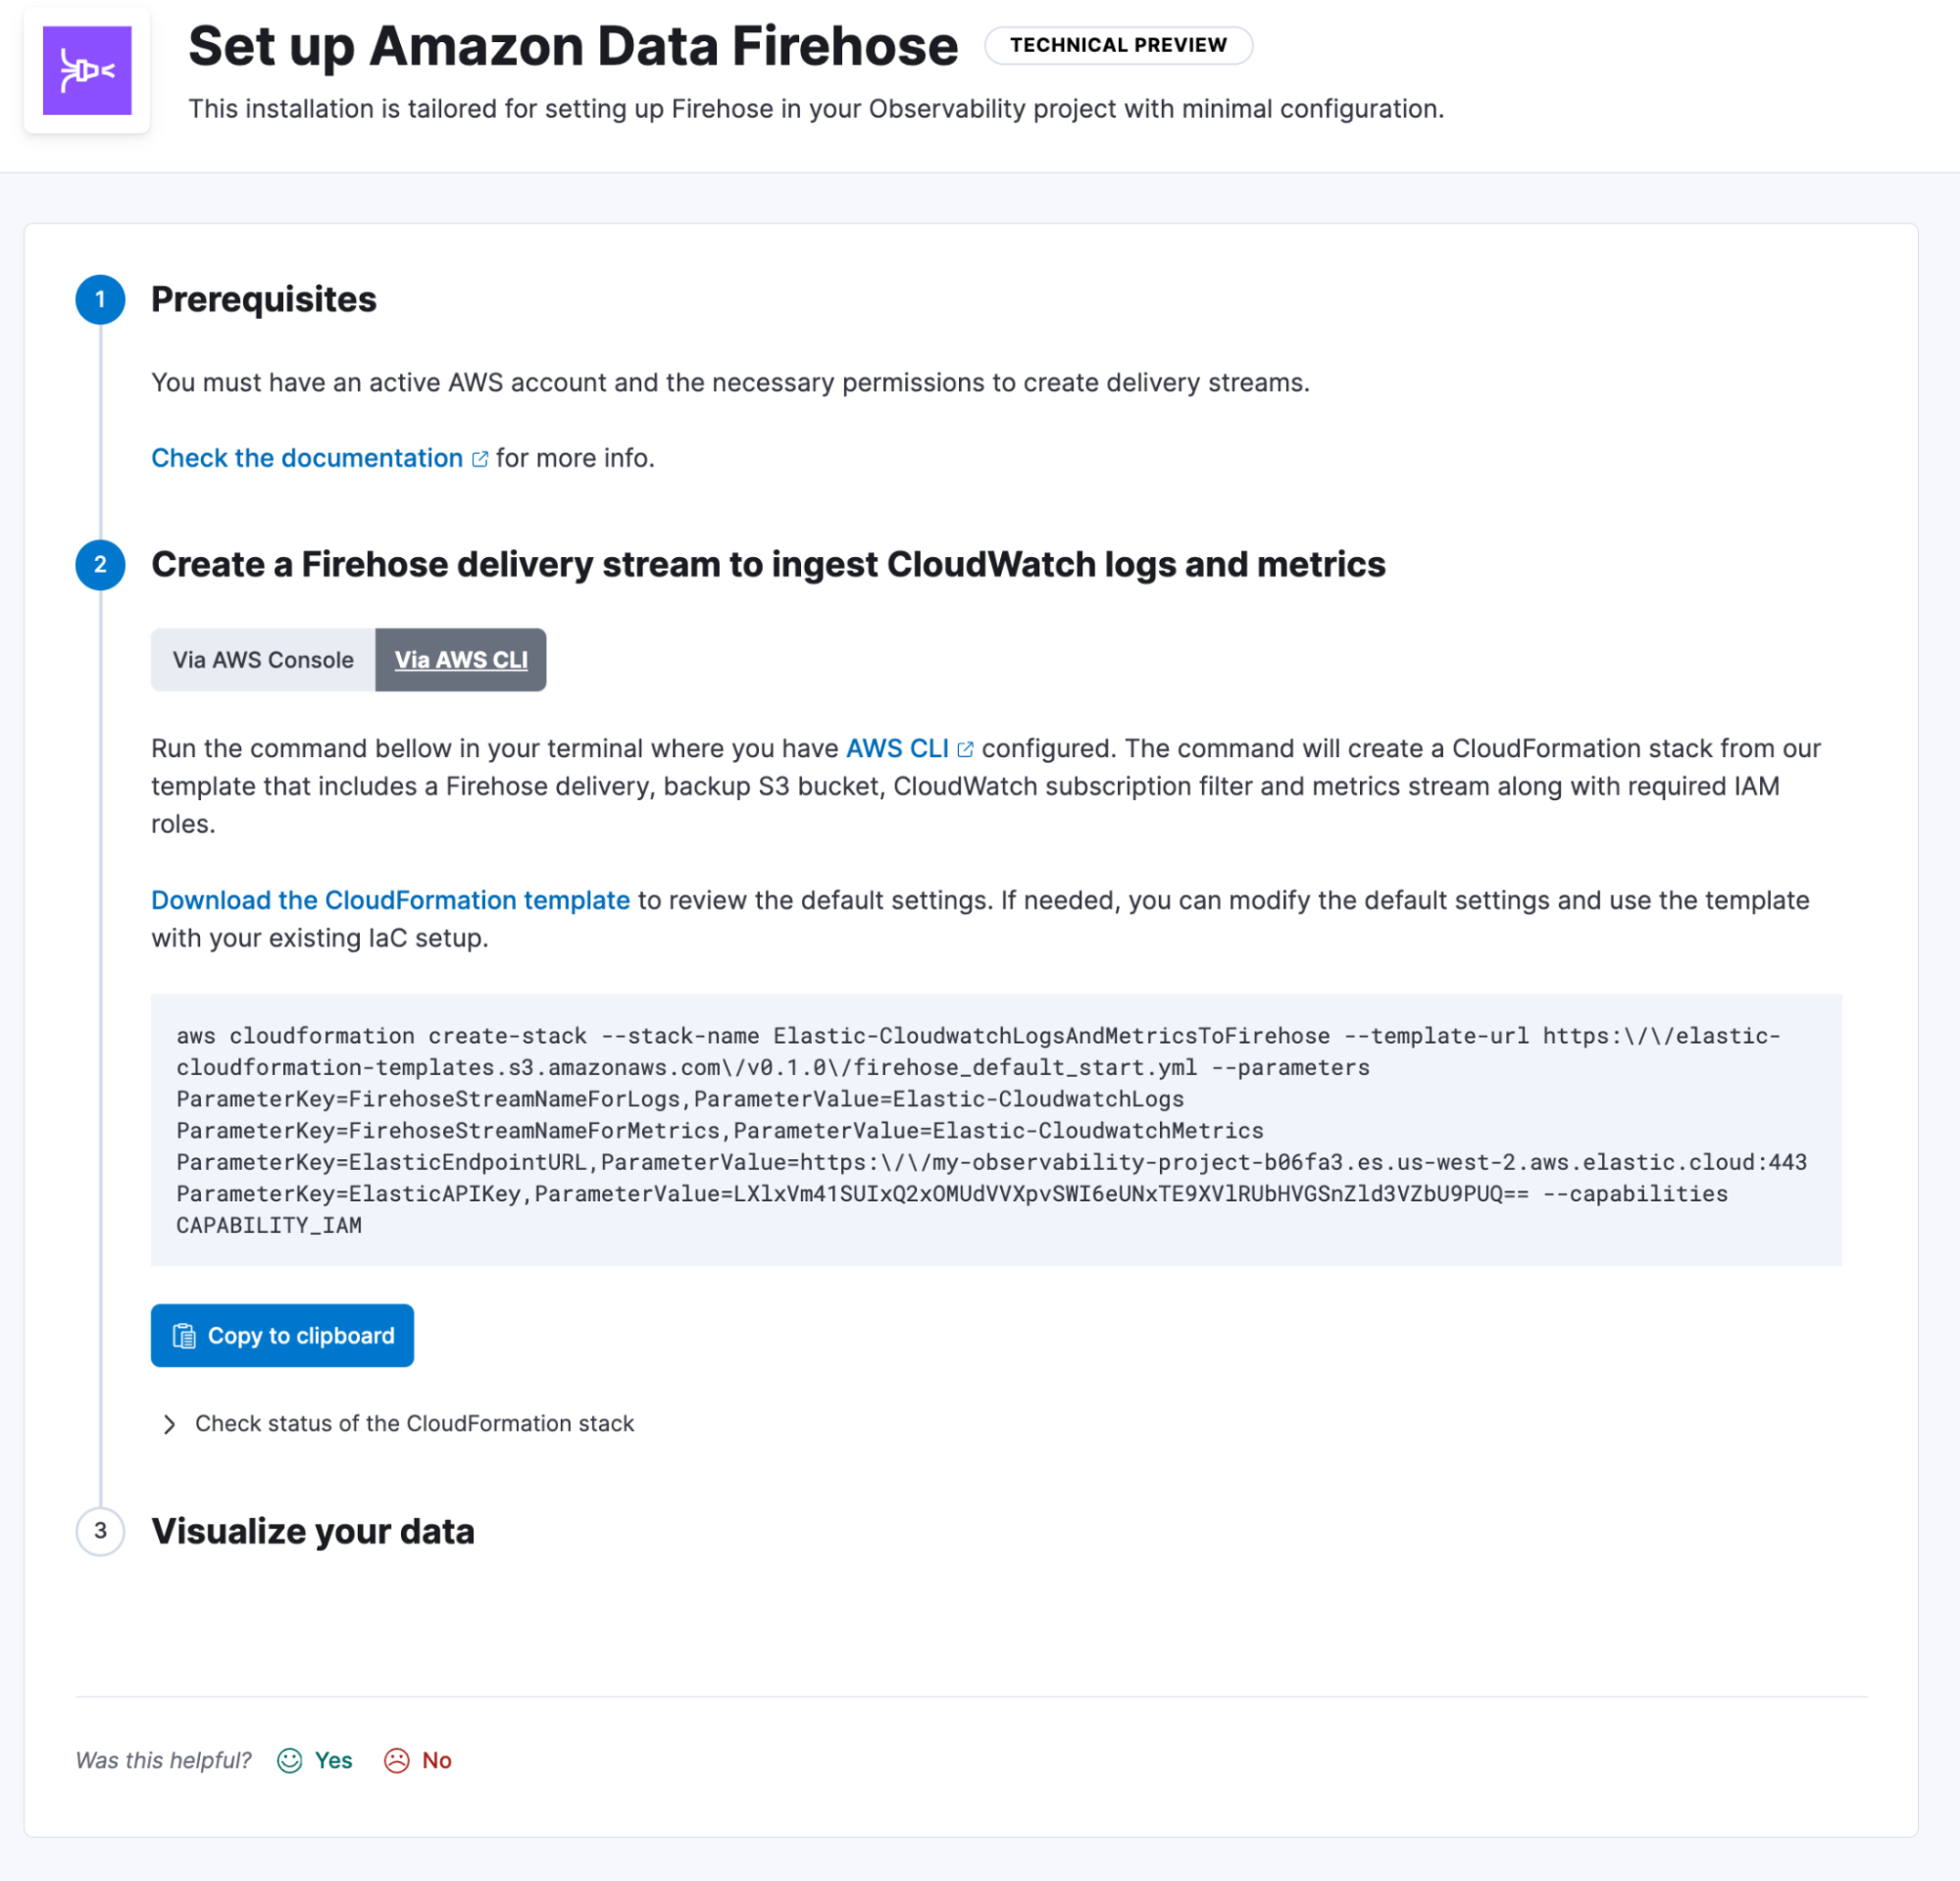
At the end of this guided workflow, users are provided a link to the appropriate prebuilt dashboard or curated UI to explore their data on a per-service basis.
New and enhanced integrations
Salesforce integration
We're announcing the general availability (GA) of our updated and revamped Salesforce integration. It now works more seamlessly to connect to, collect, and ingest data from Salesforce, providing better visibility into your Salesforce environment.
MongoDB Atlas integration
This new integration offers comprehensive observability and monitoring of MongoDB Atlas performance and health through the collection and analysis of logs and metrics. This integration is in beta.
Amazon Data Firehose CloudWatch metrics support
Elastic's integration with Amazon Data Firehose now includes the ability to stream and route CloudWatch metrics to the right destination within Elastic. With this support, you can now stream both logs and metrics seamlessly via Amazon Data Firehose into Elastic, providing a more complete view of their AWS environment. This integration is in beta.
Hosts moving to GA
Detect and resolve problems with your hosts
We are moving our hosts feature to GA to help you detect and resolve problems with your hosts.

The host feature will help you by:
Onboarding your hosts quickly with effortless onboarding journeys (via OTel)
- Seeing what needs attention using alerting and beginning RCA following alerting workflows
- Comparing host performance metrics to find the root cause
- Spotting dependencies by seeing which APM-instrumented services are running on your host
- Identifying resource bottlenecks by viewing the processes and threads (via Universal Profiling)
New inventory
See what you have and what needs attention
Inventory will be the single place where you can find what you have and what needs attention — even just with logs.

Our technical preview release of this capability will allow you to:
View your hosts, containers, and services even if you only collect logs
- See what needs attention using alerting and beginning RCA following alerting workflows
- Perform seamless service analysis using workflows between Discover and Services
Synthetic monitoring enhancements
Dramatically improved alerting capabilities
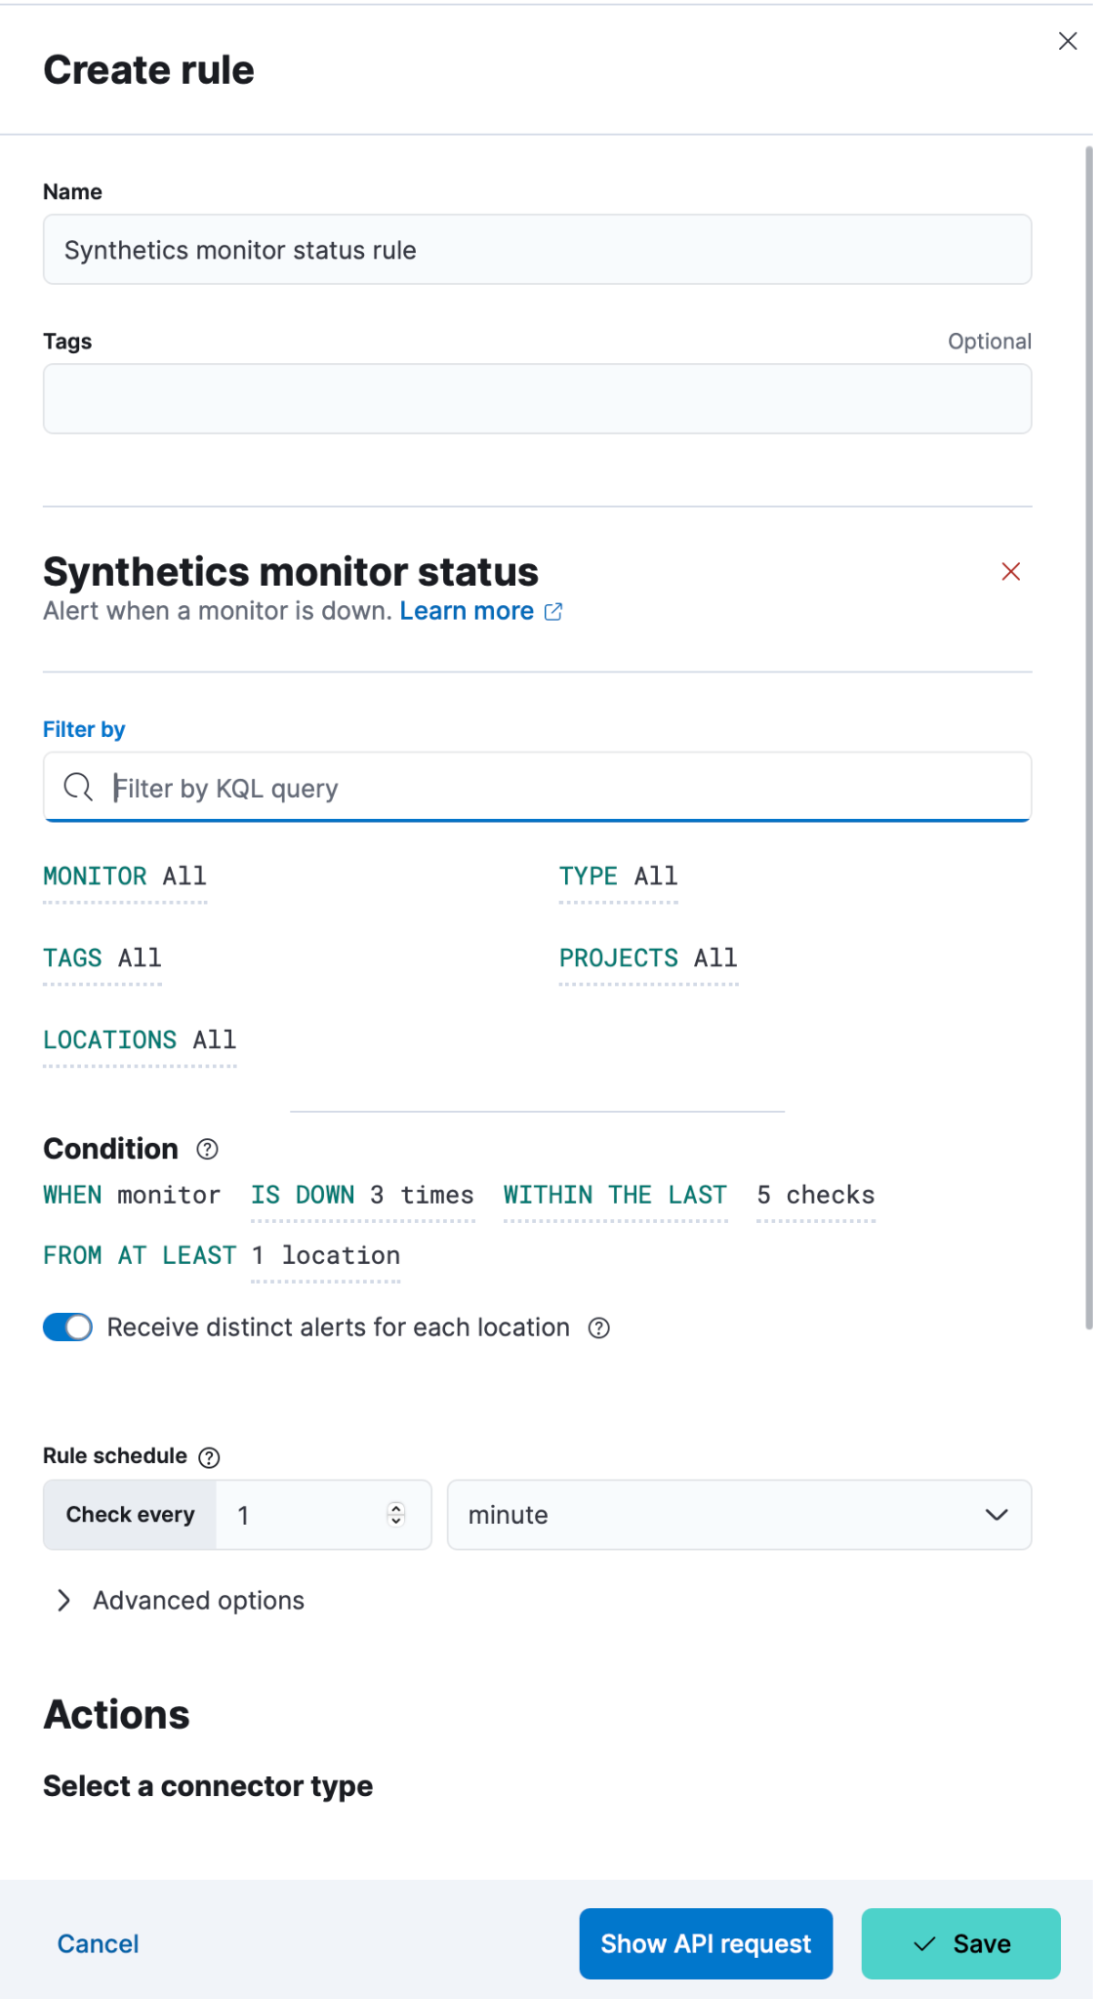
With the 8.16 release, Elastic synthetic monitoring users now have enhanced control over alert customization in Elastic Observability. Users can set flexible conditions, including the number of monitor downtimes, specific test locations, and applicable tags. Multiple alert rules can also be configured for tailored monitoring.
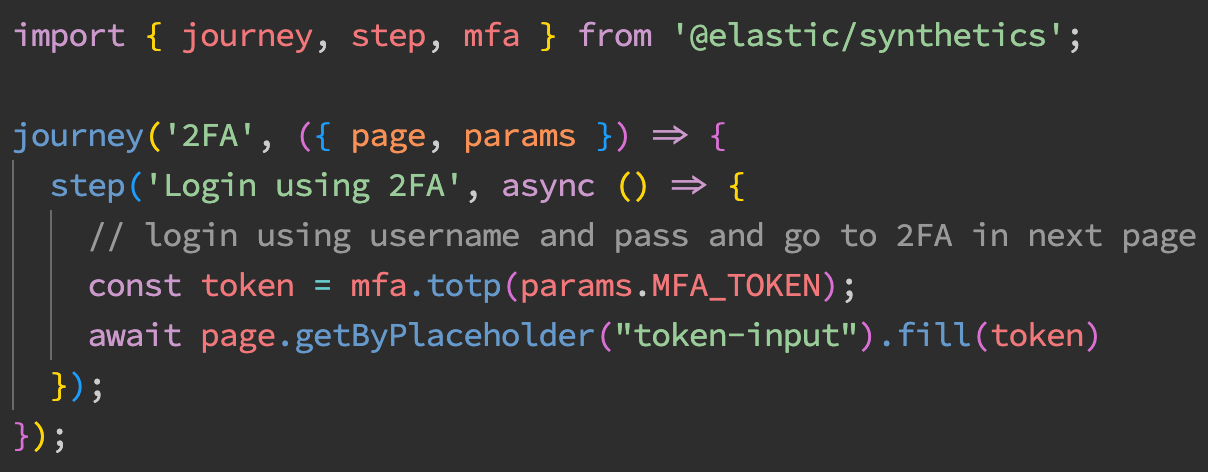
First-class support for testing user journeys with multifactor authentication (MFA)
We're excited to announce that Elastic synthetic monitoring now includes first-class multifactor authentication (MFA) support, making secure testing of protected applications easier than ever. This enhancement empowers users to fully automate tests on secure applications without needing UI interactions for the generation of authentication codes — delivering smoother and more secure synthetic monitoring workflows on both inline- and project-based journeys. Learn more in our documentation.
Try it out
Read about these capabilities and more in the release notes.
Existing Elastic Cloud customers can access many of these features directly from the Elastic Cloud console. Not taking advantage of Elastic on cloud? Start a free trial.
The release and timing of any features or functionality described in this post remain at Elastic's sole discretion. Any features or functionality not currently available may not be delivered on time or at all.
In this blog post, we may have used or referred to third party generative AI tools, which are owned and operated by their respective owners. Elastic does not have any control over the third party tools and we have no responsibility or liability for their content, operation or use, nor for any loss or damage that may arise from your use of such tools. Please exercise caution when using AI tools with personal, sensitive or confidential information. Any data you submit may be used for AI training or other purposes. There is no guarantee that information you provide will be kept secure or confidential. You should familiarize yourself with the privacy practices and terms of use of any generative AI tools prior to use.
Elastic, Elasticsearch, ESRE, Elasticsearch Relevance Engine and associated marks are trademarks, logos or registered trademarks of Elasticsearch N.V. in the United States and other countries. All other company and product names are trademarks, logos or registered trademarks of their respective owners.