WARNING: Version 6.0 of Metricbeat has passed its EOL date.
This documentation is no longer being maintained and may be removed. If you are running this version, we strongly advise you to upgrade. For the latest information, see the current release documentation.
How Metricbeat works
editHow Metricbeat works
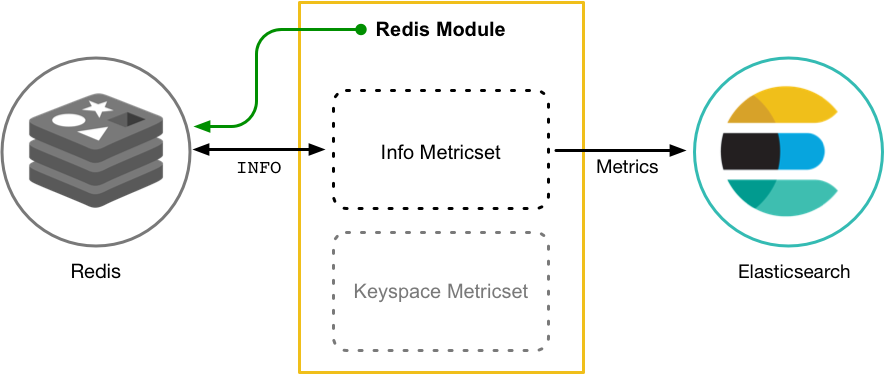
editMetricbeat consists of modules and metricsets. A Metricbeat module defines the basic logic for collecting data from a specific service, such as Redis, MySQL, and so on. The module specifies details about the service, including how to connect, how often to collect metrics, and which metrics to collect.
Each module has one or more metricsets. A metricset is the part of the module
that fetches and structures the data. Rather than collecting each metric as a
separate event, metricsets retrieve a list of multiple related metrics in a single request
to the remote system. So, for example, the Redis module provides an info
metricset that collects information and statistics from Redis by running the
INFO command and parsing the returned result.
Likewise, the MySQL module provides a status metricset that collects data
from MySQL by running a SHOW GLOBAL STATUS
SQL query. Metricsets make it easier for you by grouping sets of related metrics together
in a single request returned by the remote server.
Metricbeat retrieves metrics by periodically interrogating the host system based
on the period value that you specify when you configure the module. Because multiple
metricsets can send requests to the same service, Metricbeat reuses connections
whenever possible. If Metricbeat cannot connect to the host system within the time
specified by the timeout config setting, it returns an error. Metricbeat sends
the events asynchronously, which means the event retrieval is not acknowledged. If
the configured output is not available, events may be lost.
When Metricbeat encounters an error (for example, when it cannot connect to the host system), it sends an event error to the specified output. This means that Metricbeat always sends an event, even when there is a failure. This allows you to monitor for errors and see debug messages to help you diagnose what went wrong.
The following topics provide more detail about the structure of Metricbeat events:
For more about the benefits of using Metricbeat, see Key metricbeat features.