- Elasticsearch Guide: other versions:
- Getting Started
- Set up Elasticsearch
- Installing Elasticsearch
- Configuring Elasticsearch
- Important Elasticsearch configuration
- Important System Configuration
- Bootstrap Checks
- Heap size check
- File descriptor check
- Memory lock check
- Maximum number of threads check
- Max file size check
- Maximum size virtual memory check
- Maximum map count check
- Client JVM check
- Use serial collector check
- System call filter check
- OnError and OnOutOfMemoryError checks
- Early-access check
- G1GC check
- All permission check
- Starting Elasticsearch
- Stopping Elasticsearch
- Adding nodes to your cluster
- Installing X-Pack
- Set up X-Pack
- Configuring X-Pack Java Clients
- X-Pack Settings
- Bootstrap Checks for X-Pack
- Upgrade Elasticsearch
- API Conventions
- Document APIs
- Search APIs
- Aggregations
- Metrics Aggregations
- Avg Aggregation
- Cardinality Aggregation
- Extended Stats Aggregation
- Geo Bounds Aggregation
- Geo Centroid Aggregation
- Max Aggregation
- Min Aggregation
- Percentiles Aggregation
- Percentile Ranks Aggregation
- Scripted Metric Aggregation
- Stats Aggregation
- Sum Aggregation
- Top Hits Aggregation
- Value Count Aggregation
- Bucket Aggregations
- Adjacency Matrix Aggregation
- Children Aggregation
- Composite Aggregation
- Date Histogram Aggregation
- Date Range Aggregation
- Diversified Sampler Aggregation
- Filter Aggregation
- Filters Aggregation
- Geo Distance Aggregation
- GeoHash grid Aggregation
- Global Aggregation
- Histogram Aggregation
- IP Range Aggregation
- Missing Aggregation
- Nested Aggregation
- Range Aggregation
- Reverse nested Aggregation
- Sampler Aggregation
- Significant Terms Aggregation
- Significant Text Aggregation
- Terms Aggregation
- Pipeline Aggregations
- Avg Bucket Aggregation
- Derivative Aggregation
- Max Bucket Aggregation
- Min Bucket Aggregation
- Sum Bucket Aggregation
- Stats Bucket Aggregation
- Extended Stats Bucket Aggregation
- Percentiles Bucket Aggregation
- Moving Average Aggregation
- Cumulative Sum Aggregation
- Bucket Script Aggregation
- Bucket Selector Aggregation
- Bucket Sort Aggregation
- Serial Differencing Aggregation
- Matrix Aggregations
- Caching heavy aggregations
- Returning only aggregation results
- Aggregation Metadata
- Returning the type of the aggregation
- Metrics Aggregations
- Indices APIs
- Create Index
- Delete Index
- Get Index
- Indices Exists
- Open / Close Index API
- Shrink Index
- Split Index
- Rollover Index
- Put Mapping
- Get Mapping
- Get Field Mapping
- Types Exists
- Index Aliases
- Update Indices Settings
- Get Settings
- Analyze
- Index Templates
- Indices Stats
- Indices Segments
- Indices Recovery
- Indices Shard Stores
- Clear Cache
- Flush
- Refresh
- Force Merge
- cat APIs
- Cluster APIs
- Query DSL
- Mapping
- Analysis
- Anatomy of an analyzer
- Testing analyzers
- Analyzers
- Normalizers
- Tokenizers
- Standard Tokenizer
- Letter Tokenizer
- Lowercase Tokenizer
- Whitespace Tokenizer
- UAX URL Email Tokenizer
- Classic Tokenizer
- Thai Tokenizer
- NGram Tokenizer
- Edge NGram Tokenizer
- Keyword Tokenizer
- Pattern Tokenizer
- Simple Pattern Tokenizer
- Simple Pattern Split Tokenizer
- Path Hierarchy Tokenizer
- Path Hierarchy Tokenizer Examples
- Token Filters
- Standard Token Filter
- ASCII Folding Token Filter
- Flatten Graph Token Filter
- Length Token Filter
- Lowercase Token Filter
- Uppercase Token Filter
- NGram Token Filter
- Edge NGram Token Filter
- Porter Stem Token Filter
- Shingle Token Filter
- Stop Token Filter
- Word Delimiter Token Filter
- Word Delimiter Graph Token Filter
- Stemmer Token Filter
- Stemmer Override Token Filter
- Keyword Marker Token Filter
- Keyword Repeat Token Filter
- KStem Token Filter
- Snowball Token Filter
- Phonetic Token Filter
- Synonym Token Filter
- Synonym Graph Token Filter
- Compound Word Token Filters
- Reverse Token Filter
- Elision Token Filter
- Truncate Token Filter
- Unique Token Filter
- Pattern Capture Token Filter
- Pattern Replace Token Filter
- Trim Token Filter
- Limit Token Count Token Filter
- Hunspell Token Filter
- Common Grams Token Filter
- Normalization Token Filter
- CJK Width Token Filter
- CJK Bigram Token Filter
- Delimited Payload Token Filter
- Keep Words Token Filter
- Keep Types Token Filter
- Classic Token Filter
- Apostrophe Token Filter
- Decimal Digit Token Filter
- Fingerprint Token Filter
- Minhash Token Filter
- Character Filters
- Modules
- Index Modules
- Ingest Node
- Pipeline Definition
- Ingest APIs
- Accessing Data in Pipelines
- Handling Failures in Pipelines
- Processors
- Append Processor
- Convert Processor
- Date Processor
- Date Index Name Processor
- Fail Processor
- Foreach Processor
- Grok Processor
- Gsub Processor
- Join Processor
- JSON Processor
- KV Processor
- Lowercase Processor
- Remove Processor
- Rename Processor
- Script Processor
- Set Processor
- Split Processor
- Sort Processor
- Trim Processor
- Uppercase Processor
- Dot Expander Processor
- URL Decode Processor
- SQL Access
- Monitor a cluster
- Rolling up historical data
- Secure a cluster
- Overview
- Configuring security
- Encrypting communications in Elasticsearch
- Encrypting communications in an Elasticsearch Docker container
- Enabling cipher suites for stronger encryption
- Separating node-to-node and client traffic
- Configuring an Active Directory realm
- Configuring a file realm
- Configuring an LDAP realm
- Configuring a native realm
- Configuring a PKI realm
- Configuring a SAML realm
- Security settings
- Auditing settings
- Getting started with security
- How security works
- User authentication
- Configuring SAML single-sign-on on the Elastic Stack
- User authorization
- Auditing security events
- Encrypting communications
- Restricting connections with IP filtering
- Cross cluster search, tribe, clients, and integrations
- Reference
- Troubleshooting
- Can’t log in after upgrading to 6.3.2
- Some settings are not returned via the nodes settings API
- Authorization exceptions
- Users command fails due to extra arguments
- Users are frequently locked out of Active Directory
- Certificate verification fails for curl on Mac
- SSLHandshakeException causes connections to fail
- Common SSL/TLS exceptions
- Common SAML issues
- Internal Server Error in Kibana
- Setup-passwords command fails due to connection failure
- Failures due to relocation of the configuration files
- Limitations
- Alerting on Cluster and Index Events
- X-Pack APIs
- Info API
- Explore API
- Licensing APIs
- Migration APIs
- Machine Learning APIs
- Add Events to Calendar
- Add Jobs to Calendar
- Close Jobs
- Create Calendar
- Create Datafeeds
- Create Jobs
- Delete Calendar
- Delete Datafeeds
- Delete Events from Calendar
- Delete Jobs
- Delete Jobs from Calendar
- Delete Model Snapshots
- Flush Jobs
- Forecast Jobs
- Get Calendars
- Get Buckets
- Get Overall Buckets
- Get Categories
- Get Datafeeds
- Get Datafeed Statistics
- Get Influencers
- Get Jobs
- Get Job Statistics
- Get Model Snapshots
- Get Scheduled Events
- Get Records
- Open Jobs
- Post Data to Jobs
- Preview Datafeeds
- Revert Model Snapshots
- Start Datafeeds
- Stop Datafeeds
- Update Datafeeds
- Update Jobs
- Update Model Snapshots
- Rollup APIs
- Security APIs
- Authenticate API
- Change passwords API
- Clear Cache API
- Create or update role mappings API
- Clear roles cache API
- Create or update roles API
- Create or update users API
- Delete role mappings API
- Delete roles API
- Delete users API
- Disable users API
- Enable users API
- Get role mappings API
- Get roles API
- Get token API
- Get users API
- Privilege APIs
- Invalidate token API
- SSL Certificate API
- Watcher APIs
- Definitions
- Command line tools
- How To
- Testing
- Glossary of terms
- Release Highlights
- Breaking changes
- Release Notes
- Elasticsearch version 6.3.2
- Elasticsearch version 6.3.1
- Elasticsearch version 6.3.0
- Elasticsearch version 6.2.4
- Elasticsearch version 6.2.3
- Elasticsearch version 6.2.2
- Elasticsearch version 6.2.1
- Elasticsearch version 6.2.0
- Elasticsearch version 6.1.4
- Elasticsearch version 6.1.3
- Elasticsearch version 6.1.2
- Elasticsearch version 6.1.1
- Elasticsearch version 6.1.0
- Elasticsearch version 6.0.1
- Elasticsearch version 6.0.0
- Elasticsearch version 6.0.0-rc2
- Elasticsearch version 6.0.0-rc1
- Elasticsearch version 6.0.0-beta2
- Elasticsearch version 6.0.0-beta1
- Elasticsearch version 6.0.0-alpha2
- Elasticsearch version 6.0.0-alpha1
- Elasticsearch version 6.0.0-alpha1 (Changes previously released in 5.x)
Starting Elasticsearch
editStarting Elasticsearch
editThe method for starting Elasticsearch varies depending on how you installed it.
Archive packages (.tar.gz)
editIf you installed Elasticsearch with a .tar.gz package, you can start Elasticsearch from the
command line.
Running Elasticsearch from the command line
editElasticsearch can be started from the command line as follows:
./bin/elasticsearch
By default, Elasticsearch runs in the foreground, prints its logs to the
standard output (stdout), and can be stopped by pressing Ctrl-C.
All scripts packaged with Elasticsearch require a version of Bash
that supports arrays and assume that Bash is available at /bin/bash.
As such, Bash should be available at this path either directly or via a
symbolic link.
Running as a daemon
editTo run Elasticsearch as a daemon, specify -d on the command line, and record
the process ID in a file using the -p option:
./bin/elasticsearch -d -p pid
Log messages can be found in the $ES_HOME/logs/ directory.
To shut down Elasticsearch, kill the process ID recorded in the pid file:
kill `cat pid`
Archive packages (.zip)
editIf you installed Elasticsearch on Windows with a .zip package, you can start Elasticsearch from
the command line. If you want Elasticsearch to start automatically at boot time without
any user interaction, install Elasticsearch as a service.
Running Elasticsearch from the command line
editElasticsearch can be started from the command line as follows:
.\bin\elasticsearch.bat
By default, Elasticsearch runs in the foreground, prints its logs to STDOUT,
and can be stopped by pressing Ctrl-C.
Debian packages
editElasticsearch is not started automatically after installation. How to start
and stop Elasticsearch depends on whether your system uses SysV init or
systemd (used by newer distributions). You can tell which is being used by
running this command:
ps -p 1
Running Elasticsearch with SysV init
editUse the update-rc.d command to configure Elasticsearch to start automatically
when the system boots up:
sudo update-rc.d elasticsearch defaults 95 10
Elasticsearch can be started and stopped using the service command:
sudo -i service elasticsearch start
sudo -i service elasticsearch stop
If Elasticsearch fails to start for any reason, it will print the reason for
failure to STDOUT. Log files can be found in /var/log/elasticsearch/.
Running Elasticsearch with systemd
editTo configure Elasticsearch to start automatically when the system boots up, run the following commands:
sudo /bin/systemctl daemon-reload
sudo /bin/systemctl enable elasticsearch.service
Elasticsearch can be started and stopped as follows:
sudo systemctl start elasticsearch.service
sudo systemctl stop elasticsearch.service
These commands provide no feedback as to whether Elasticsearch was started
successfully or not. Instead, this information will be written in the log
files located in /var/log/elasticsearch/.
By default the Elasticsearch service doesn’t log information in the systemd
journal. To enable journalctl logging, the --quiet option must be removed
from the ExecStart command line in the elasticsearch.service file.
When systemd logging is enabled, the logging information are available using
the journalctl commands:
To tail the journal:
sudo journalctl -f
To list journal entries for the elasticsearch service:
sudo journalctl --unit elasticsearch
To list journal entries for the elasticsearch service starting from a given time:
sudo journalctl --unit elasticsearch --since "2016-10-30 18:17:16"
Check man journalctl or https://www.freedesktop.org/software/systemd/man/journalctl.html for
more command line options.
Docker images
editIf you installed a Docker image, you can start Elasticsearch from the command line. There are different methods depending on whether you’re using development mode or production mode. See Running Elasticsearch from the command line.
MSI packages
editIf you installed Elasticsearch on Windows using the .msi package, you can start Elasticsearch
from the command line. If you want it to start automatically at boot time
without any user interaction,
install Elasticsearch as a Windows service.
Running Elasticsearch from the command line
editOnce installed, Elasticsearch can be started from the command line, if not installed as a service and configured to start when installation completes, as follows:
.\bin\elasticsearch.exe
The command line terminal will display output similar to the following:
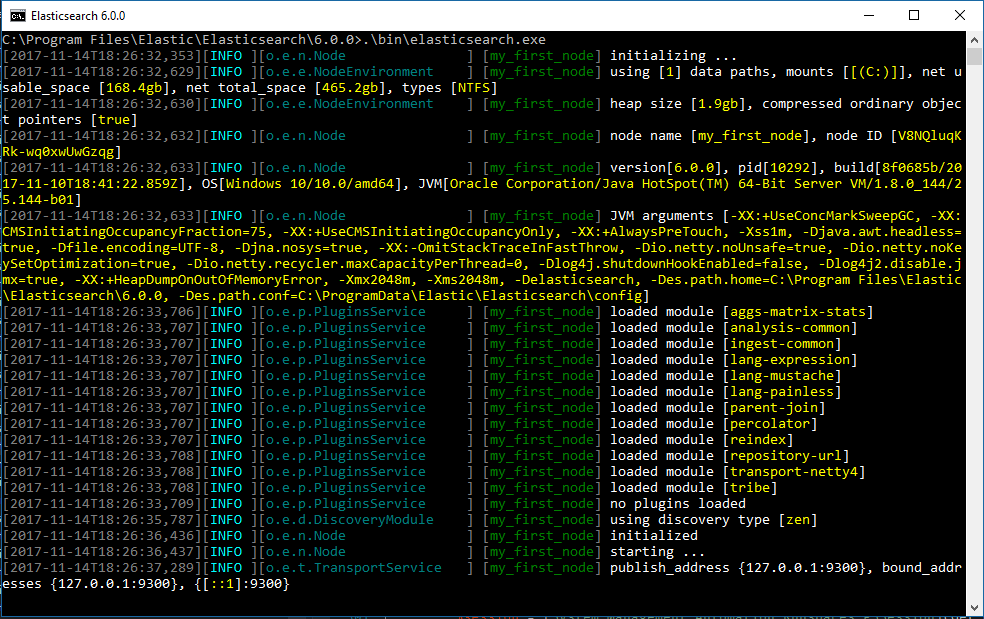
By default, Elasticsearch runs in the foreground, prints its logs to STDOUT in addition
to the <cluster name>.log file within LOGSDIRECTORY, and can be stopped by pressing Ctrl-C.
RPM packages
editElasticsearch is not started automatically after installation. How to start
and stop Elasticsearch depends on whether your system uses SysV init or
systemd (used by newer distributions). You can tell which is being used by
running this command:
ps -p 1
Running Elasticsearch with SysV init
editUse the chkconfig command to configure Elasticsearch to start automatically
when the system boots up:
sudo chkconfig --add elasticsearch
Elasticsearch can be started and stopped using the service command:
sudo -i service elasticsearch start
sudo -i service elasticsearch stop
If Elasticsearch fails to start for any reason, it will print the reason for
failure to STDOUT. Log files can be found in /var/log/elasticsearch/.
Running Elasticsearch with systemd
editTo configure Elasticsearch to start automatically when the system boots up, run the following commands:
sudo /bin/systemctl daemon-reload
sudo /bin/systemctl enable elasticsearch.service
Elasticsearch can be started and stopped as follows:
sudo systemctl start elasticsearch.service
sudo systemctl stop elasticsearch.service
These commands provide no feedback as to whether Elasticsearch was started
successfully or not. Instead, this information will be written in the log
files located in /var/log/elasticsearch/.
By default the Elasticsearch service doesn’t log information in the systemd
journal. To enable journalctl logging, the --quiet option must be removed
from the ExecStart command line in the elasticsearch.service file.
When systemd logging is enabled, the logging information are available using
the journalctl commands:
To tail the journal:
sudo journalctl -f
To list journal entries for the elasticsearch service:
sudo journalctl --unit elasticsearch
To list journal entries for the elasticsearch service starting from a given time:
sudo journalctl --unit elasticsearch --since "2016-10-30 18:17:16"
Check man journalctl or https://www.freedesktop.org/software/systemd/man/journalctl.html for
more command line options.
On this page
- Archive packages (
.tar.gz) - Running Elasticsearch from the command line
- Running as a daemon
- Archive packages (
.zip) - Running Elasticsearch from the command line
- Debian packages
- Running Elasticsearch with SysV
init - Running Elasticsearch with
systemd - Docker images
- MSI packages
- Running Elasticsearch from the command line
- RPM packages
- Running Elasticsearch with SysV
init - Running Elasticsearch with
systemd