What’s new in 8.17
editWhat’s new in 8.17
editHere are the highlights of what’s new and improved in 8.17. For detailed information about this release, check the release notes.
Previous versions: 8.16 | 8.15 | 8.14 | 8.13 | 8.12 | 8.11 | 8.10 | 8.9 | 8.8 | 8.7 | 8.6 | 8.5 | 8.4 | 8.3 | 8.2 | 8.1 | 8.0
Discover and ES|QL
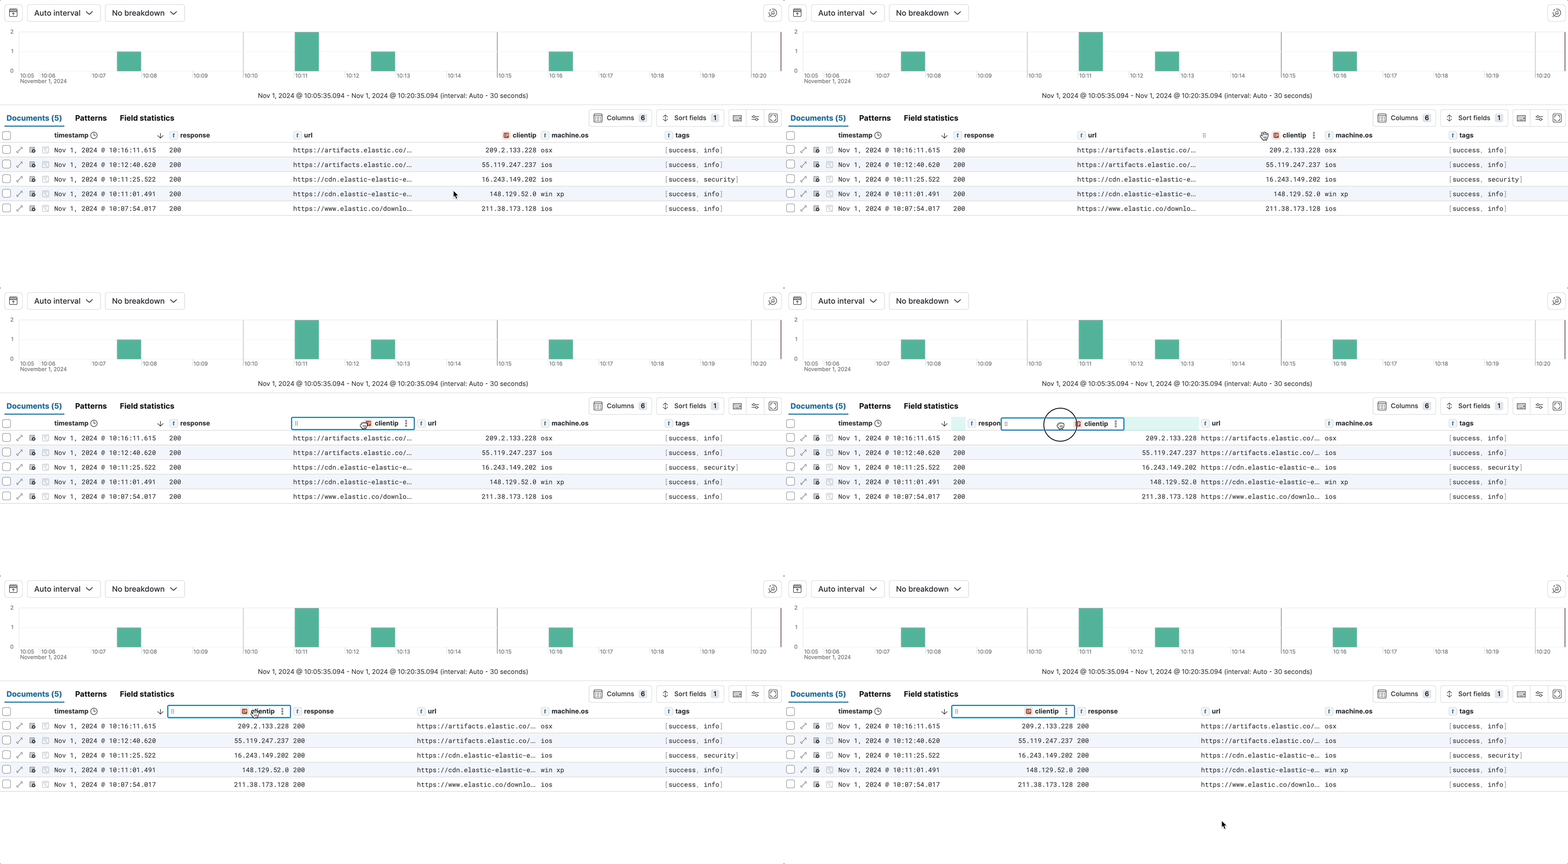
editImproving column reordering with draggable columns
editWe’re excited to announce an enhancement to the Discover table. You can now reorder columns by simply dragging them directly in the data table header. This intuitive feature reduces the number of interactions required to adjust your column layout by eliminating the need to open the Columns popover for sorting. This enhancement saves users valuable time and improves overall usability, leading to smoother and more efficient data exploration.
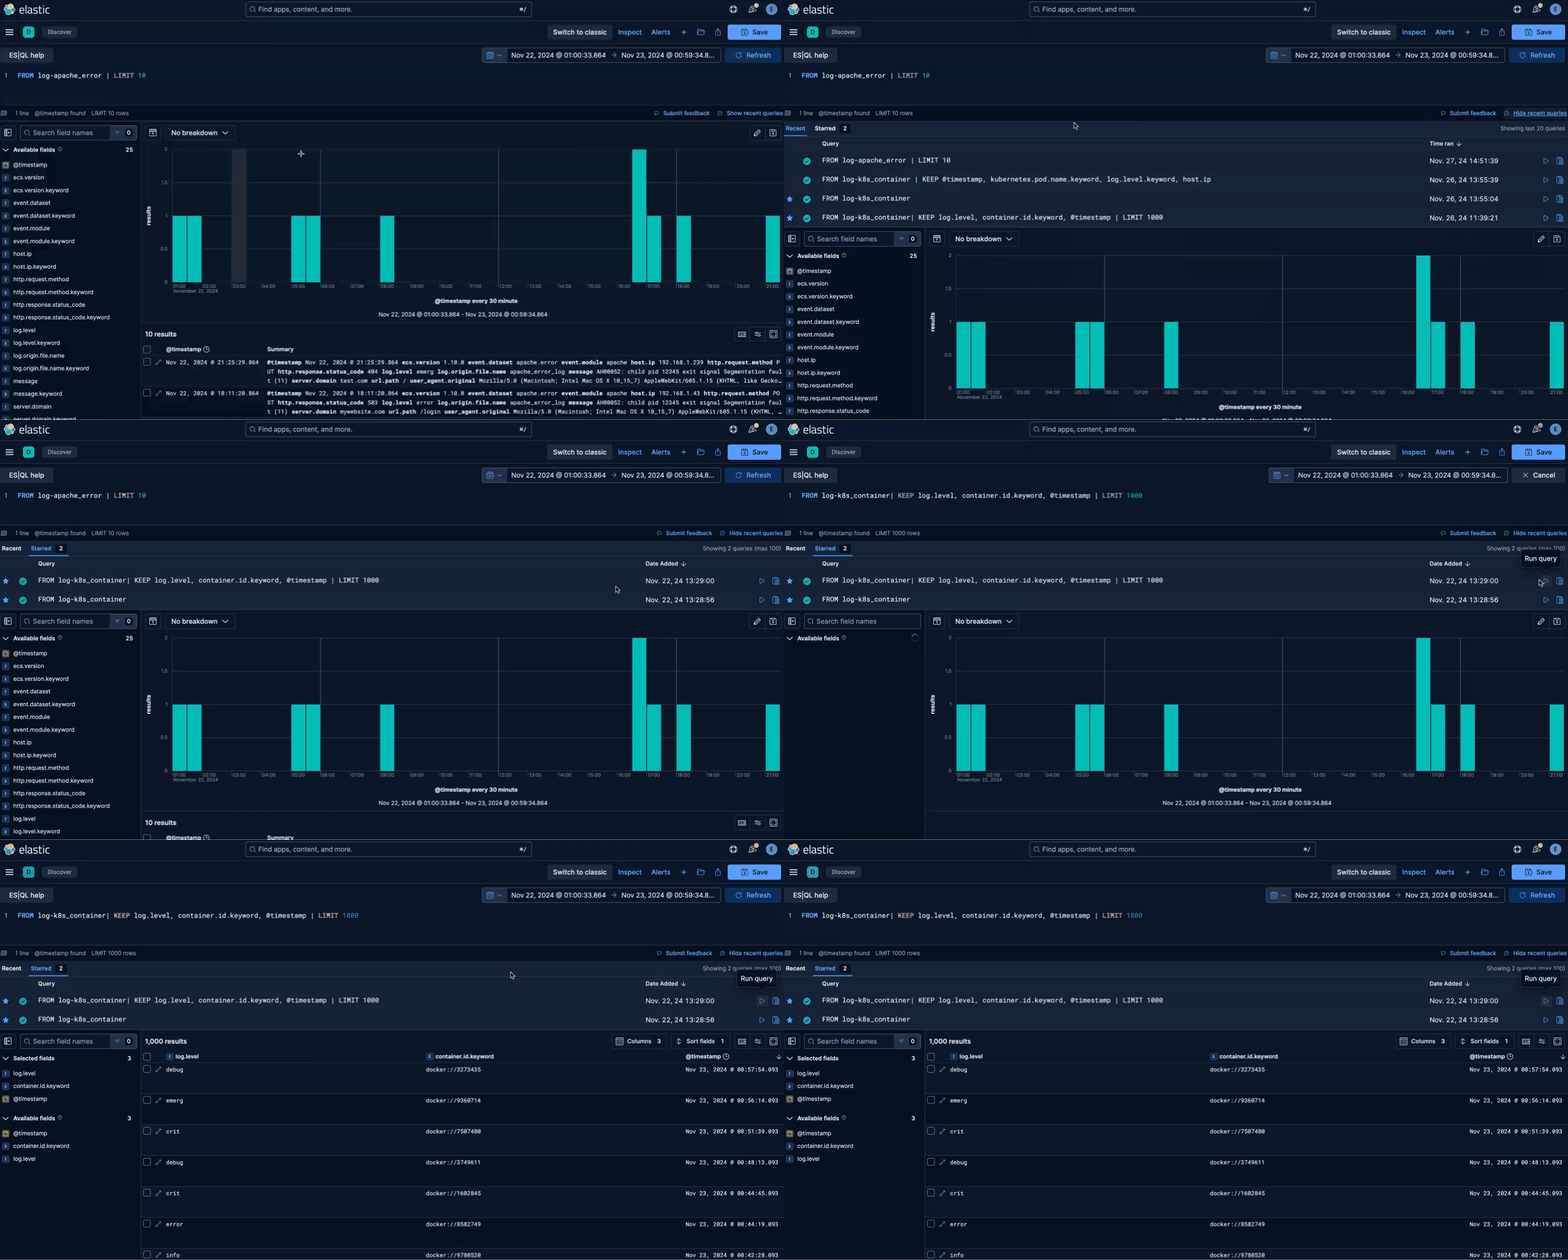
Starred ES|QL queries for quick access and reusability
editWith this release, you can bookmark your ES|QL queries directly from your query history by starring them. These starred queries are saved under a dedicated Starred tab, allowing you quick access to your most-used queries across Kibana – not just within Discover. You can reuse these queries in other areas of Kibana, such as the dashboard in-line editor and alerts. With the ability to manage up to 100 starred queries per user, you can sort them by timestamp and receive warnings as you approach the limit.
Dashboards
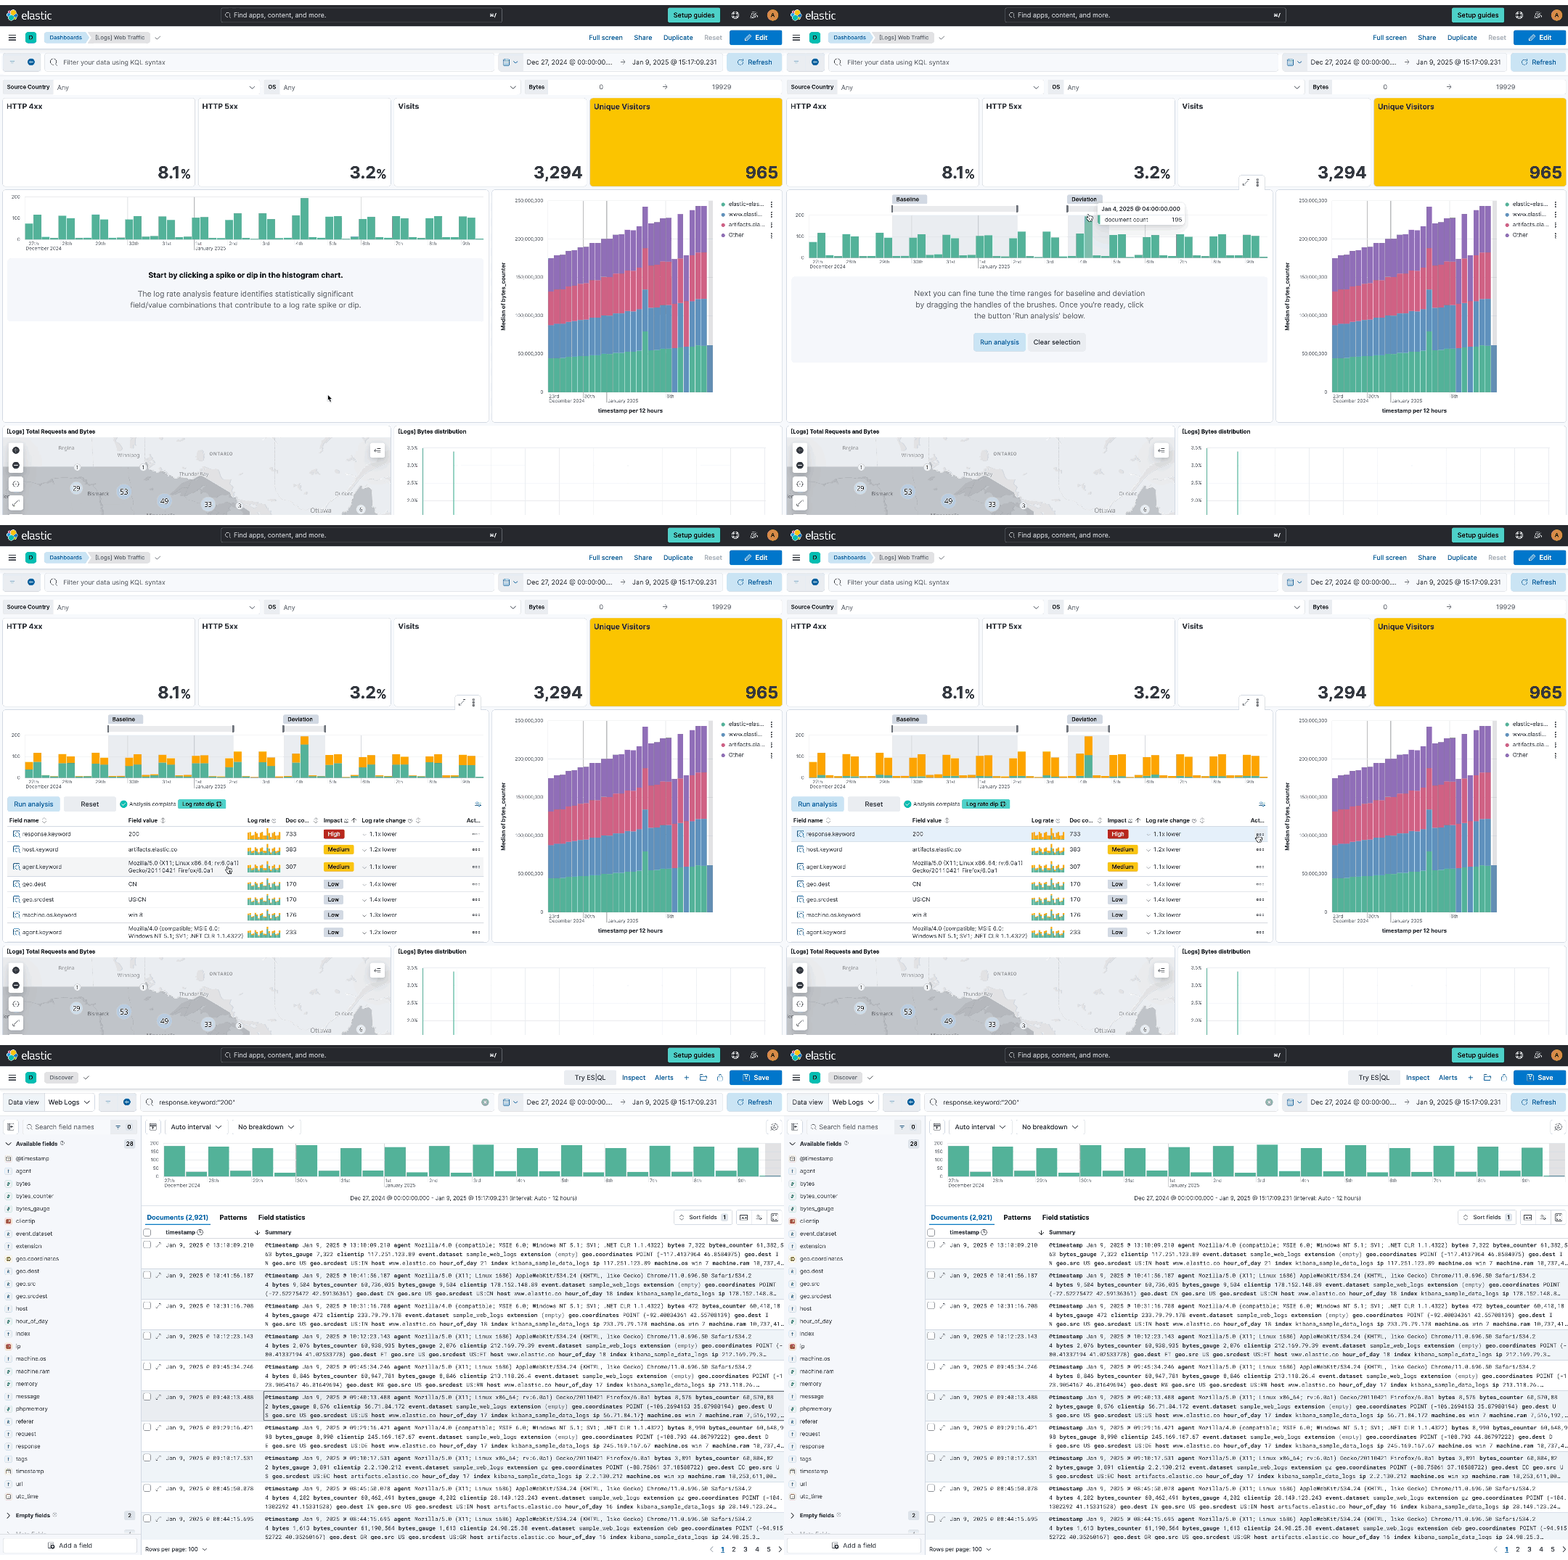
editLog Rate panels
editYou can now add Log Rate Analysis panels to your dashboards. Find them in the Logs analysis section alongside Log Pattern Analysis panels from 8.16. Find field-value pairs and log patterns that correlate with log spikes or dips across thousands of logs with just a few clicks, and move your analysis to Discover with ease.
Dashboard hover actions
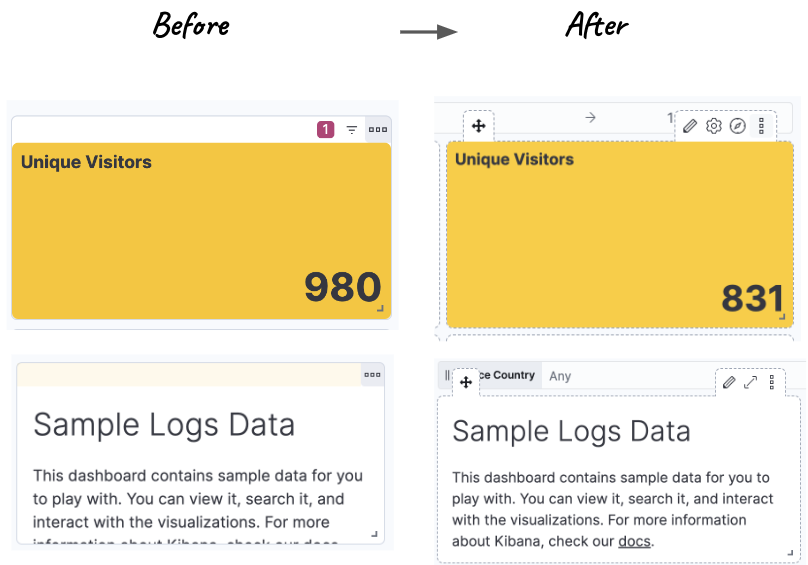
editWe received feedback from users that the View and Edit modes in dashboards look too different, mainly because of the top bar in each panel that shows the panel menu. This bar created visual problems and changed the height of panels in Edit mode, especially when they didn’t have a title.
We fixed the issue by removing this top bar and making panel information and actions appear on top of the panel when users hover over it. Now users can get the same look in both Edit and View modes and the most common actions are accessible without having to click on the panel menu. This change improves the look and usability of dashboards.
Legacy visualization editors
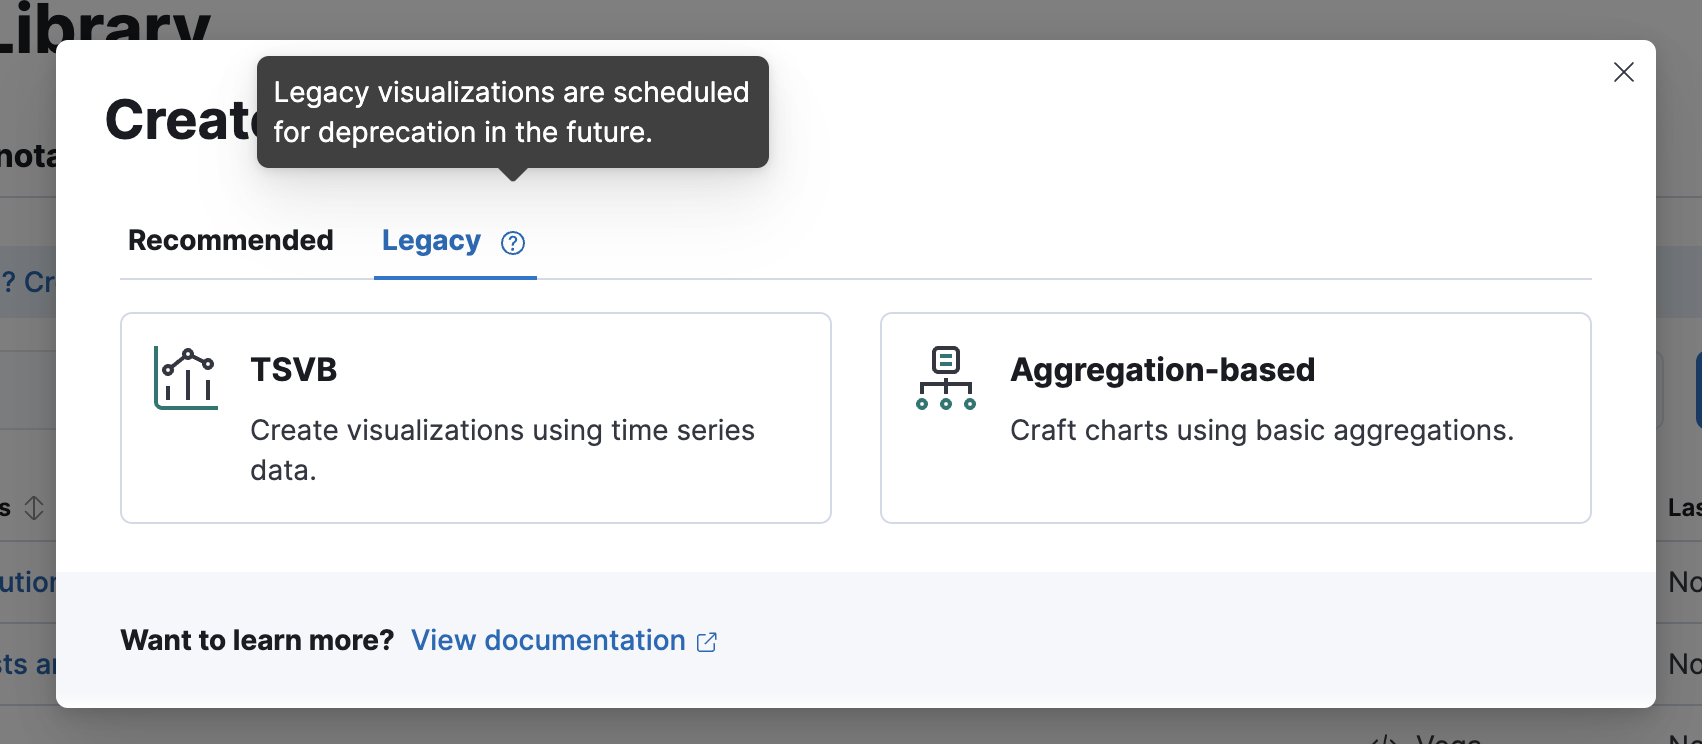
editLens is the preferred visualization editor over TSVB and Aggregation-based since it already incorporates most features of the other two editors and is much easier to use. Offering three editors at this point makes the product more complex and calls for users to learn three different ways to visualize their data for no reason.
However, we are aware that there are still a few features that Lens is missing, such as small multiples or the ability to insert data and change the CSS in a Markdown file. For this reason, TSVB and Aggregation-based editors are being marked as legacy for now to encourage shifting to Lens. We will continue supporting them for some time until all features are fully incorporated into Lens, but we recommend that you start using Lens if you can. If you have good reasons to keep using TSVB or Aggregation-based editors, please add a comment to this public Github issue.
Improving CSV download for tables
editWhen exporting tables in CSV in the past, you may have encountered issues with incorrect formatting of the data, rows, and columns. These issues have now been addressed and your exported CSV file shows exactly what you see in Kibana.

Exported CSV in the past

Exported CSV now
Alerting, cases, and connectors
editAlerting scalability improvements
editThe Kibana alerting framework delivers enhanced scalability to meet the demands of growing workloads and is available across all Elastic Cloud hosted deployments. These improvements will provide you with 10x the existing capacity to run task-manager tasks — alerting rules, connector actions, etc. We are observing the following performance improvements on early adopters of the new Kibana alerting framework:
- 10x reduction in alerting task delays
- 2x increase in task execution throughput on average
- 50% fewer requests to Elasticsearch, resulting in lower overhead
These customers are now enjoying higher alerting capacity and faster response times without the need for any additional configuration or hardware. Furthermore, these improvements also bring in a new unparalleled scalability for our largest alerting customers, enabling deployments of up to 192 Kibana nodes running alerting rules.
We are very excited to see how these enhancements empower your alerting strategies with faster, more efficient, and scalable performance.
Support for case file attachments through API actions
editThe latest enhancements to Kibana Cases introduce highly requested functionality for managing security incidents and workflows. You can now use the public API to attach files to cases to enrich them with supporting documentation, evidence, and other critical information. This improvement marks a significant enhancement in case management, providing incident response teams with greater flexibility to include all relevant details directly within their cases.
Additionally, this release expands integration capabilities with third-party systems such as ServiceNow and Tines. You can now programmatically update cases through API calls from external platforms, streamlining workflows and fostering seamless collaboration across tools. These features make it easier to automate case updates and efficiently track complex security incidents in real time. For more details, check out the API documentation.
Jira Connector now supports Jira Data Center
editThis release introduces support for Jira Data Center, expanding the existing integration capabilities previously available only for Jira Cloud instances. With this enhancement, organizations using on-premises Jira Data Center can now seamlessly integrate with Kibana, enabling more efficient workflows and streamlined incident management.
With this update, users can create and manage Jira issues directly from Kibana, regardless of their Jira deployment model. This expanded compatibility highlights our commitment to supporting diverse customer deployment setups and delivering enhanced functionality tailored to enterprise environments.