- Logstash Reference: other versions:
- Logstash Introduction
- Getting Started with Logstash
- How Logstash Works
- Setting Up and Running Logstash
- Logstash Directory Layout
- Logstash Configuration Files
- logstash.yml
- Secrets keystore for secure settings
- Running Logstash from the Command Line
- Running Logstash as a Service on Debian or RPM
- Running Logstash on Docker
- Configuring Logstash for Docker
- Running Logstash on Windows
- Logging
- Shutting Down Logstash
- Setting Up X-Pack
- Upgrading Logstash
- Configuring Logstash
- Advanced Logstash Configurations
- Managing Logstash
- Working with Logstash Modules
- Working with Filebeat Modules
- Data Resiliency
- Transforming Data
- Deploying and Scaling Logstash
- Performance Tuning
- Monitoring Logstash
- Monitoring Logstash with APIs
- Working with plugins
- Integration plugins
- Input plugins
- azure_event_hubs
- beats
- cloudwatch
- couchdb_changes
- dead_letter_queue
- elasticsearch
- exec
- file
- ganglia
- gelf
- generator
- github
- google_cloud_storage
- google_pubsub
- graphite
- heartbeat
- http
- http_poller
- imap
- irc
- java_generator
- java_stdin
- jdbc
- jms
- jmx
- kafka
- kinesis
- log4j
- lumberjack
- meetup
- pipe
- puppet_facter
- rabbitmq
- redis
- relp
- rss
- s3
- s3-sns-sqs
- salesforce
- snmp
- snmptrap
- sqlite
- sqs
- stdin
- stomp
- syslog
- tcp
- udp
- unix
- varnishlog
- websocket
- wmi
- xmpp
- Output plugins
- boundary
- circonus
- cloudwatch
- csv
- datadog
- datadog_metrics
- elastic_app_search
- elasticsearch
- exec
- file
- ganglia
- gelf
- google_bigquery
- google_cloud_storage
- google_pubsub
- graphite
- graphtastic
- http
- influxdb
- irc
- sink
- java_stdout
- juggernaut
- kafka
- librato
- loggly
- lumberjack
- metriccatcher
- mongodb
- nagios
- nagios_nsca
- opentsdb
- pagerduty
- pipe
- rabbitmq
- redis
- redmine
- riak
- riemann
- s3
- sns
- solr_http
- sqs
- statsd
- stdout
- stomp
- syslog
- tcp
- timber
- udp
- webhdfs
- websocket
- xmpp
- zabbix
- Filter plugins
- aggregate
- alter
- bytes
- cidr
- cipher
- clone
- csv
- date
- de_dot
- dissect
- dns
- drop
- elapsed
- elasticsearch
- environment
- extractnumbers
- fingerprint
- geoip
- grok
- http
- i18n
- java_uuid
- jdbc_static
- jdbc_streaming
- json
- json_encode
- kv
- memcached
- metricize
- metrics
- mutate
- prune
- range
- ruby
- sleep
- split
- syslog_pri
- threats_classifier
- throttle
- tld
- translate
- truncate
- urldecode
- useragent
- uuid
- xml
- Codec plugins
- Tips and Best Practices
- Troubleshooting Common Problems
- Contributing to Logstash
- How to write a Logstash input plugin
- How to write a Logstash codec plugin
- How to write a Logstash filter plugin
- How to write a Logstash output plugin
- Documenting your plugin
- Contributing a Patch to a Logstash Plugin
- Logstash Plugins Community Maintainer Guide
- Submitting your plugin to RubyGems.org and the logstash-plugins repository
- Contributing a Java Plugin
- Glossary of Terms
- Breaking Changes
- Release Notes
- Logstash 7.7.1 Release Notes
- Logstash 7.7.0 Release Notes
- Logstash 7.6.2 Release Notes
- Logstash 7.6.1 Release Notes
- Logstash 7.6.0 Release Notes
- Logstash 7.5.2 Release Notes
- Logstash 7.5.1 Release Notes
- Logstash 7.5.0 Release Notes
- Logstash 7.4.2 Release Notes
- Logstash 7.4.1 Release Notes
- Logstash 7.4.0 Release Notes
- Logstash 7.3.2 Release Notes
- Logstash 7.3.1 Release Notes
- Logstash 7.3.0 Release Notes
- Logstash 7.2.1 Release Notes
- Logstash 7.2.0 Release Notes
- Logstash 7.1.1 Release Notes
- Logstash 7.1.0 Release Notes
- Logstash 7.0.1 Release Notes
- Logstash 7.0.0 Release Notes
- Logstash 7.0.0-rc2 Release Notes
- Logstash 7.0.0-rc1 Release Notes
- Logstash 7.0.0-beta1 Release Notes
- Logstash 7.0.0-alpha2 Release Notes
- Logstash 7.0.0-alpha1 Release Notes
IMPORTANT: No additional bug fixes or documentation updates
will be released for this version. For the latest information, see the
current release documentation.
Monitoring UI
editMonitoring UI
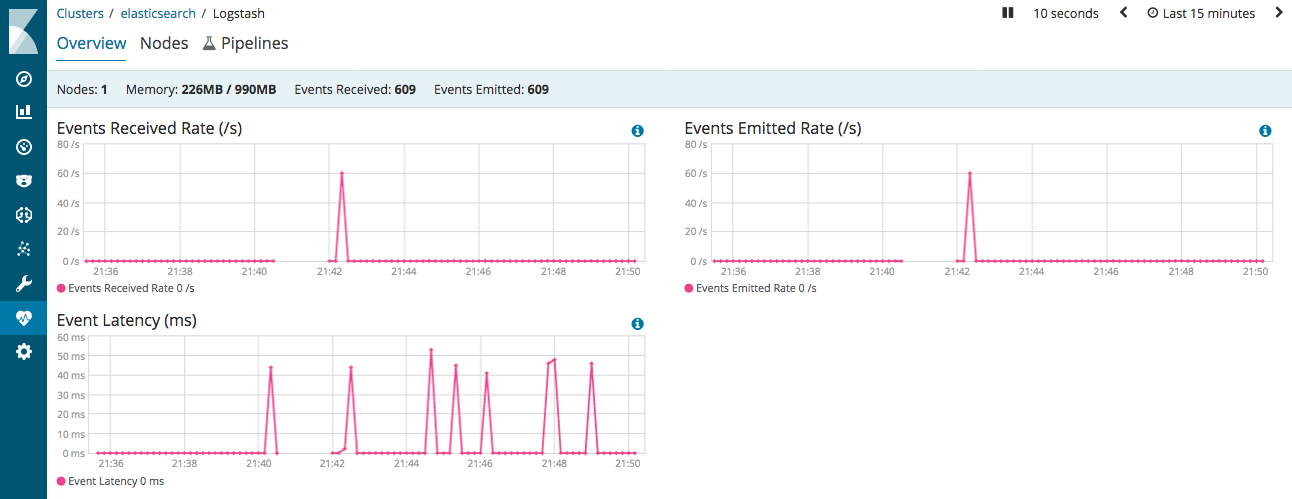
editUse the monitoring feature in X-Pack to view metrics and gain insight into how your Logstash deployment is running. In the overview dashboard, you can see all events received and sent by Logstash, plus info about memory usage and uptime:
Then you can drill down to see stats about a specific node:
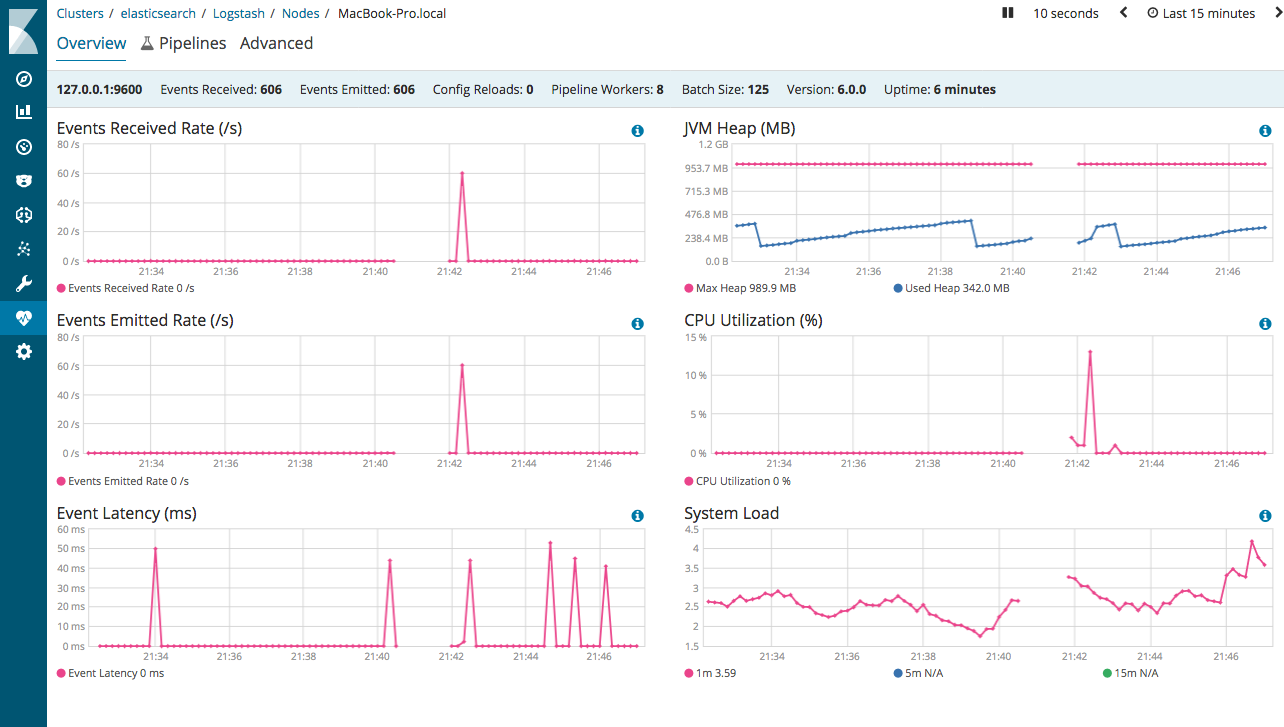
A Logstash node is considered unique based on its persistent UUID, which
is written to the path.data directory when the node
starts.
Before you can use the monitoring UI, configure Logstash monitoring.
For information about using the Monitoring UI, see X-Pack monitoring in Kibana.
Was this helpful?
Thank you for your feedback.