Session View
Session View is an investigation tool that allows you to examine Linux process data organized in a tree-like structure according to the Linux logical event model, with processes organized by parentage and time of execution. It displays events in a highly readable format that is inspired by the terminal. This makes it a powerful tool for monitoring and investigating session activity on your Linux infrastructure and understanding user and service behavior.
Ensure you have the appropriate Elastic Stack subscription or Serverless project feature tier.
Session View has the following features:
- Interactive and non-interactive processes: Processes and services with or without a controlling terminal.
- User information: The Linux user that executed each session or process, and any exec user changes.
- Process and event telemetry: Process information included in the Linux logical event model.
- Nested sessions: Sessions started by processes descended from the entry session.
- Alerts: Process, file, and network alerts in the context of the events which caused them.
- Terminal output: Terminal output associated with each process in the session.
Session View uses process data collected by the Elastic Defend integration, but this data is not always collected by default. To confirm that Session View data is enabled:
- Find Policies in the navigation menu or by using the global search field.
- Select one or more of your Elastic Defend integration policies to edit.
- Select the Policy settings tab, then scroll down to the Linux event collection section near the bottom.
- Check the box for Process events, and turn on the Collect session data toggle.
- If you want to include file and network alerts in Session View, check the boxes for Network and File events.
- If you want to enable terminal output capture, turn on the Capture terminal output toggle.
Session View can only display data that was collected by Elastic Defend when Collect session data was enabled. When this setting is on, Elastic Defend includes additional process context data in captured process, file, and network events. For more information about the additional fields collected when this setting is on, refer to the Linux event model RFC.
Session View is accessible from the Hosts, Alerts, and Timelines pages, as well as the alert details flyout.
Events and sessions that you can investigate in Session View have a rectangular Open Session View button in the Actions column. For example:
On the Alerts page, scroll down to view the Alerts table. Look for alerts that have the Open Session View button in the Actions column:

On the Hosts page (Explore → Hosts), select the Sessions or the Events tab. From either of these tabs, click the Open Session View button for an event or session.
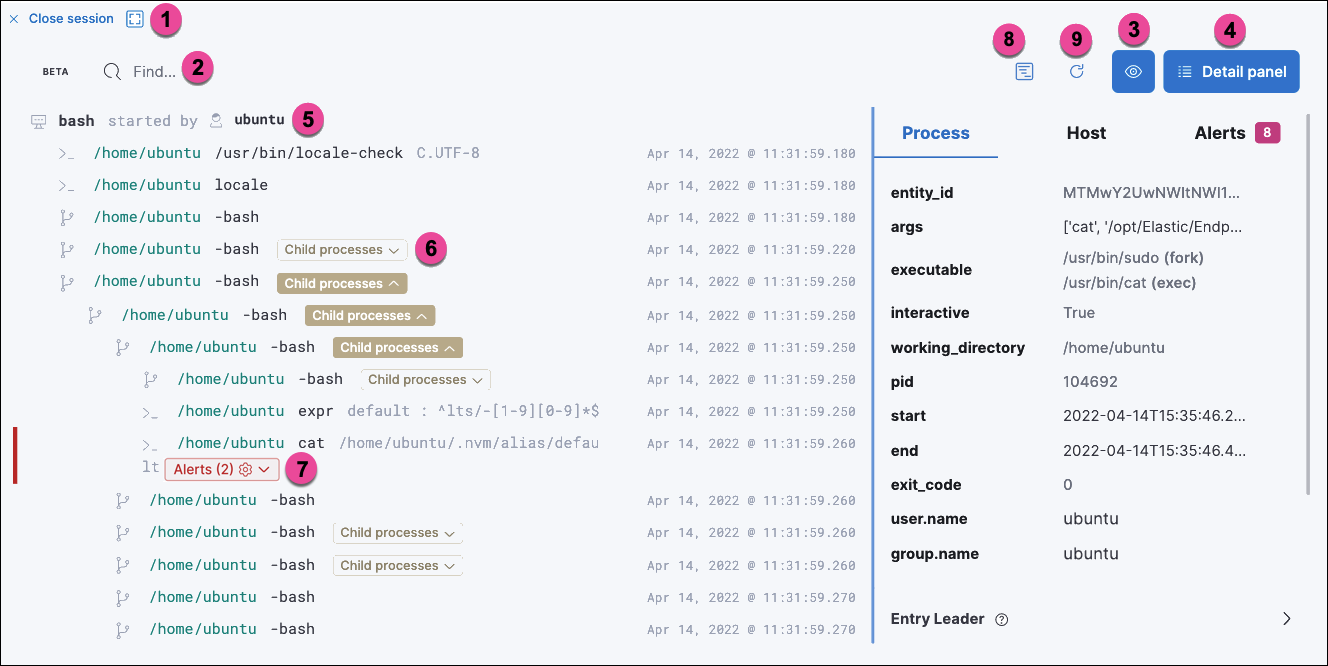
The Session View UI has the following features:

- The Close Session and Full screen buttons.
- The search bar. Use it to find and highlight search terms within the current session. The left and right arrows allow you to navigate through search results.
- The display settings button. Click to toggle Timestamps and Verbose mode. With Verbose mode enabled, Session View shows all processes created in a session, including shell startup, shell completion, and forks caused by built-in commands. It defaults to off to highlight the data most likely to be user-generated and non-standard.
- The Detail panel button. Click it to toggle the Detail panel, which appears below the button and displays a wide range of additional information about the selected process’s ancestry and host, and any associated alerts. To select a process in Session View, click on it.
- The startup process. In this example, it shows that the session was a bash session. It also shows the Linux user "Ubuntu" started the session.
- The Child processes button. Click to expand or collapse a process’s children. You can also expand collapsed alerts and scripts where they appear. Collapsed processes will automatically expand when their contents match a search.
- The Alerts button. Click to show alerts caused by the parent process. In this example, the
(2)indicates that there are two alerts. Note the red line to the left of the event that caused the alert. Both alerts caused by this event areprocessalerts, as indicated by the gear icon. - The Terminal output button. Hover to see how much output data has been captured from the session. Click to open the terminal output view, which is described in detail below.
- The Refresh session button. Click to check for any new data from the current session.
Session View includes additional badges not pictured above:
The alert badge for multiple alerts appears when a single event causes alerts of multiple types (
 for
for processalerts, for
for filealerts, and for
for networkalerts):
The Exec user change badge highlights exec user changes, such as when a user escalates to root:

The Output badge appears next to commands that generated terminal output. Click it to view that command’s output in terminal output view.

- Session output can only be collected from Linux OSes with eBPF-enabled kernels versions 5.10.16 or higher.
In general, terminal output is the text that appears in interactive Linux shell sessions. This generally includes user-entered text (terminal input), which appears as output to facilitate editing commands, as well as the text output of executed programs. In certain cases such as password entry, terminal input is not captured as output.
From a security perspective, terminal output is important because it offers a means of exfiltrating data. For example, a command like cat tls-private-key.pem could output a web server’s private key. Thus, terminal output view can improve your understanding of commands executed by users or adversaries, and assist with auditing and compliance.
To enable terminal output data capture:
- Find Policies in the navigation menu or by using the global search field.
- Select one or more of your Elastic Defend integration policies to edit.
- On the Policy settings tab, scroll down to the Linux event collection section near the bottom of the page and select the Collect session data and Capture terminal output options.
You can configure several additional settings by clicking Advanced settings at the bottom of the page:
linux.advanced.tty_io.max_kilobytes_per_process: The maximum number of kilobytes of output to record from a single process. Default: 512 KB. Process output exceeding this value will not be recorded.linux.advanced.tty_io.max_kilobytes_per_event: The maximum number of kilobytes of output to send to Elasticsearch as a single event. Default: 512 KB. Additional data is captured as a new event.linux.advanced.tty_io.max_event_interval_seconds: The maximum interval (in seconds) during which output is batched. Default: 30 seconds. Output will be sent to Elasticsearch at this interval (unless it first exceeds themax_kilobytes_per_eventvalue, in which case it might be sent sooner).

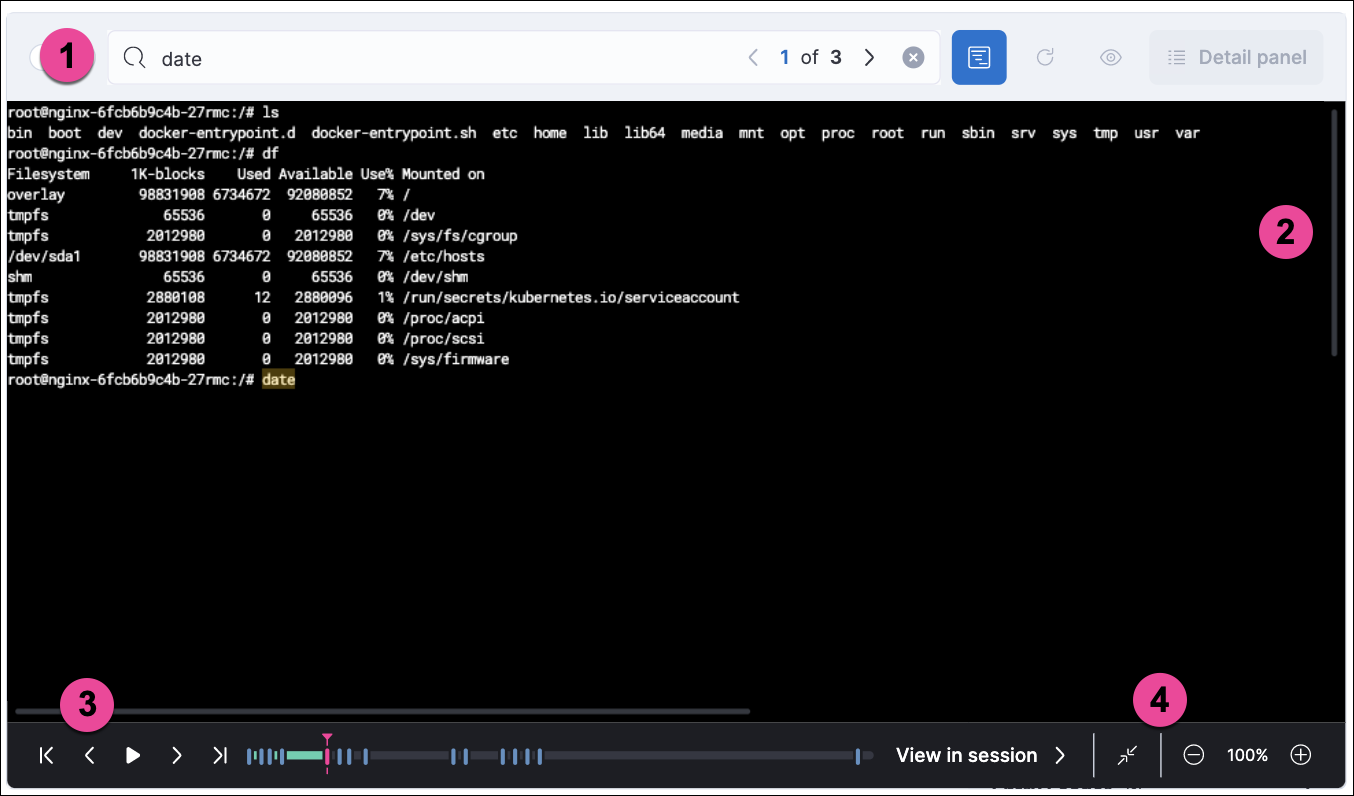
- Search bar. Use to find and highlight search terms within the current session. The left and right arrows allow you to navigate through search results.
- Right-side scroll bar. Use along with the bottom scroll bar to navigate output data that doesn’t fit on a single screen.
- Playback controls and progress bar. Use to advance or rewind the session’s commands and output. Click anywhere on the progress bar to jump to that part of the session. The marks on the bar represent processes that generated output. Click them or the Prev and Next buttons to skip between processes.
- Fit screen, Zoom in, and Zoom out buttons. Use to adjust the text size.
Use Session view’s Fullscreen button (located next to the Close session viewer button) to better fit output with long lines, such as for graphical programs like vim.
You should understand several current limitations before building rules based on terminal output data:
- Terminal output that appears in the
process.io.textfield includes ANSI codes that represent, among other things, text color, text weight, and escape sequences. This can prevent EKS queries from matching as expected. Queries of this data will have more success matching single words than more complex strings. - Queries of this data should include leading and trailing wildcards (for example
process where process.io.text : "*sudo*"), since output events typically include multiple lines of output. - The search functionality built into terminal output view is subject to similar limitations. For example, if a user accidentally entered
sdoinstead ofsudo, then pressed backspace twice to fix the typo, the recorded output would besdo\b\budo. This would appear in the terminal output view assudo, but searching terminal output view forsudowould not result in a match. - Output that seems like it should be continuous may be split into multiple events due to the advanced settings described above, which may prevent a query or search from matching as expected.
- Rules based on output data will identify which output event’s
process.io.textvalue matched the alert query, without identifying which specific part of that value matched. For example, the rule queryprocess.io.text: "*test*"could match a large, multi-line log file due to a single instance oftest, without identifying where in the file the instance occurred.