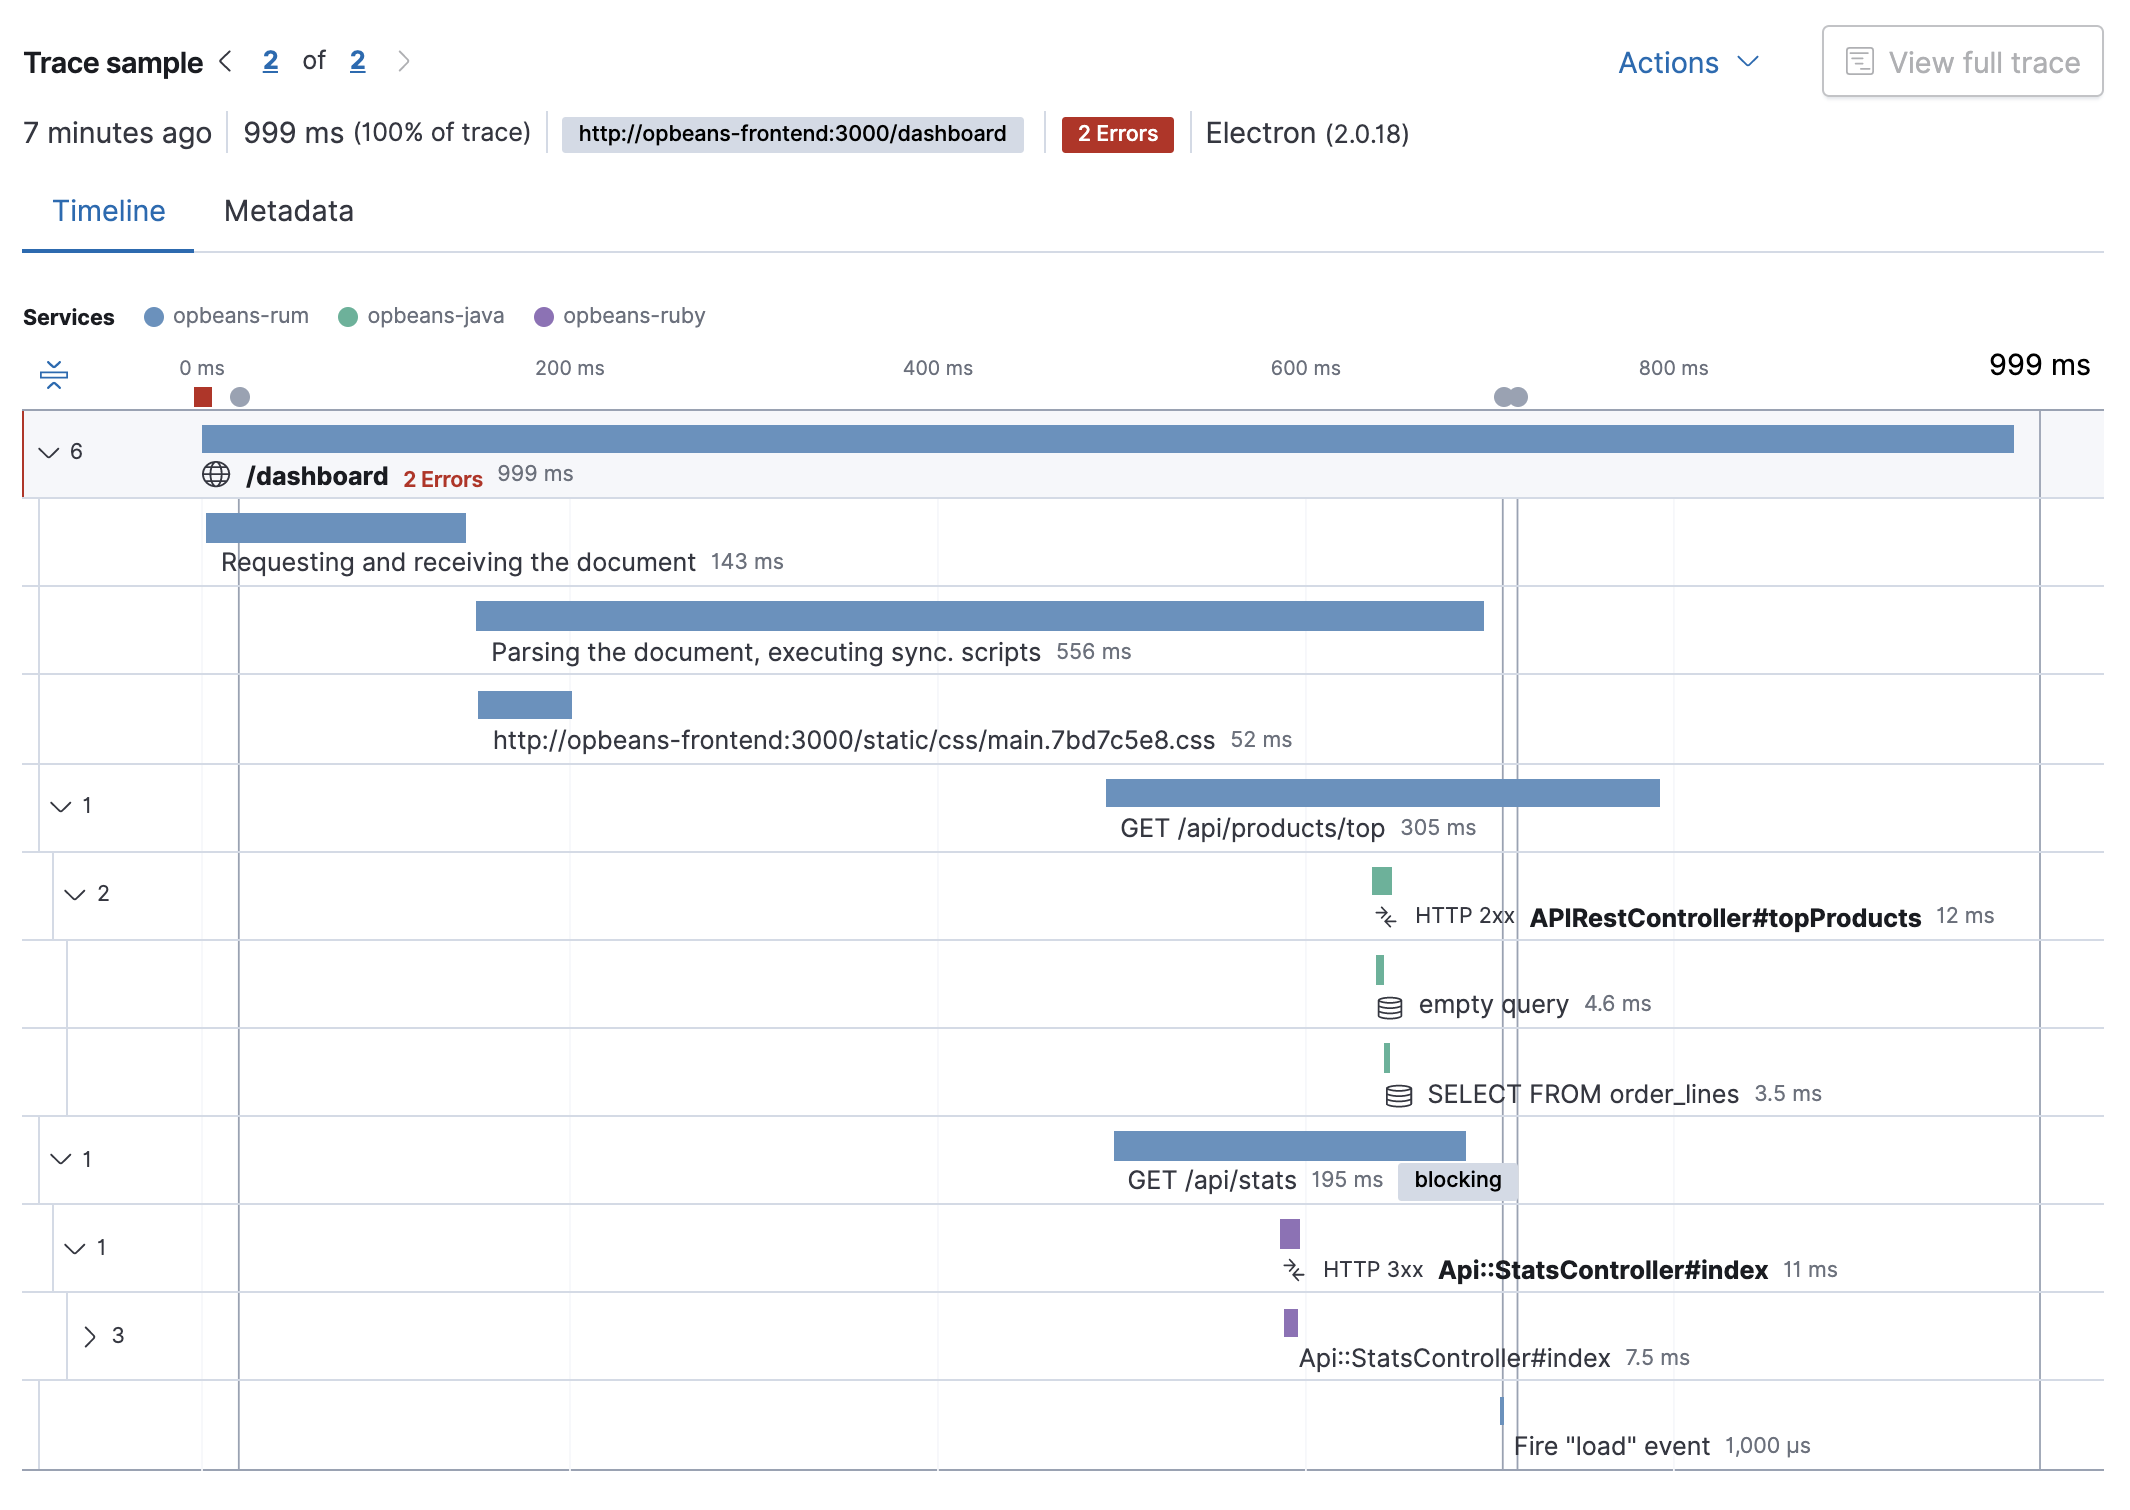
Trace sample timeline
The trace sample timeline visualization is a high-level view of what your application was doing while it was trying to respond to a request. This makes it useful for visualizing where a selected transaction spent most of its time.

View a span in detail by clicking on it in the timeline waterfall. For example, when you click on an SQL Select database query, the information displayed includes the actual SQL that was executed, how long it took, and the percentage of the trace’s total time. You also get a stack trace, which shows the SQL query in your code. Finally, APM knows which files are your code and which are just modules or libraries that you’ve installed. These library frames will be minimized by default in order to show you the most relevant stack trace.
A span is the duration of a single event. Spans are automatically captured by APM agents, and you can also define custom spans. Each span has a type and is defined by a different color in the timeline/waterfall visualization.

The trace sample timeline features an Investigate button which provides a quick way to jump to other areas of the Elastic Observability UI while maintaining the context of the currently selected trace sample. For example, quickly view:
- logs and metrics for the selected pod
- logs and metrics for the selected host
- trace logs for the selected
trace.id - uptime status of the selected domain
- the service map filtered by the selected trace
- the selected transaction in Discover
- your custom links
When a trace travels through multiple services it is known as a distributed trace. In APM, the colors in a distributed trace represent different services and are listed in the order they occur.

As application architectures are shifting from monolithic to more distributed, service-based architectures, distributed tracing has become a crucial feature of modern application performance monitoring. It allows you to trace requests through your service architecture automatically, and visualize those traces in one single view in the Applications UI. From initial web requests to your front-end service, to queries made to your back-end services, this makes finding possible bottlenecks throughout your application much easier and faster.

Don’t forget; by definition, a distributed trace includes more than one transaction. When viewing distributed traces in the timeline waterfall, you’ll see this icon: , which indicates the next transaction in the trace. For easier problem isolation, transactions can be collapsed in the waterfall by clicking the icon to the left of the transactions. Transactions can also be expanded and viewed in detail by clicking on them.
After exploring these traces, you can return to the full trace by clicking View full trace.
Distributed tracing is supported by all APM agents, and there’s no additional configuration needed.