Elastic Observability 8.10: Elastic AI Assistant enhancements and GA of Universal Profiling
Elastic Observability 8.10 introduces the general availability release of Elastic Universal Profiling™ and enhancements to the Elastic AI Assistant for Observability.
- Elastic® Universal Profiling is a whole-system, always-on, continuous profiling solution that eliminates the need for code instrumentation, recompilation, on-host debug symbols, or service restarts. Leveraging eBPF, it operates within the Linux kernel space, capturing only necessary data with minimal overhead. It profiles every line of code, including application, kernel, and third-party libraries, providing whole-system code visibility across your entire fleet.
- Elastic AI Assistant for Observability was introduced as a technical preview in Elastic Observability 8.9 and has been enhanced with new chat capabilities, including the ability for a user to interact using a natural language interface, recall and summarize information throughout a conversation, and set up a knowledge base (powered by Elastic Learned Sparse EncodeR (ELSER)) to provide additional context and recommendations from private data (alongside the LLM).
Elastic Observability 8.10 is available now on Elastic Cloud — the only hosted Elasticsearch® offering to include all of the new features in this latest release. You can also download the Elastic Stack and our cloud orchestration products, Elastic Cloud Enterprise and Elastic Cloud for Kubernetes, for a self-managed experience.
Announcing the general availability of Elastic Universal Profiling
Computational efficiency has always been a critical concern for SREs and developers. However, in an era where every line of code impacts both the business KPIs and the environment, there's renewed emphasis on software optimization. This is due to the dual benefits of efficient software: it reduces cloud cost and propels organizations toward their ESG goals.
Elastic Universal Profiling helps you run efficient services by measuring efficiency in three dimensions: CPU performance (gained or lost), CO2 emission, and cloud cost. Universal Profiling is a continuous, always-on, whole-system profiling solution that requires zero-instrumentation, zero-code changes, and zero-restarts. It provides unprecedented code visibility into the runtime behavior of all applications by building stack traces that go from the kernel, through userspace native code, all the way into code running in higher level runtimes — enabling you to identify performance regressions, reduce wasteful computations, and debug complex issues faster.
Drawing from customer testimonials, the threat detection team at AppOmni utilizes Elastic Universal Profiling to hone in on areas requiring performance enhancements within their product workloads, specifically in applications written in Python and Go. Here are the thoughts of Mike Brancato, principal security engineer at AppOmni:
Using Elastic Universal Profiling, we were able to very quickly identify the slowest parts of our applications, and target those for improvement. We were able to easily and quickly deploy into production without disruption to existing workloads. Profiling data for our applications and other components was immediately available, without the need to include any libraries or make any modifications to our applications.
Mike Brancato, Principal Security Engineer, AppOmni
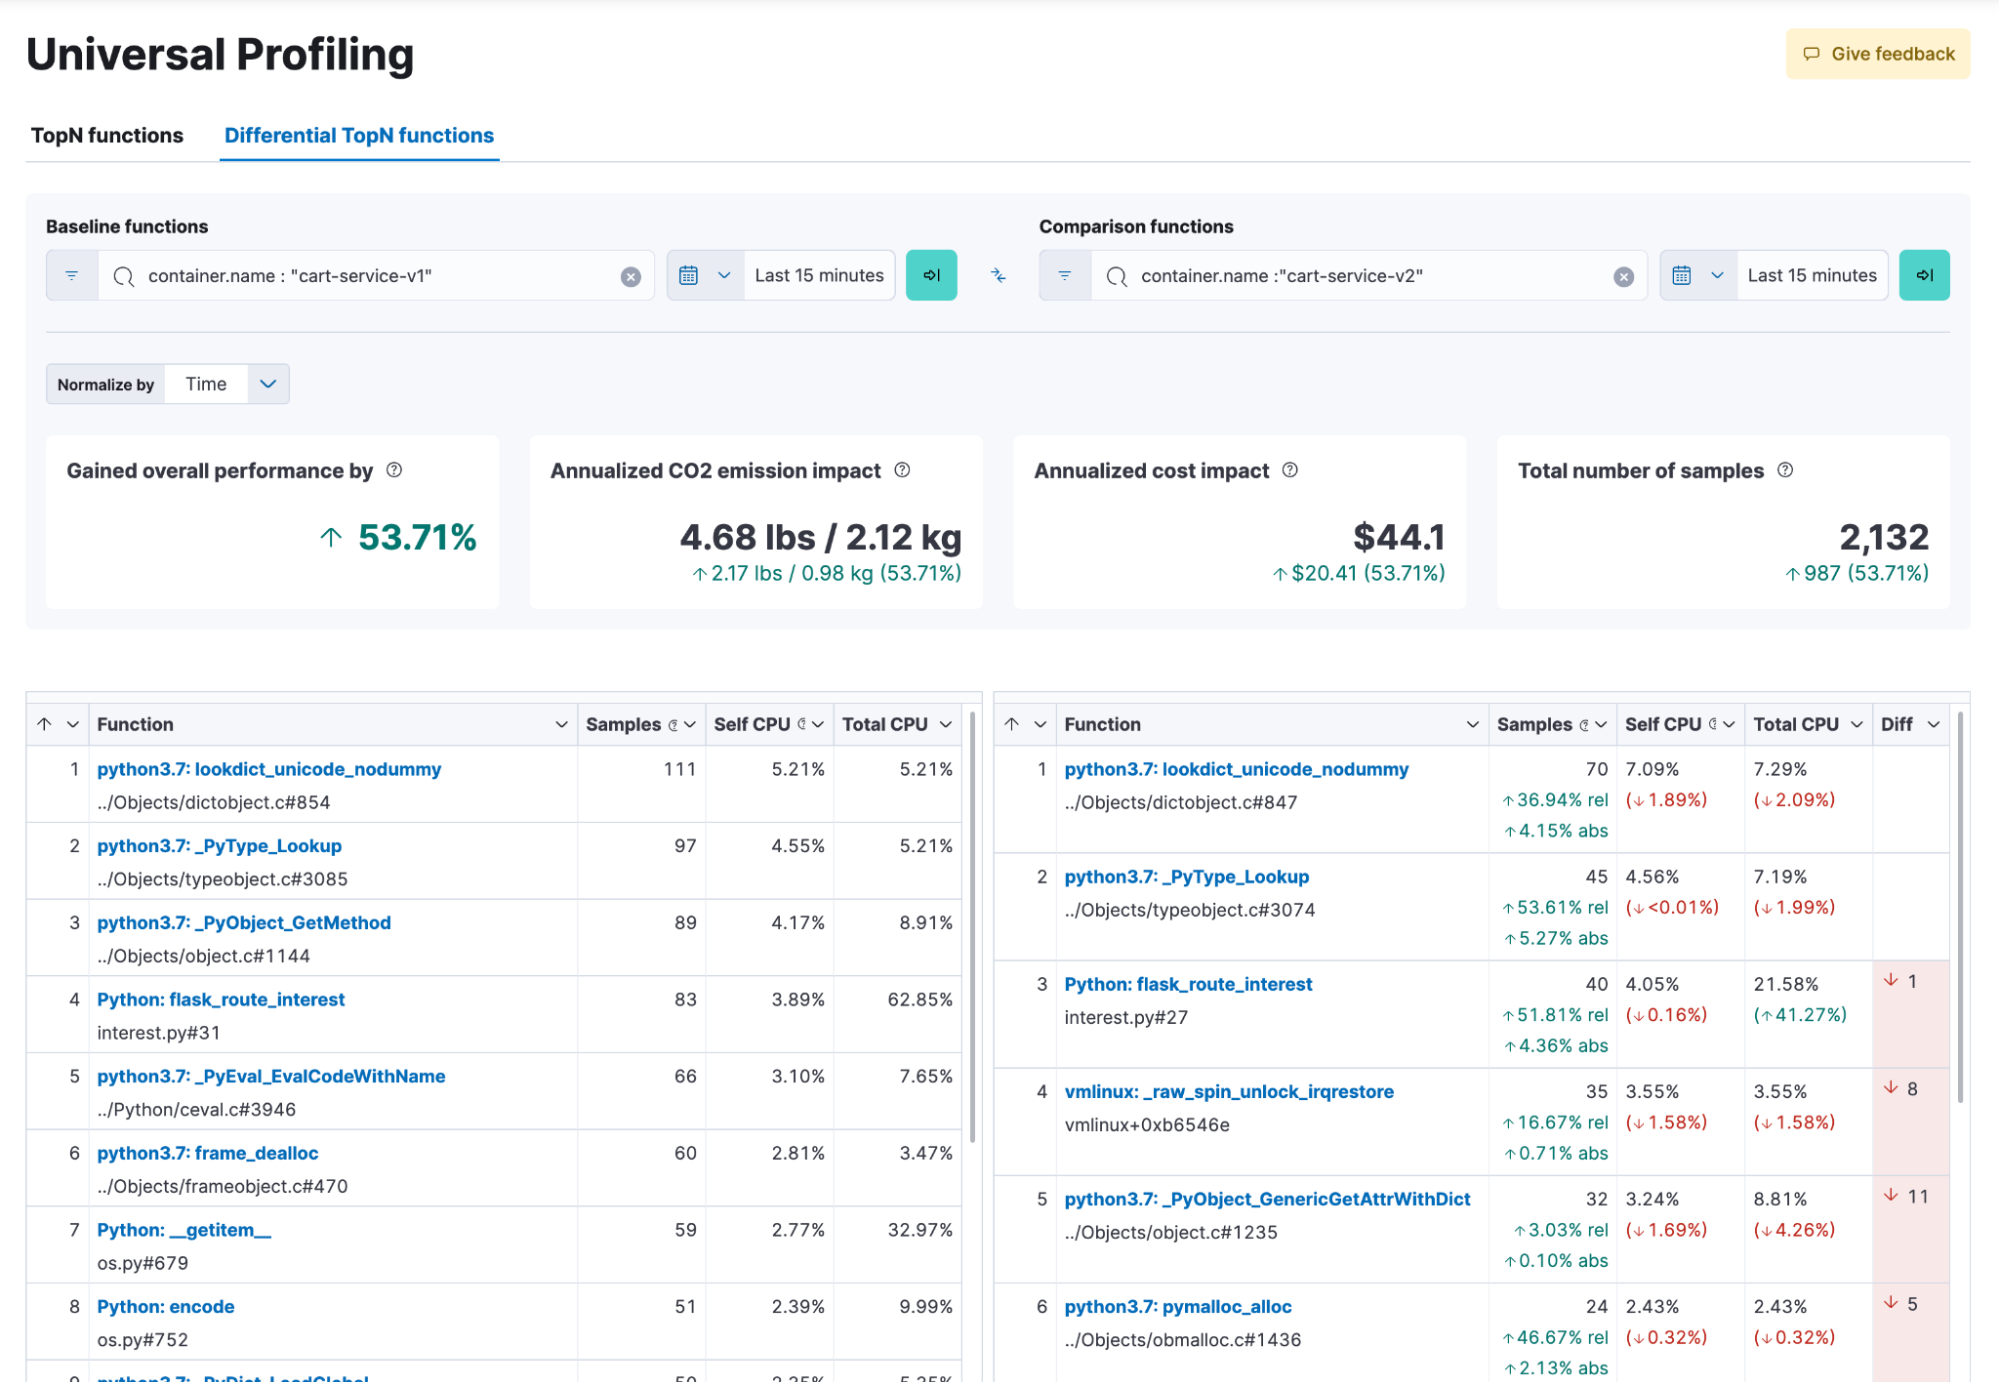
Universal Profiling is available in Elastic Cloud. Get started now.
Learn more about the possibilities with Universal Profiling.
Introducing Elastic AI Assistant chat (tech preview)
In Elastic Observability 8.10 we are introducing a chat capability to Elastic AI Assistant. This release is a Technical Preview and makes use of generative AI, meaning that it may be error prone and/or produce factually incorrect information.
We are releasing the chat capability for Elastic AI Assistant to give the community insight into the direction we are going and to solicit feedback.
The chat capability allows you to have a session/conversation with the Elastic AI Assistant enabling you to:
- Use a natural language interface such as “Are there any alerts related to this service today?” or “Can you explain what these alerts are?” as part of problem determination and root cause analysis processes
- Offer conclusions and context, and suggest next steps and recommendations from your own internal private data (powered by ELSER), as well as by information available in the connected LLM
- Analyze responses from queries and output from analysis performed by the Elastic AI Assistant
- Recall and summarize information throughout the conversation
- Generate Lens visualizations via conversation
- Execute Kibana® and Elasticsearch APIs on behalf of the user through the chat interface
- Perform root cause analysis using specific APM functions such as: get_apm_timeseries, get_apm_service_summary, get_apm_error_docuements, get_apm_correlations, get_apm_downstream_dependencies, etc.
Here is a simple example of how you can use Elastic AI Assistant chat to analyze alerts:
The chat capability in Elastic AI Assistant for Observability will initially be accessible from several locations in Elastic Observability 8.10, and additional access points will be added to future releases.
- All Observability applications have a button in the top action menu to open the AI Assistant and start a conversation:
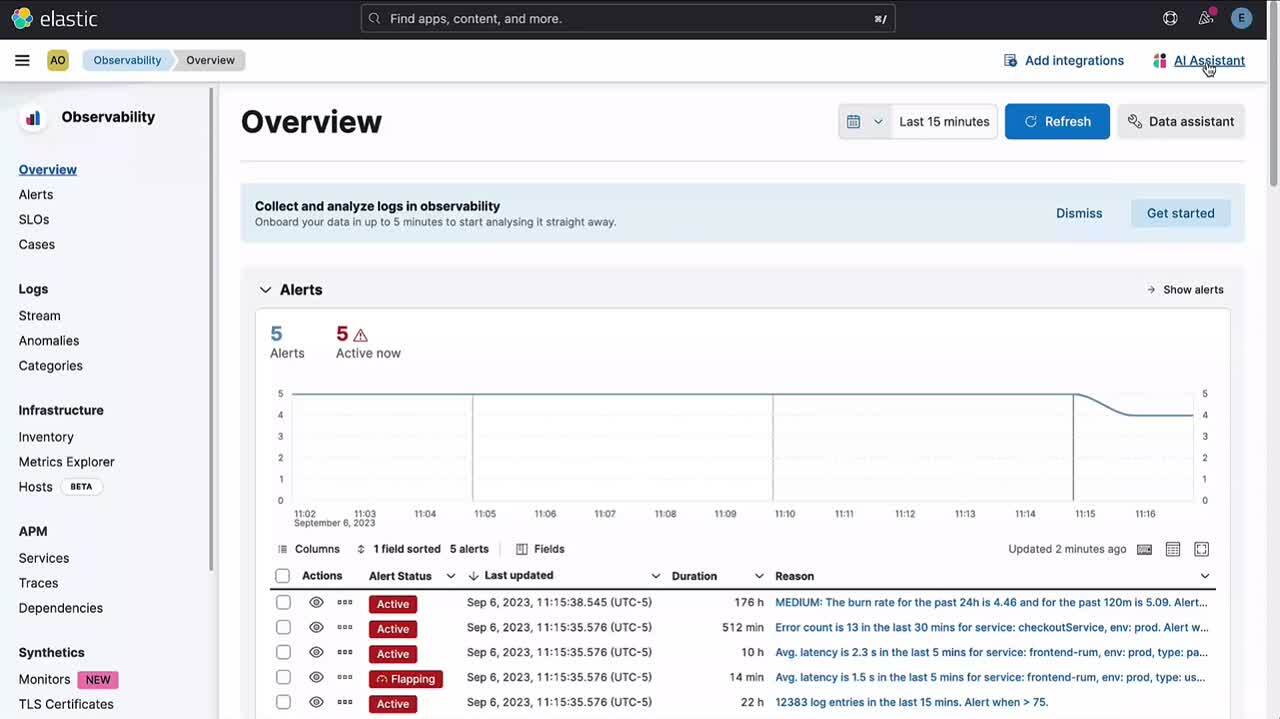
- Users can access existing conversations and create new ones by clicking the Go to conversations link in the AI Assistant.
The new chat capability in Elastic AI Assistant for Observability enhances the capabilities introduced in Elastic Observability 8.9 by providing the ability to start a conversation related to the insights already being provided by the Elastic AI Assistant in APM, logging, hosts, alerting, and profiling.
For example:
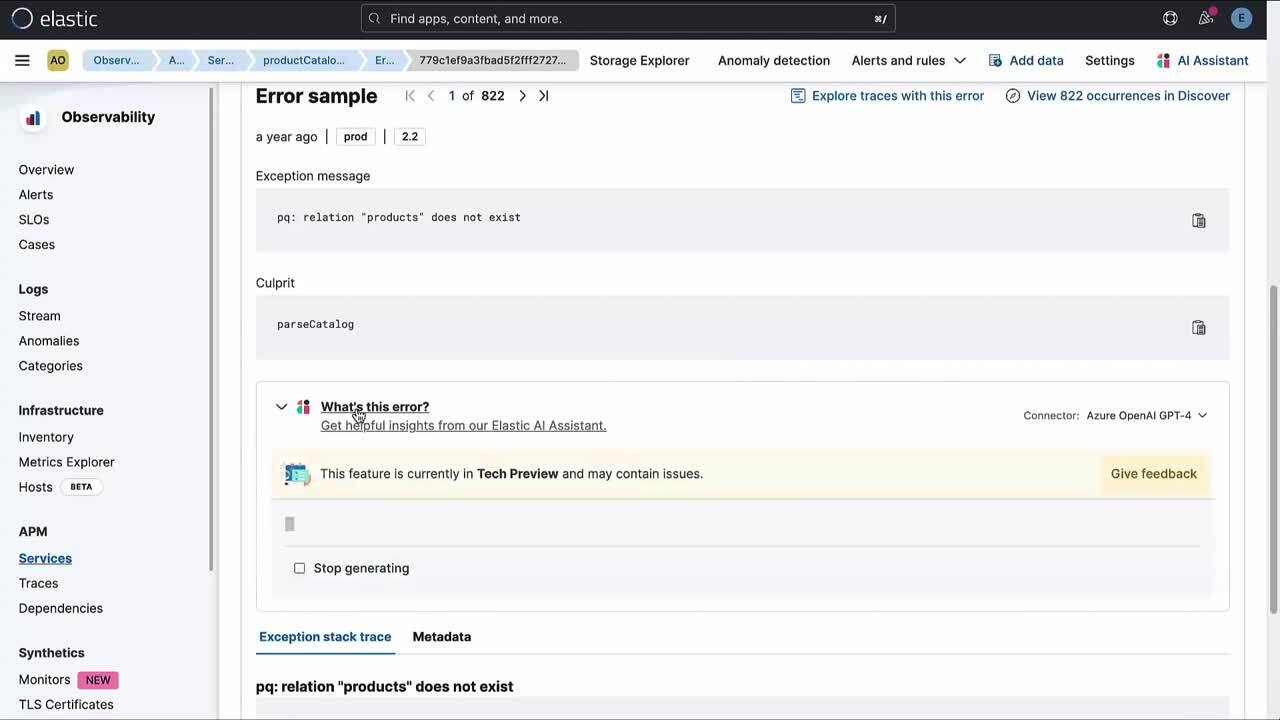
- In APM, it explains the meaning of a specific error or exception and offers common causes and possible impacts. Additionally, you can investigate it further with a conversation.

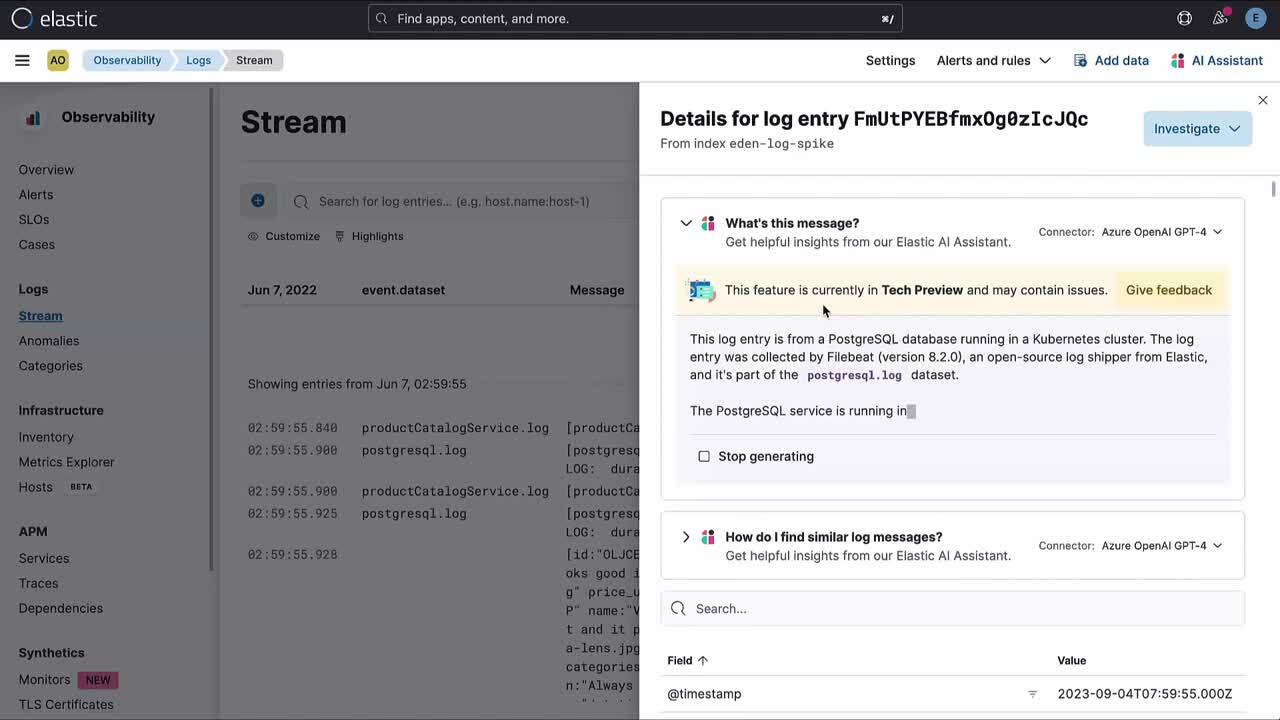
- In logging, the AI Assistant takes the log and helps you understand the message with contextual information, and additionally you can investigate further with a conversation.
Another enhancement to the Elastic AI Assistant for Observability includes the option to utilize a knowledge base (a specific Elasticsearch index with an inference processor powered by ELSER) alongside the LLM (OpenAI or Azure OpenAI) to provide provide additional context and recommendations from private data (knowledge base) and the LLM.
Details on how to configure the Elastic AI Assistant can be found in the Elastic documentation.
It is Connector-based and will initially support configuration for OpenAI and Azure OpenAI.
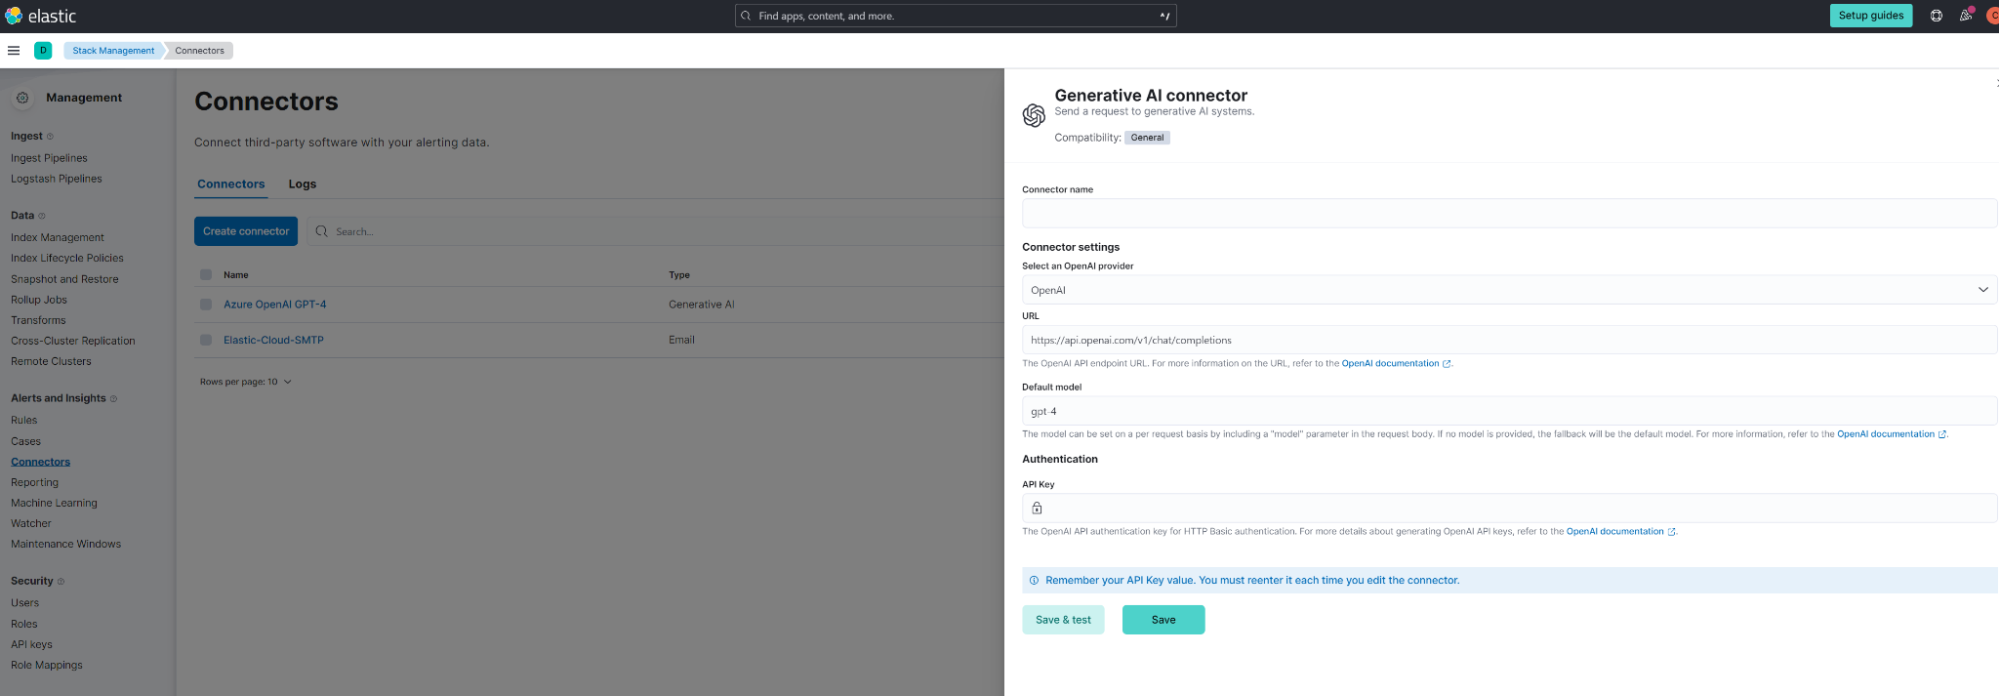
Additionally, it can be configured using yaml as a pre-configured connector:
xpack.actions.preconfigured:
  open-ai:
    actionTypeId: .gen-ai
    name: OpenAI
    config:
      apiUrl: https://api.openai.com/v1/chat/completions
      apiProvider: OpenAI
    secrets:
      apiKey: <myApiKey>
  azure-open-ai:
    actionTypeId: .gen-ai
    name: Azure OpenAI
    config:
      apiUrl: https://<resourceName>.openai.azure.com/openai/deployments/<deploymentName>/chat/completions?api-version=<apiVersion>
      apiProvider: Azure OpenAI
    secrets:
apiKey: <myApiKey>The feature is only available to users with an Enterprise license. The Elastic AI Assistant for Observability is in technical preview and is licensed as an Enterprise feature. If you are not an Elastic Enterprise user, please upgrade for access to the Elastic AI Assistant for Observability.
Your feedback is important to us! Please use the feedback form available in the Elastic AI Assistant, Discuss forums (tagged with AI Assistant), and/or Elastic Community Slack (#observability-ai-assistant).
Try it out
Existing Elastic Cloud customers can access many of these features directly from the Elastic Cloud console. Not taking advantage of Elastic on cloud? Start a free trial.
The release and timing of any features or functionality described in this post remain at Elastic's sole discretion. Any features or functionality not currently available may not be delivered on time or at all.

