Free yourself from operations with Elastic Cloud Serverless. Scale automatically, handle load spikes, and focus on building—start a 14-day free trial to test it out yourself!
You can follow these guides to build an AI-Powered search experience or search across business systems and software.
Sending Observability data to Elastic Cloud has become increasingly easier with the introduction of Serverless. You can create an Observability serverless project in Elastic Cloud Serverless, and send observability signals directly to Elasticsearch or through what we’ve been calling the Managed Intake Service, a fully-managed solution akin to the Elastic APM Server.
Gone are the days where you needed to worry about sizing and configuring different aspects of the APM Server. Instead, you can send data directly to the Managed Intake Service and let our platform do the hard scaling work for you.
In this post, we’ll share how we iterated over the existing APM Server architecture to create the Managed Intake Service.
APM Server primer
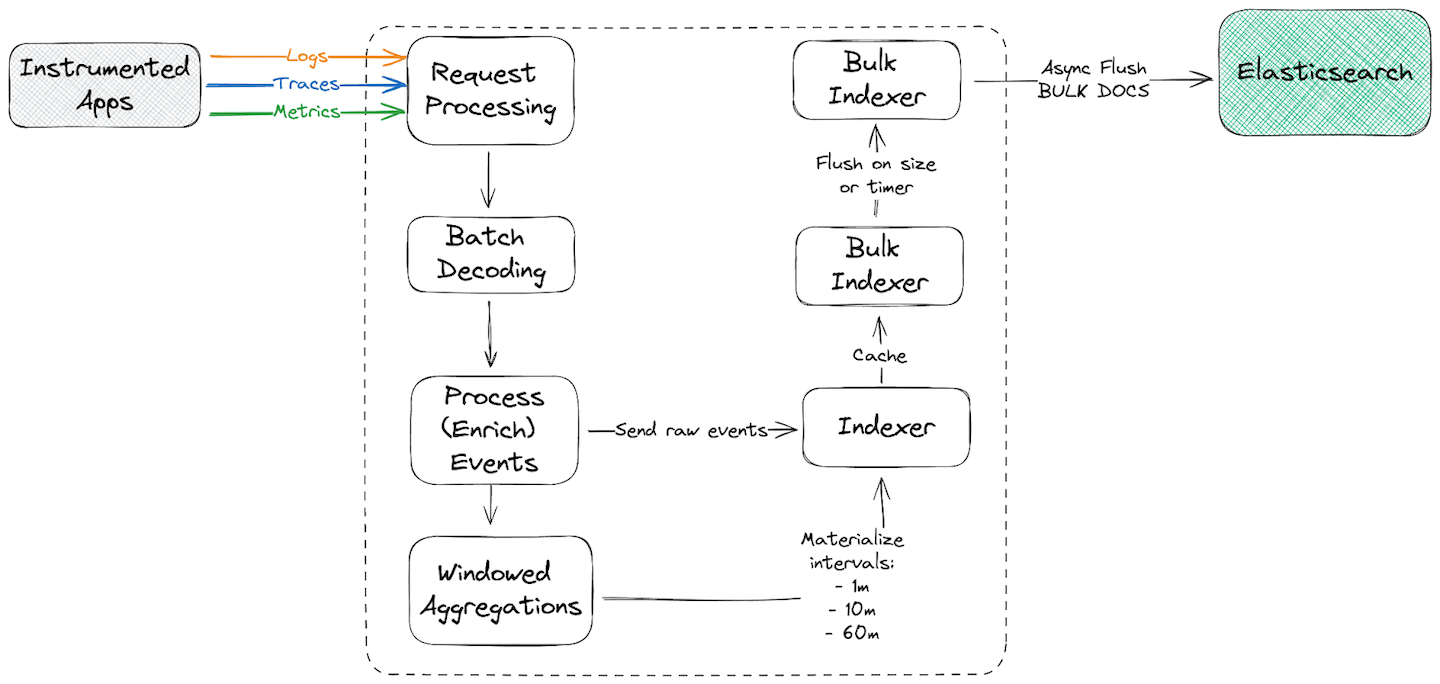
APM Server was designed as a single-tenant process that receives and enriches raw observability signals (traces, logs and metrics) and indexes them to Elasticsearch. It also produces multi-interval (1m, 10m and 60m intervals) aggregated metrics (roll ups) based on the received signals to efficiently power the Observability APM UI. More on why aggregations are needed can be perused here.
While the current APM Server offering in Elastic Cloud works well for use cases with predictable or known load, it has a few limitations that we aimed to improve in the first iteration of the next-generation ingest service:
- APM Server doesn’t automatically scale with the incoming load, requiring users to make upfront decisions based on estimated or actual maximum ingestion load.
- Each APM Server instance should ideally generate 1 aggregated metric document for each unique set of aggregated dimensions. However, with the current model the number of metrics are directly correlated with the number of replicas for APM Server, which impacts the effectiveness for aggregation.
- Aggregations are performed in-memory, requiring increasing amounts of memory as the number of unique combinations increases.
- Ingestion of observability data in APM Server and indexing of the data to Elasticsearch are tightly coupled. Any buffer between these 2 processes are memory based, thus, if Elasticsearch is in the process of scaling up or under-provisioned, the push-back could eventually cause ingestion to grind to a halt, returning errors to clients.
Keep these points in mind as we iterate through the different implementations we tried.
APM Server as a managed product
When we started, we asked ourselves, what is the simplest approach we could take? How well would that work? Does it satisfy the previous requirements?
That simplest approach would be to provision a single APM Server for each project and use horizontal autoscaling on each project's APM Server. However, that results in an enormous amount of wasted compute resources for observability projects that do not ingest observability signals through the APM Server.
Additionally, it didn’t address any of the initial limitations, or improve the overall APM Server experience in Elastic Cloud. It became clear we wanted (and needed) to experiment with a multi-tenant approach. Again, we looked at the simplest approach we could take to shorten the feedback loop as much as possible.
Multi Tenant APM Server
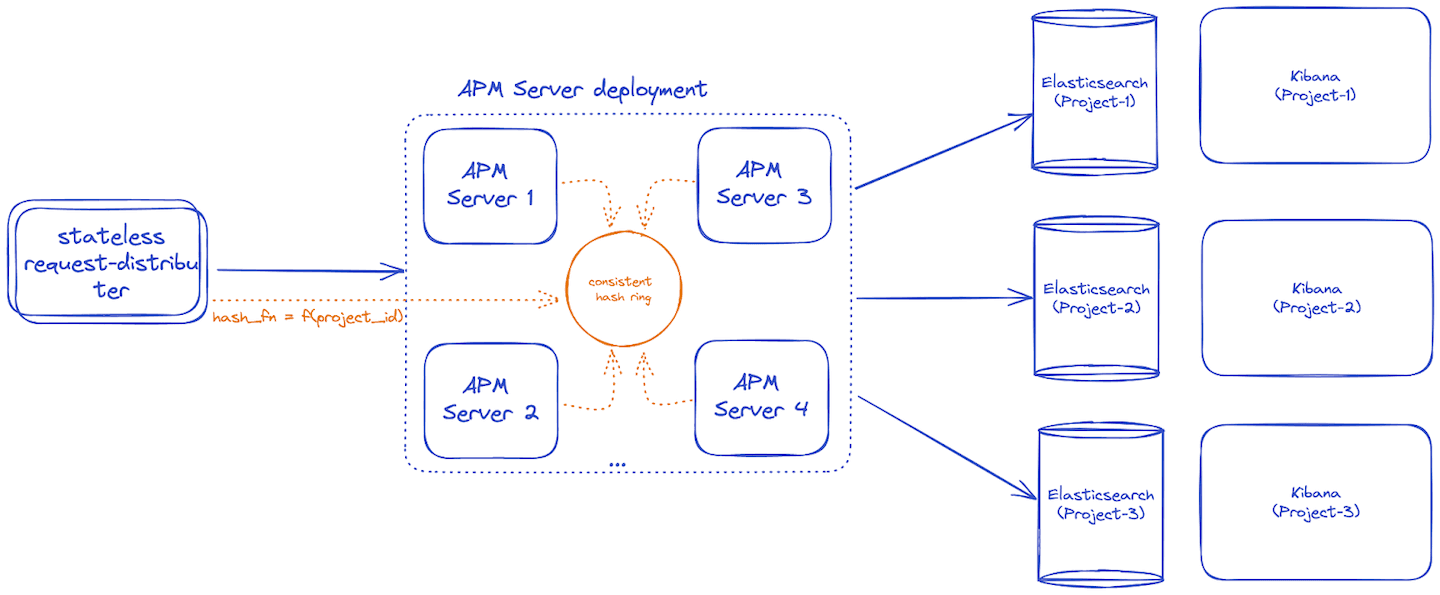
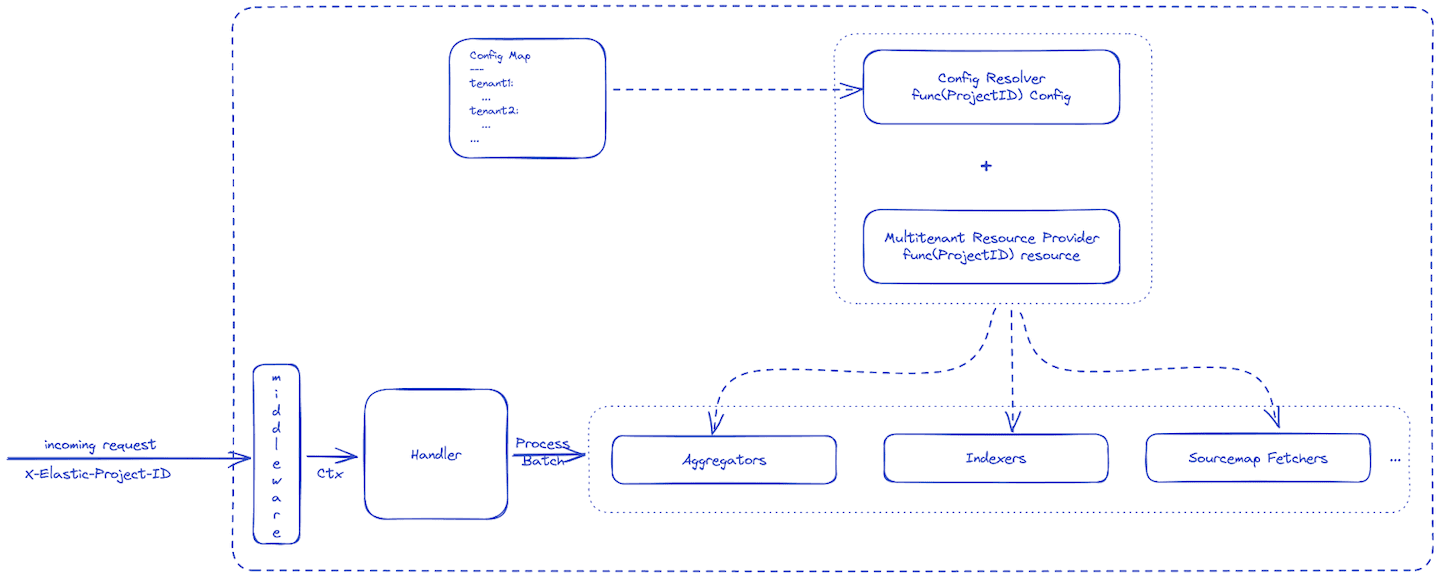
Our logical next step was to extend the current APM Server codebase. One of the requirements for the multi-tenant APM Server was to be able to distinguish between different tenants and route to the appropriate Elasticsearch instance for that tenant.
We came up with a consistent hash ring load balancer to route to the same APM Server for the same tenant. This would satisfy our bounded aggregation requirement (2) to avoid generating multiple aggregation documents for the same unique set of dimensions for an event.
However, as we continued designing the remainder of the multi-tenant APM Server, it looked a lot like multiple services rolled up in one box (or a distributed monolith, something we’d want to avoid).
Additionally, the memory requirements looked quite large to avoid running out of memory, and perform reasonably well.
After the initial prototype for feasibility, it became clear that iterating on the existing APM Server would not meet our expectations. We went back to the drawing board with the goal to design a multi-tenant, distributed system from the groud up in order to achieve the expected level of reliability, scalability, and availability.
Break down the monolith
Back to the drawing board! This time, we decided to break the APM Server into smaller services according to the bounded context they belonged to. Using this classification, the 3 main APM Server responsibilities are pretty obvious:
- Ingest signals and enrich them.
- Generate aggregated metric representations for known time periods
- Index the raw signals and the aggregated metrics once their time period has ended.
Another advantage of breaking apart the APM Server into smaller services is that it allows independent scaling of each service, based on the specific demand(s) of the service. This translates in better resource utilization, simplified reasoning and maintenance of the service.
Ingestion Service
As the name indicates, the purpose of the ingestion service is to ingest the signals from various agents, like Elastic or OTel clients. The ingestion service also performs simple data enrichment to get the most out of the telemetry signals.
The scalability requirement of the ingestion service is directly dependent on the number of clients sending data and the data volume. In addition to ingestion, the service performs distributed rate limiting for each customer sending data to the service. Rate limiting prevents sudden bursts from overwhelming the data processing pipeline.
Aggregation Service
Aggregations, or data roll-ups, are an essential component of the Elastic observability stack. Rolling-up metrics allows Kibana UIs to display telemetry signals for services more efficiently, allowing you to change that time range from minutes to days or years without incurring significant query performance degradation. In essence, it reduces the total number of documents that Elasticsearch has to aggregate, not dissimilar to materialized views in SQL/Database-land.
Traditional APM Server performed in-memory aggregations, however, a memory based approach would be insufficient for a multi-project service with auto-scaling capabilities. Also, in-memory aggregation limits didn’t behave optimally since each aggregation type had individual limits to avoid out of memory issues.
Since we wanted to solve both these problems at the same time (and after some initial experimenting with persistence implementations in the aggregation flow), we settled on a Log-Structured Merge(LSM)-tree approach using a key-value database, Pebble.
This effort eventually materialized in apm-aggregation, a library to perform aggregations that are mostly constrained by disk size, with much smaller memory requirements. LSM-based aggregations were also released in APM Server from 8.10 onwards. We intentionally kept the library open to share the same improvements for self-managed and hosted APM Server.
Index Service
The indexing process buffers tens, hundreds, or thousands of events, and sends these in batches to Elasticsearch using the _bulk API. While inherently simple, there are some complexities to the process and it required a lot of engineering effort to get right:
- Data must be reliably indexed into Elasticsearch. There are two major scenarios where retries are necessary to avoid data loss: a. Temporary
_bulkrequest rejections (the entire_bulkrequest was rejected by Elasticsearch because it can’t service it). b. Temporary individual document rejections (the_bulkrequests succeeded, but one or more documents have not been indexed). - Indexing must be fair but also proportional to the data volume for different tenants.
The first sub-point (1a) was correctly addressed by the go-elasticsearch client’s built-in request retries on specific HTTP status codes. Retrying individual document rejections required a bit more engineering effort and led us to implement document-level retries in the shared indexing component (go-docappender) for both APM Server and the index process in the Managed Intake Service.
The second point is addressed by the fundamental sharded architecture and the transport that is used between the Managed Intake Service components. In short, each project has a dedicated number of indexing clients to ensure a baseline quality of service.
Glue it back together to create the Managed Intake Service
While breaking down the service got us closer to our goal, we still had to decide how services were going to communicate and how data was going to flow from one service to another.
Traditionally, most microservices communicate using simple HTTP/RPC-based request/response schemes. However, that requires services to always be up, or assume temporary unavailability, where unhealthy status codes are retried by the application, or using something like a service mesh to route requests to the appropriate application instance and potentially rely on status codes to allow the service mesh to transparently handle retries.
While we considered this approach, it seemed unnecessarily complicated and brittle once you start considering different failure modes. We researched event processing systems and, unsurprisingly, we started considering the idea of using an event bus or queue as means of communication.
Using an event bus instead of a synchronous RPC-based communication system has a lot of advantages for our use case. The main advantage is that it decouples producers and consumers (producers generate data, while consumers receive it and process it). This decoupling is incredibly advantageous for reliability and resilience, and allows asymmetric processing for a time until auto scaling comes into effect.
We spent a significant amount of time vetting different event bus technologies and unsurprisingly decided that the strongest contender in many areas was… Kafka!
Using Kafka
Since the tried and tested Kafka would be the glue between services, it gave us a high degree of confidence in being able to offer high availability and reliability. The data persistence offered by the event bus allows us to absorb consuming (and producing traffic spikes) delays and push-back from the persistence layer while keeping external clients happy on the ingest path. The next step was making the data pipeline come together.
Our initial attempt resulted in Kafka topics for each signal type. Each topic received specific signal types for multiple projects – undoubtedly the most cost efficient approach with the given stack.
Initial testing and closed-beta launches saw good performance; however, pagers started to ring, literally, once the number of projects (and data volume) grew. We were seeing alerts for delayed time-to-glass as well as poor indexing performance. While investigating the issue, we quickly discovered that our multi-tenant topics were creating hotspots and noisy neighbor issues. In addition, the indexing service was struggling to meet our SLOs consistently due to Head-Of-Line blocking issues.
Taking a step back, we realized that a single tenant model of Elasticsearch requires a higher level of data isolation to guarantee performance, prevent noisy neighbors and eliminate Head-Of-Line blocking issues.
We changed topics from multi-project per-event (per-signal type) topic, to per-project multi-event (multi-signal) i.e. each project would get its own topic. The per-project topics provided improved isolation while Elasticsearch autoscaled without affecting other projects.
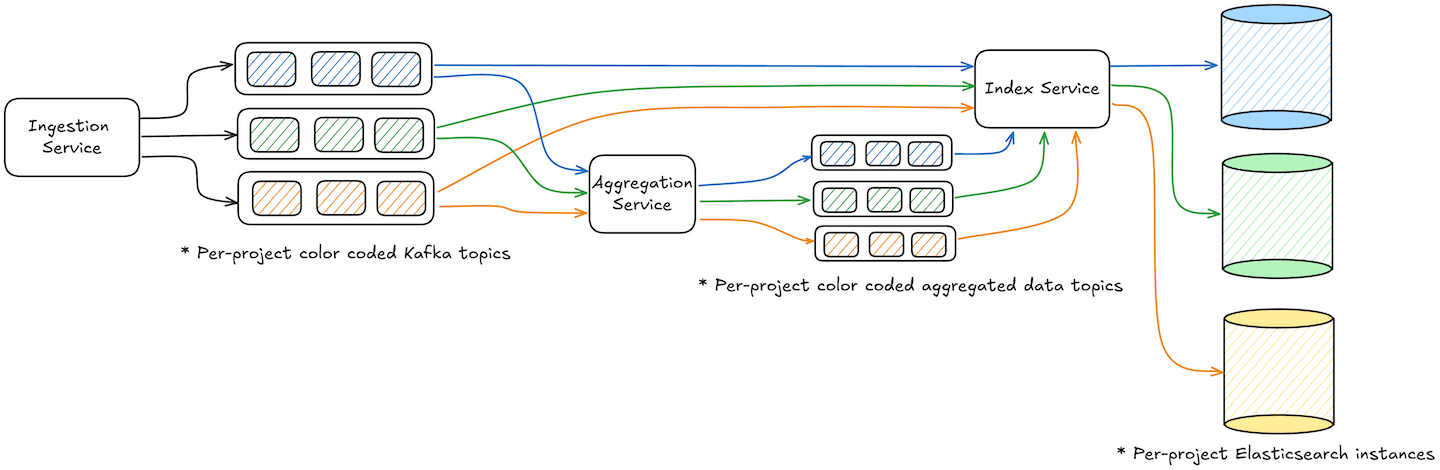
Additionally, given how Kafka partitioning works, it also allows partition scaling to meet increasing data volumes when single consumers are unable to cope with the load.
Observing the system
A simpler system is always easy to observe and while splitting our services was driven by necessity it also introduced observability challenges. More services may also translate into more (potential) points of failure. To alleviate the issue, we decided to observe our system based on customer impact.
To this end, we decided to monitor our services using Service Level Objectives (SLOs). SLOs gave us the required framework to objectively reason about the performance of our service, but we didn’t stop here. Since our goal was measuring customer impact, we drew out the critical user journeys and designed our SLOs to cover these.
The next challenge was implementing SLOs. Fortunately for us, the broader Observability team was working on launching Service Level Objectives (SLOs) and we became one of the first users.
To power the Service Level Indicators (SLIs) that power the SLOs, we carefully instrumented our services using a combination of metrics, logs and traces (surprise!). The majority of our SLOs are powered by metrics, since our services are fairly high-throughput services but lower-throughput SLOs are also powered by log sources.
Since we focused on the customer’s impact and the different areas where things could go wrong, we had a very broad (and deep) initial instrumentation from the beginning. It greatly facilitated investigating pages and recurring issues in our new ingestion platform.
Today, all our user journeys are monitored using SLOs end-to-end allowing us to proactively detect and resolve any issues before it bothers you, our customers.
Level up your observability stack with the Managed Intake Service
Managed Intake Service aims to level-up Elastic's observability offering by providing a seamless interface for our users to ingest their telemetry signals without thinking about the scale of data or spending business hours computing the infrastructure requirements to reliably host their current and near-future data. The service is live on Elastic Cloud and available to you when you create an Observability project in our serverless offering.
Redesigning ingest for our observability platform has been a lot of fun for us and we hope it will help you level up your observability stack. While this blog post covered high-level architecture of Managed Intake Services, there is still much more to talk about. Keep an eye out for future posts where we will delve deeper into individual components.
Frequently Asked Questions
What is Elastic's Managed Intake Service?
Managed Intake Service provides a seamless interface for our users to ingest their telemetry signals without thinking about the scale of data or spending business hours computing the infrastructure requirements to reliably host their current and near-future data.
Where can I access Elastic's Managed Intake Service?
The service is live on Elastic Cloud and available to you when you create an Observability project in our serverless offering.
Related Content
January 22, 2026
Agent Builder now GA: Ship context-driven agents in minutes
Agent Builder is now GA. Learn how it allows you to quickly develop context-driven AI agents.

January 14, 2026
Higher throughput and lower latency: Elastic Cloud Serverless on AWS gets a significant performance boost
We've upgraded the AWS infrastructure for Elasticsearch Serverless to newer, faster hardware. Learn how this massive performance boost delivers faster queries, better scaling, and lower costs.
December 16, 2025
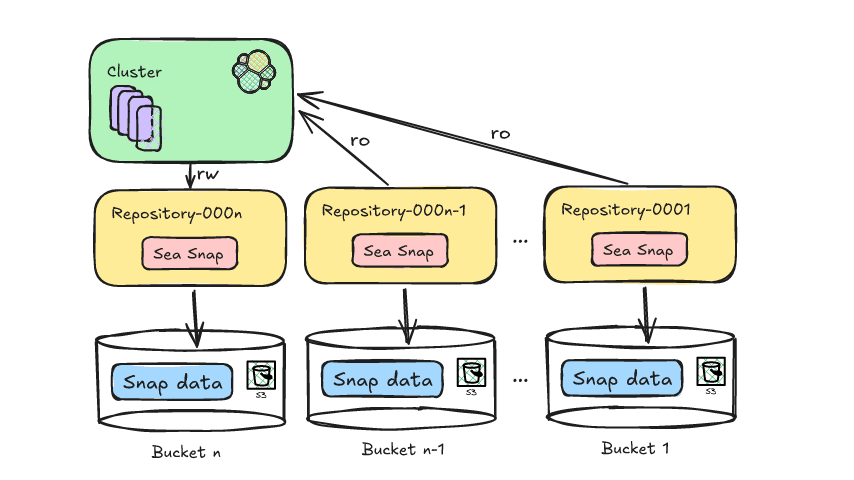
Reducing Elasticsearch frozen tier costs with Deepfreeze S3 Glacier archival
Learn how to leverage Deepfreeze in Elasticsearch to automate searchable snapshot repository rotation, retaining historical data and aging it into lower cost S3 Glacier tiers after index deletion.

September 22, 2025
Elastic Open Web Crawler as a code
Learn how to use GitHub Actions to manage Elastic Open Crawler configurations, so every time we push changes to the repository, the changes are automatically applied to the deployed instance of the crawler.

August 6, 2025
How to display fields of an Elasticsearch index
Learn how to display fields of an Elasticsearch index using the _mapping and _search APIs, sub-fields, synthetic _source, and runtime fields.