Elasticsearch allows you to index data quickly and in a flexible manner. Try it free in the cloud or run it locally to see how easy indexing can be.
This is the second installment in a multi-part blog series exploring different options for ingesting data from AWS S3 into Elastic Cloud. Check out the other parts of the series:
In this blog we will learn about how to ingest data from AWS S3 using Elastic Agent.
Note 1: See different options comparison in Part 1 : Elastic Serverless Forwarder
Note 2: Elastic Cloud deployment is a prerequisite to follow along the steps described below.
Elastic Cloud
Check the Part 1 : Elastic Serverless Forwarder of the blog series on how to get started with Elastic Cloud. Skip this if you already have a active deployment.
Elastic Agent for AWS S3 data ingestion
Another option to ingest data from AWS S3 is using Elastic Agent. Elastic Agent is a single, unified way to ingest data such as logs, metrics. Elastic agent is installed on an instance such as EC2 and using integrations can connect to the AWS services such as S3 and can forward the data to Elasticsearch.
High level Elastic Agent working:
- A policy is created which is like a manifest file and consist of instructions for agent.
- In the policy integrations are added which are essentialy modules consists of assets such as configs, mappings, dashboards etc.
- Agents are installed with the required policy.
- Agent will perform ingestion action based on the integrations.
Features of Elastic Agent
- Ships both Logs & Metrics
- Support data transfer over AWS PrivateLink
- Support all integrations and agent can be managed using Fleet (comes default with Elastic Cloud)
- Agents needs to be installed and maintaned and there is no autoscaling. Using Fleet can simplify the agent maintenance.
- Good performance out of the box and performance parameters can be configured to use performance presets. Preset can be used depending on the data type and ingestion requirement. More about Fleet server scalability here
- Cost is of EC2 instance for agent installation and for SQS notification
Data flow
High level data flow for Elastic Agent based data ingestion:
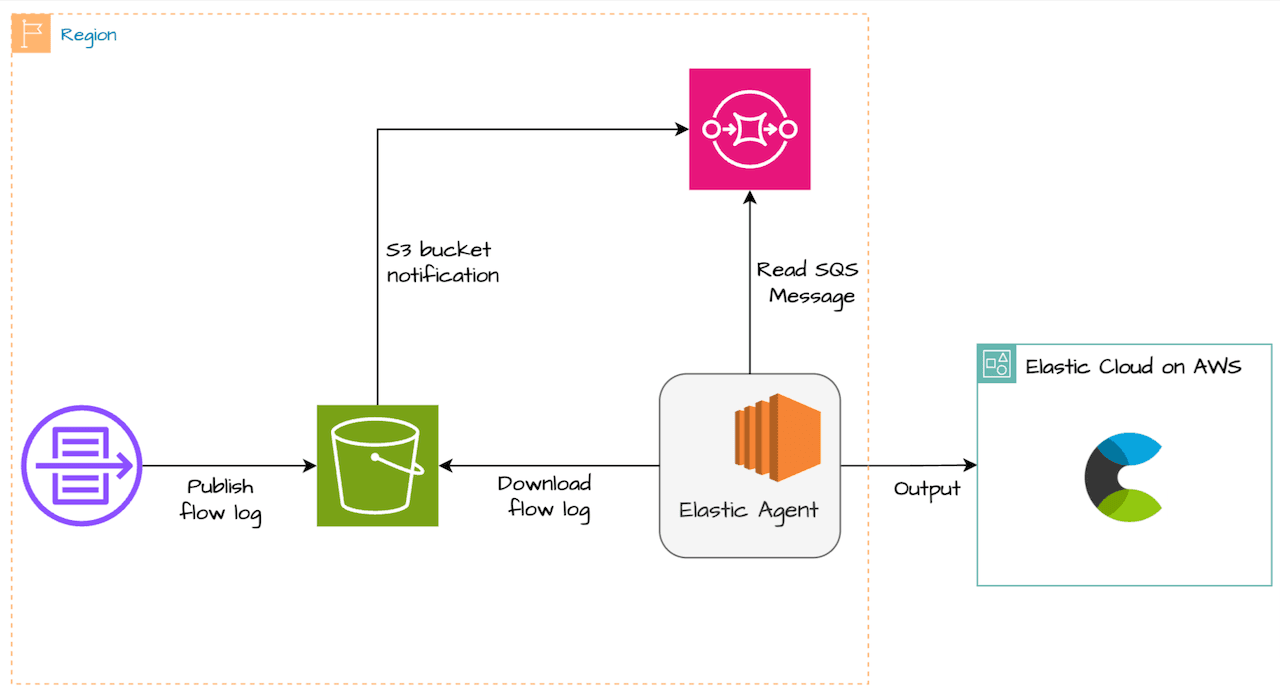
- VPC flow log is configured to write to S3 bucket
- Once log is written to S3 bucket, S3 event notifications is sent to SQS
- Elastic agent polls SQS queue for new message. Based on the metadata in the message it reads the log data from S3 bucket and send it to Elasticsearch
- SQS is recommeded for performance so that agent can read only the new updated objects in S3 bucket instead of polling entire bucket each time
Set up
For Steps (1)-(2), follow the details from Part 1 : Elastic Serverless Forwarder:
1. Create S3 Bucket to store VPC flow logs
2. Enable VPC Flow logs and send to S3 bucket created above
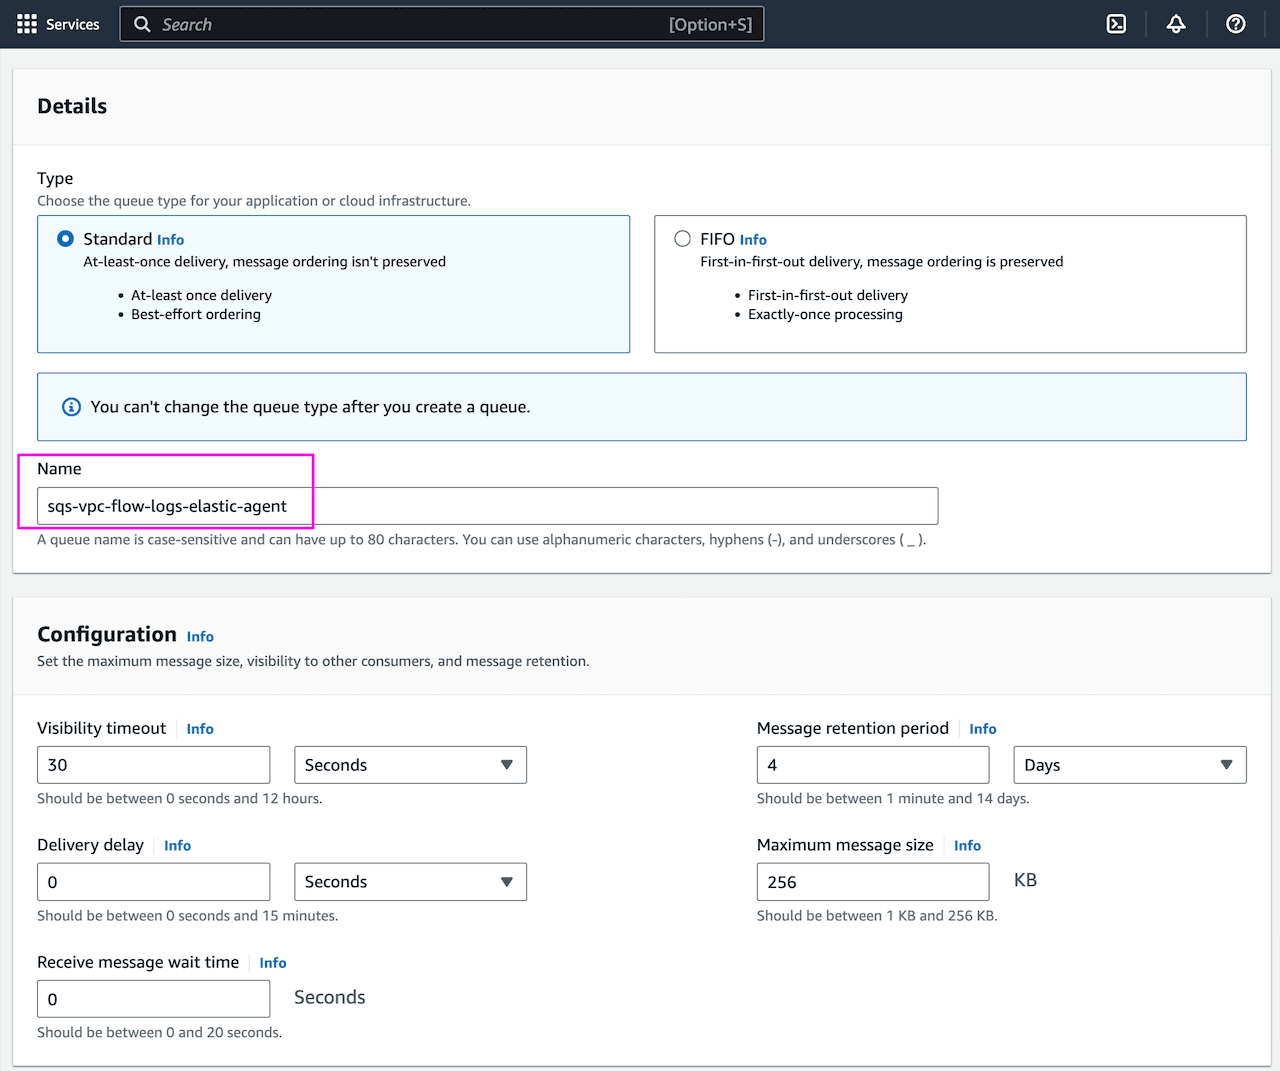
3. Create SQS queue with default settings
Note: Create SQS queue in same region as S3 bucket
Provide queue name sqs-vpc-flow-logs-elastic-agent and keep the other setting as default:
Update the SQS Access Policy (Advance) to allow s3 bucket to send notification to SQS queue. Replace account-id with your AWS account id. Keep other options as default.
Here, we are specifying S3 to send message to SQS queue (ARN) from the S3 bucket:

Note the SQS URL, in queue setting under Details:

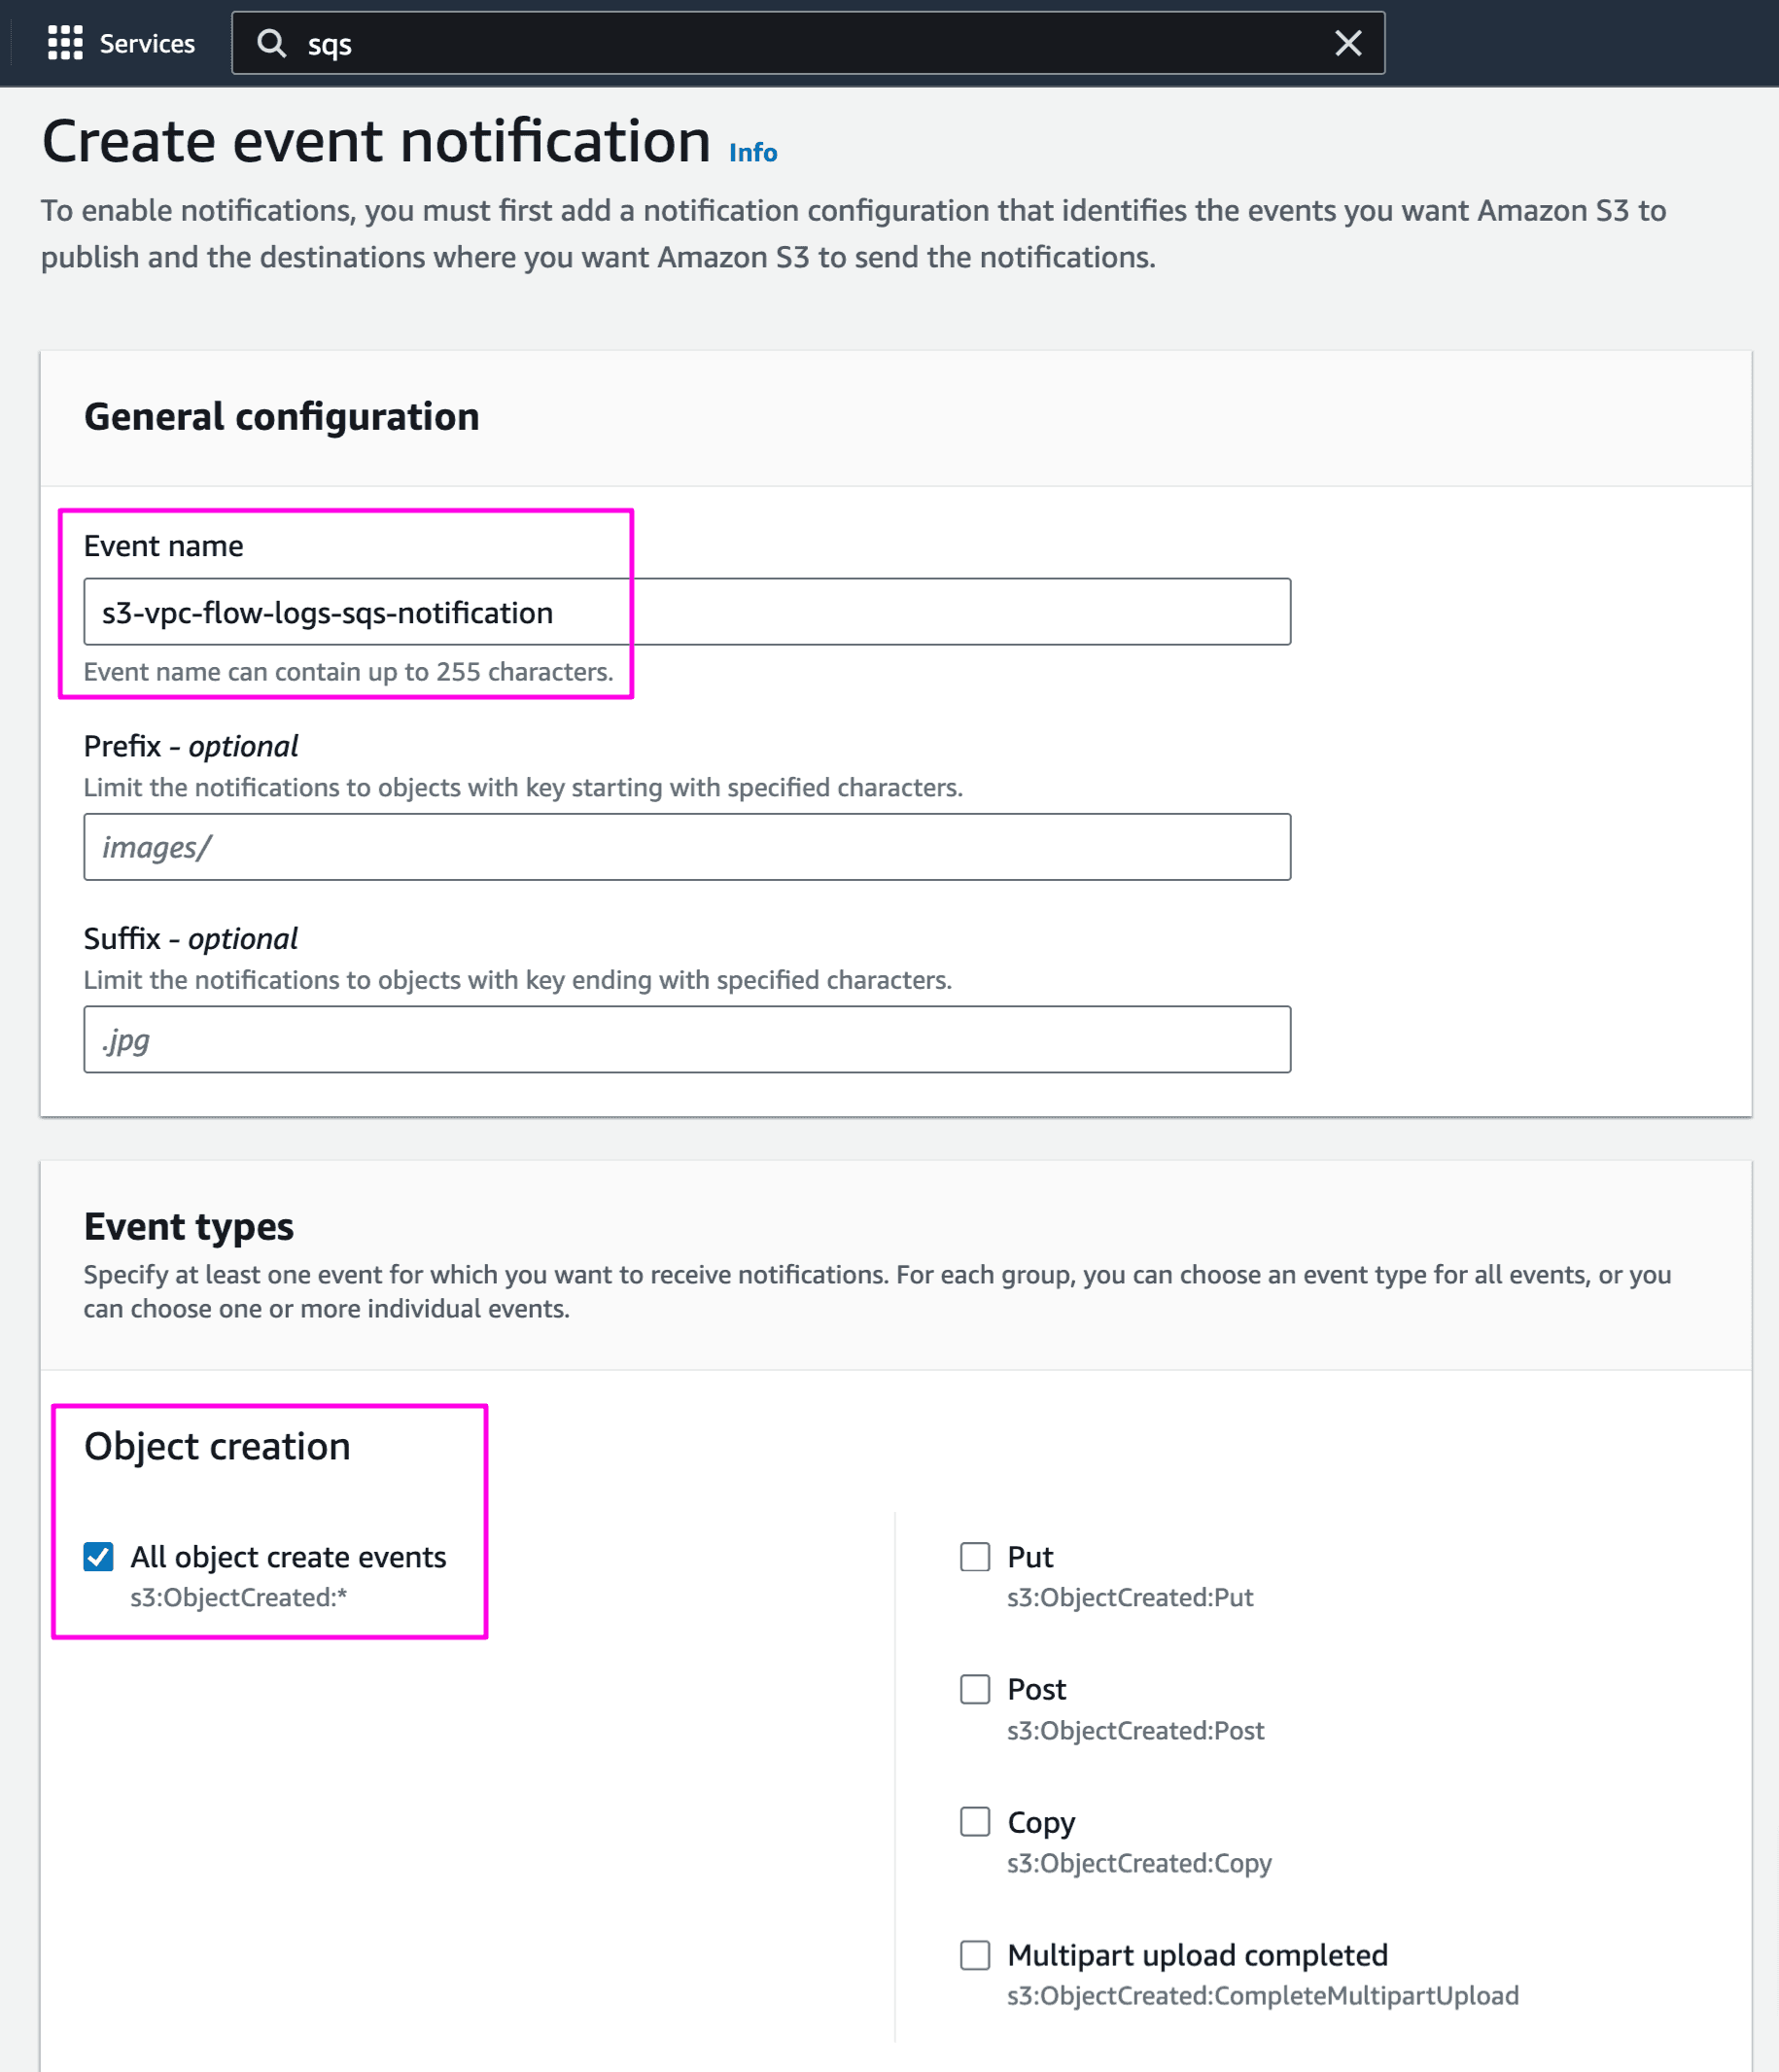
4. Enable VPC flow log event notification in S3 bucket
Go to S3 bucket s3-vpc-flow-logs-elastic -> Properties and Create event notification
Provide name and on what event type you want to trigger SQS. We have selected object create when any object is added to the bucket:
Select destination as SQS queue and choose sqs-vpc-flow-logs-elastic-agent:
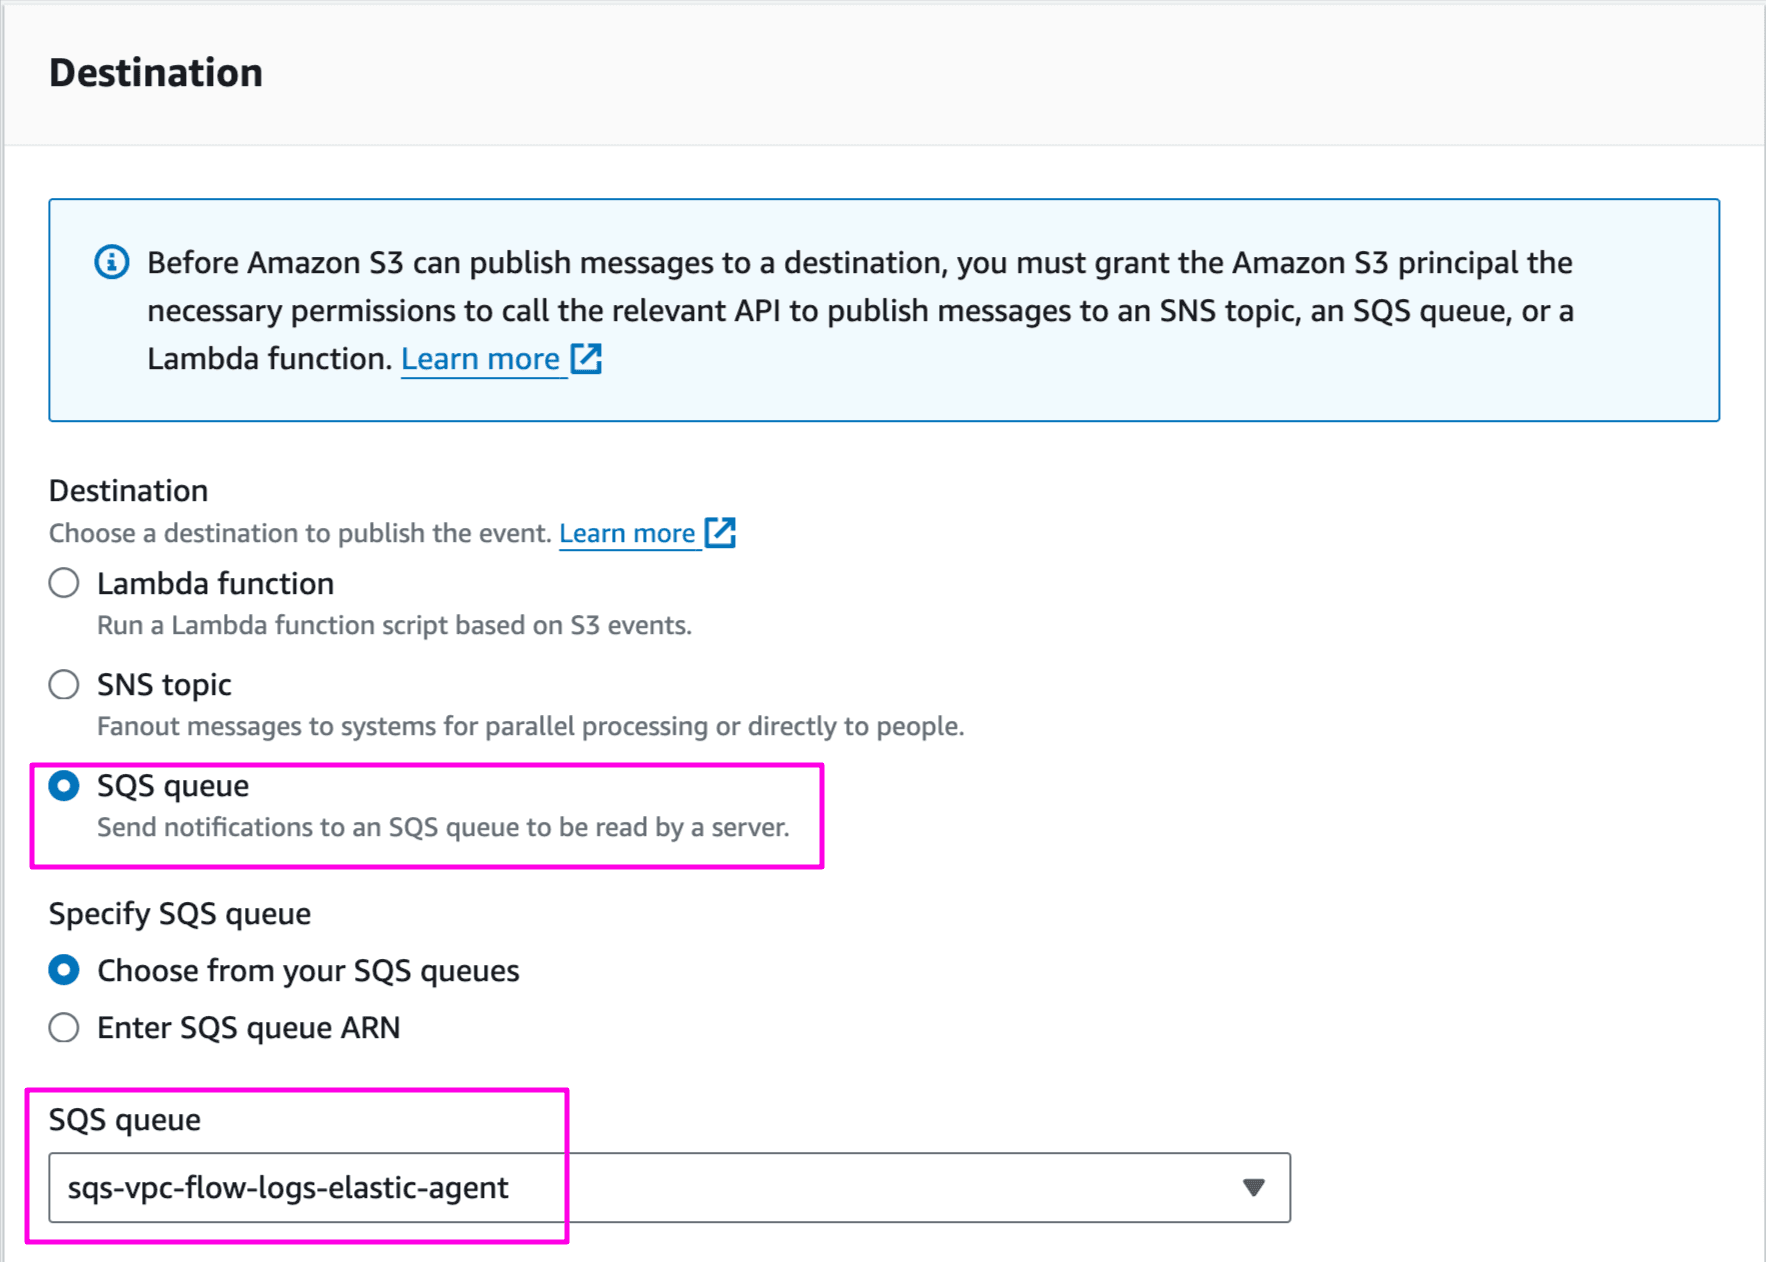
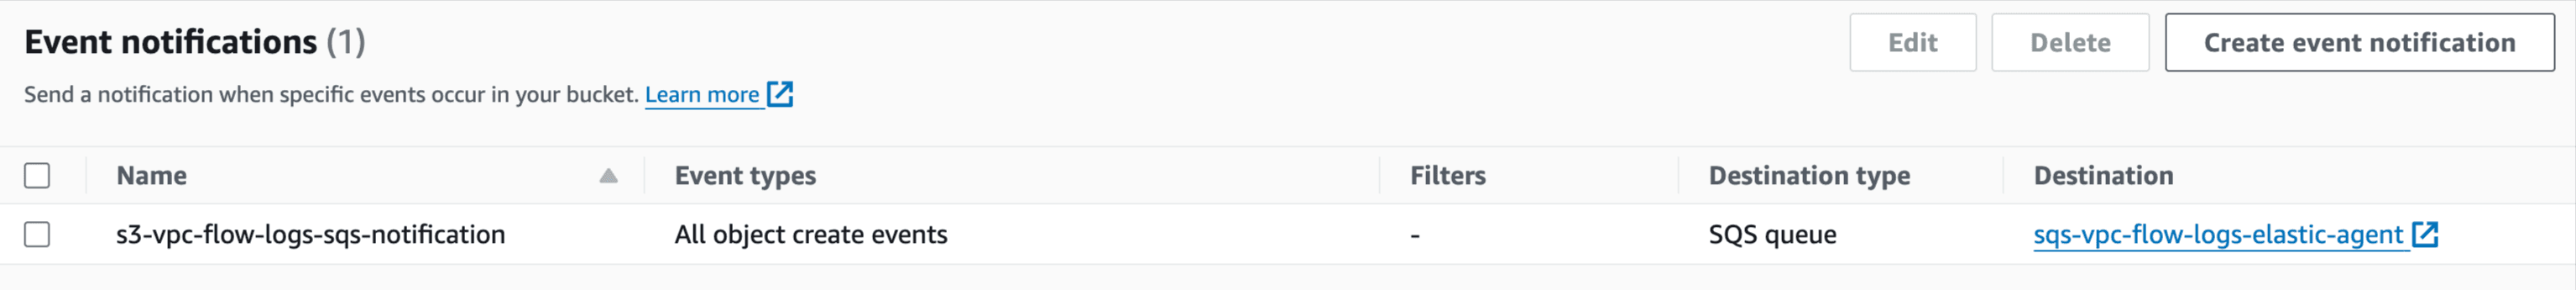
Once saved, configuration will look like below:
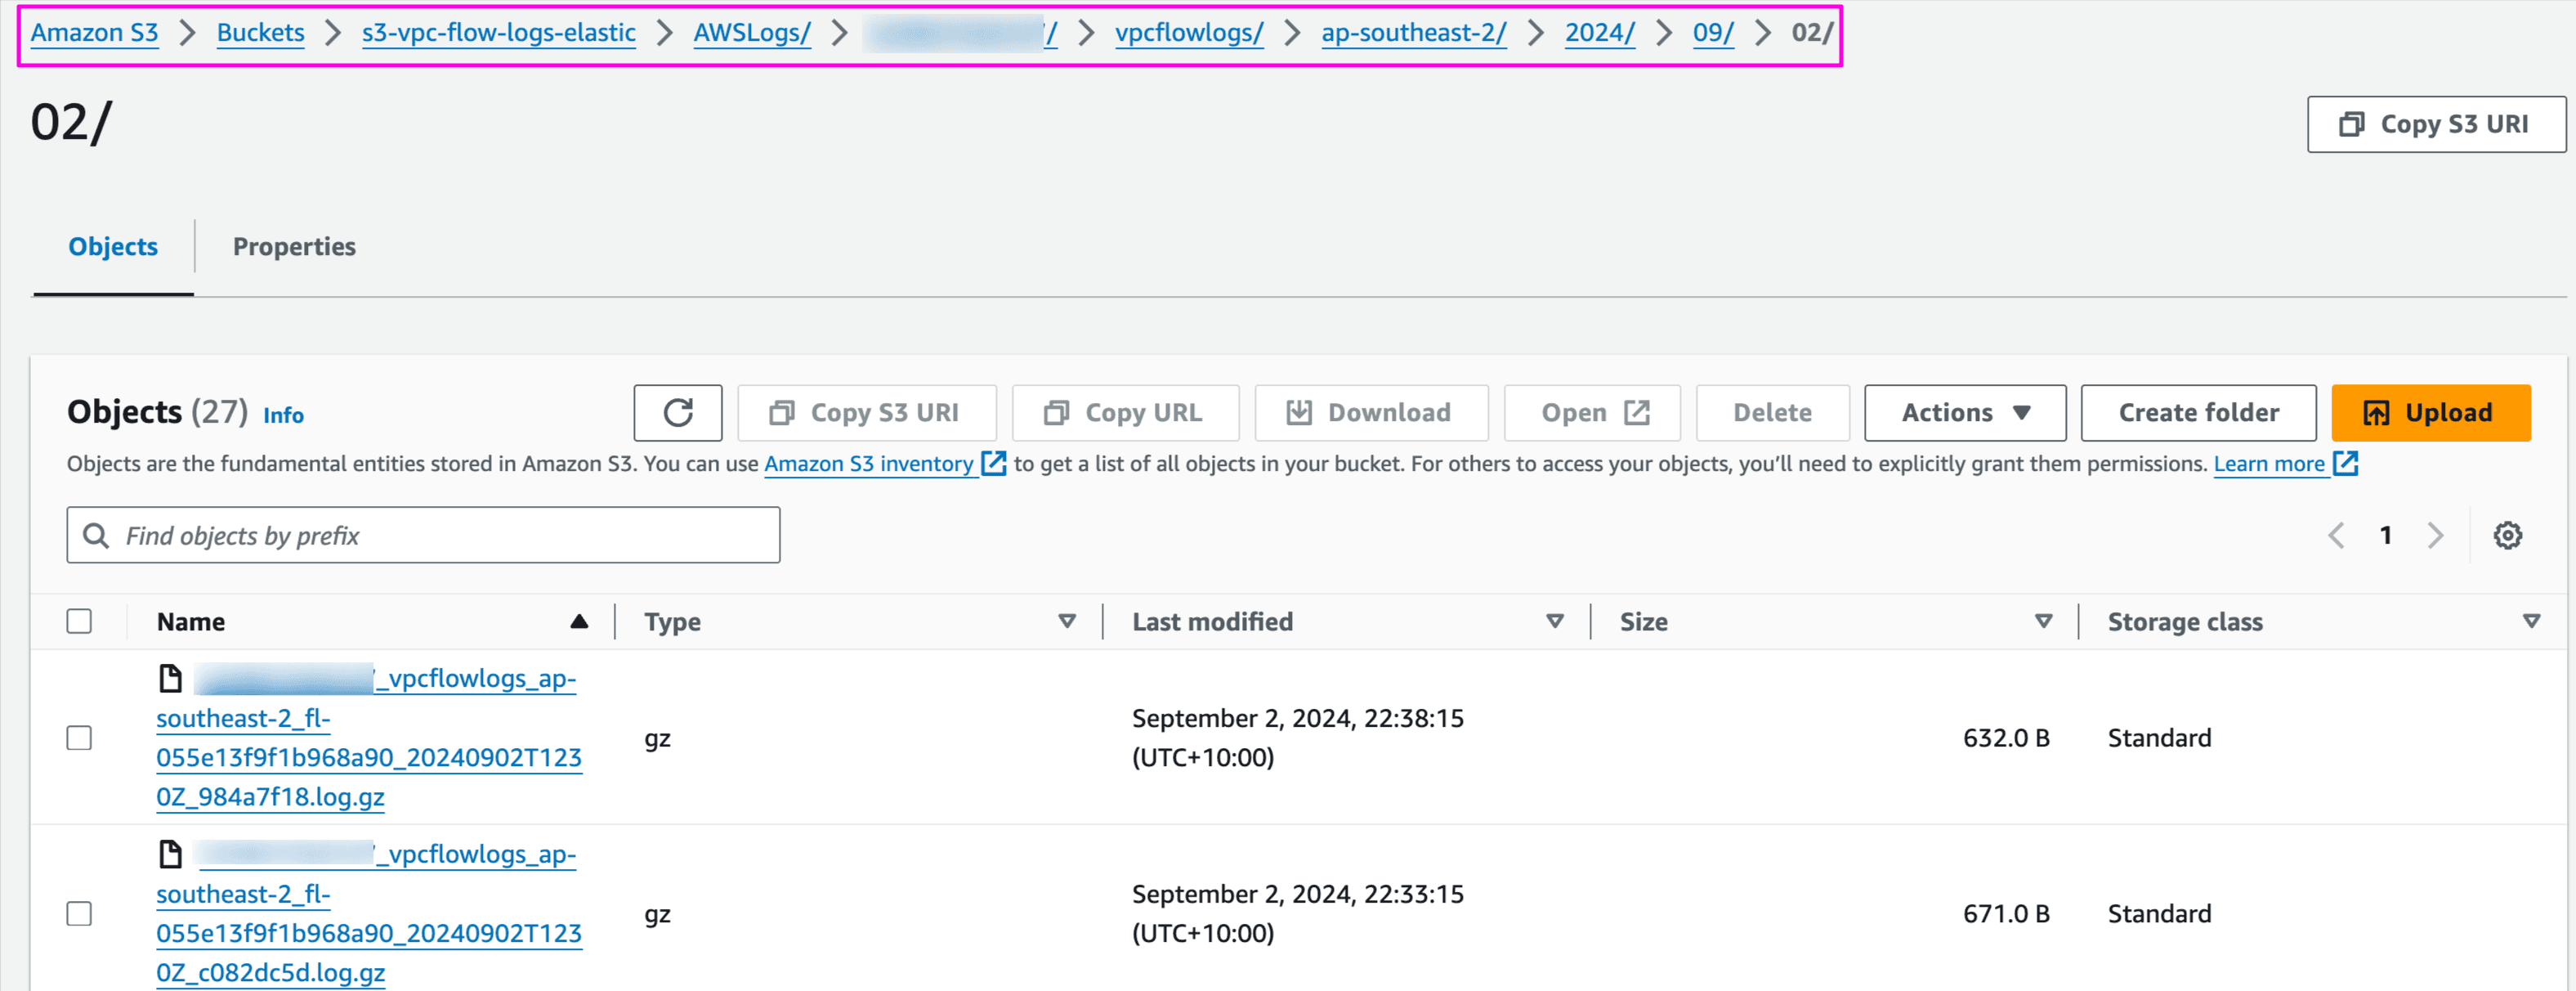
Confirm VPC flow logs are published in S3 bucket:
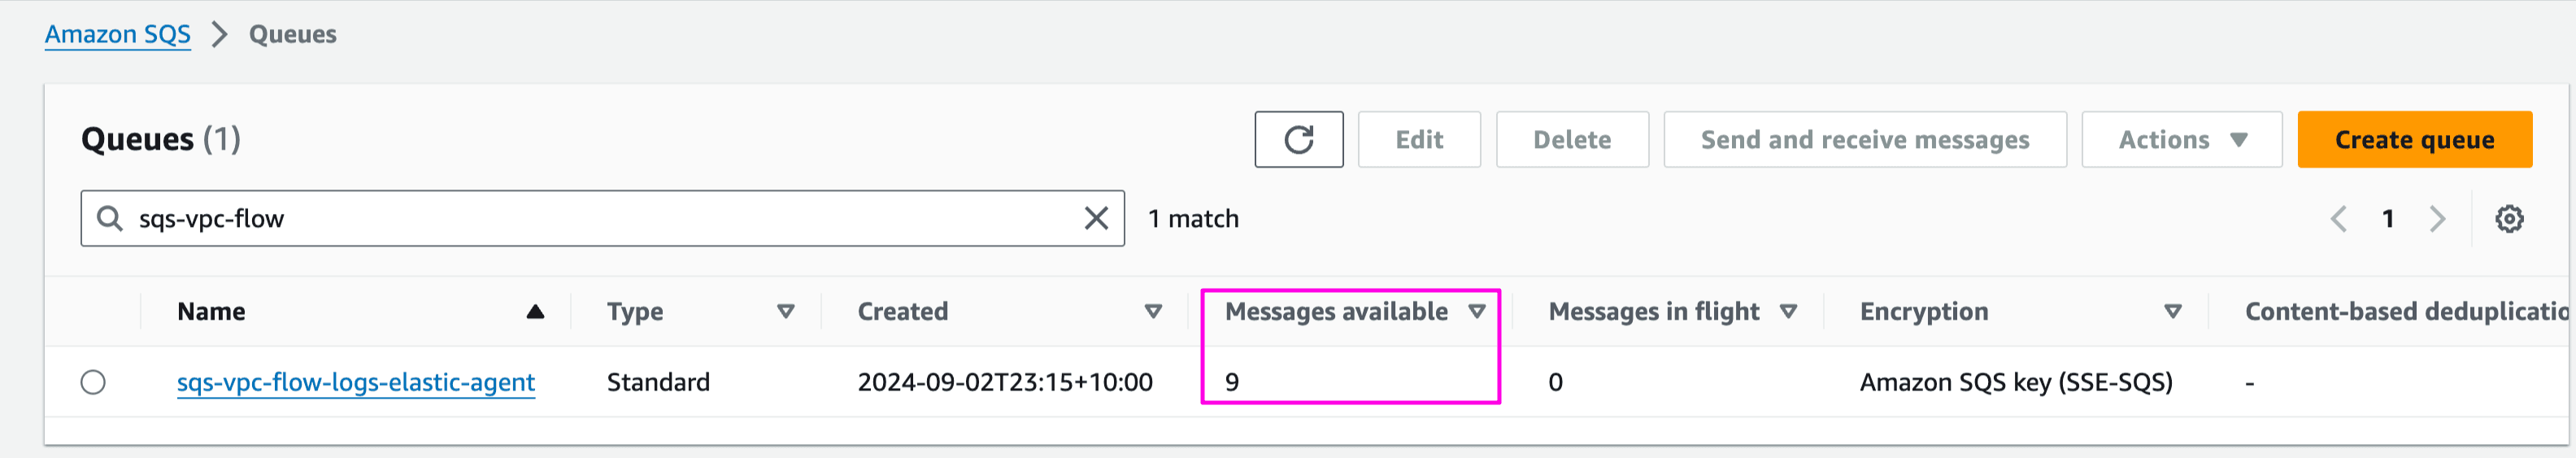
Confirm S3 event notification is sent to SQS queue:
5. Install Elastic Agent on EC2 instance
Launch an EC2 instance
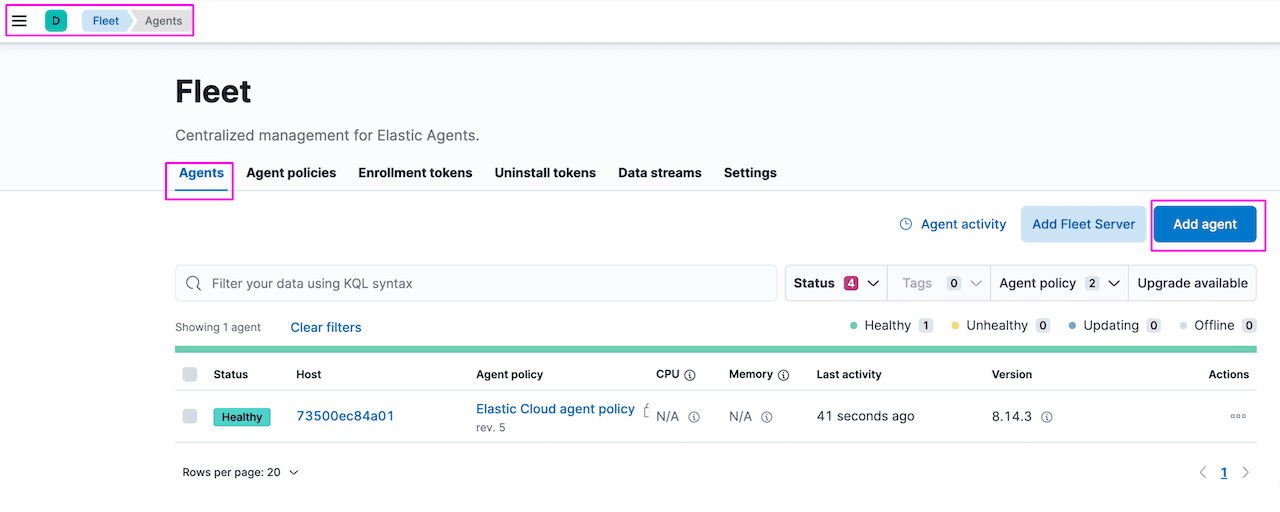
To get the installation commands, Go to:
Kibana -> Fleet -> Add Agent
Create new agent policy aws-vpc-flow-logs-s3-policy and click Create Policy.
Once policy is created, copy the instruction to install Elastic Agent. Leave other settings as default:
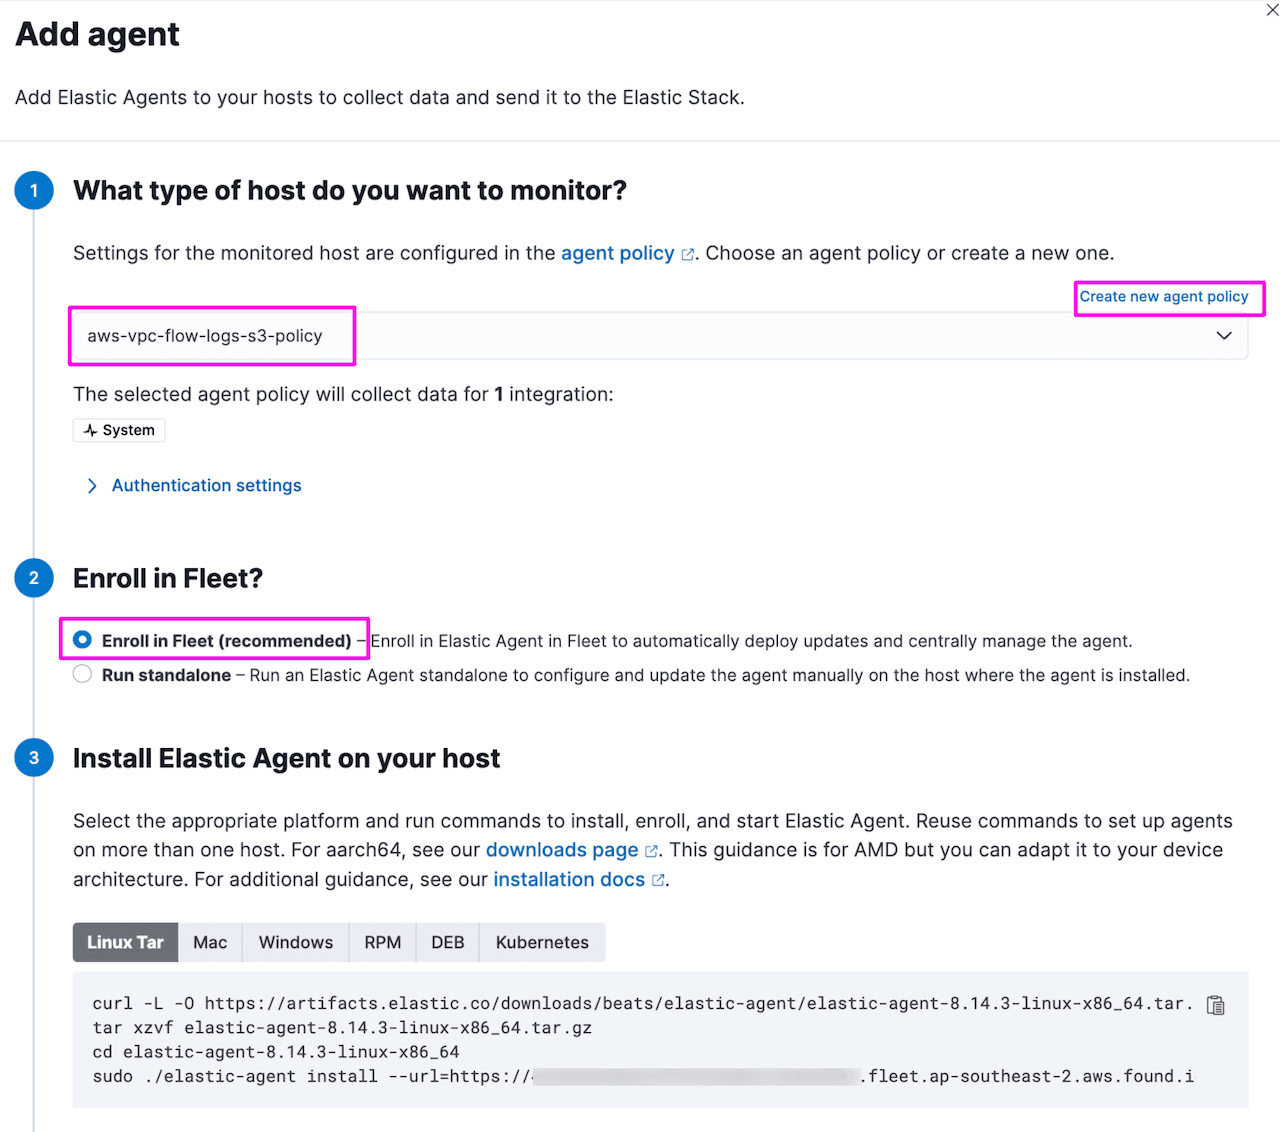
Login to EC2 instance and run the commands:
Upon successful completion, status will be updated on fleet page:

Update policy aws-vpc-flow-logs-s3-policy with aws integration. This will push aws integration configuration to the agent which is subscribed to this policy. More on how fleet and agent work together is here.
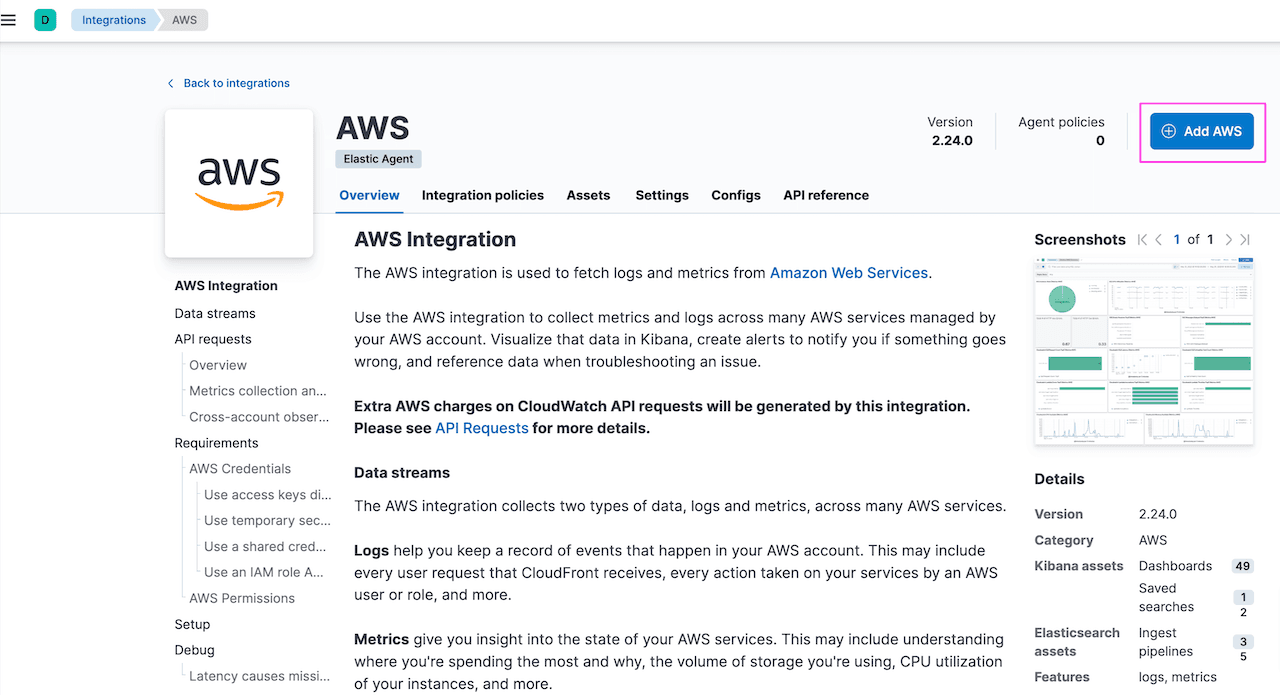
Kibana -> Fleet -> Agent policies. Select the policy aws-vpc-flow-logs-s3-policy and click Add integration. This will take you to the integration page search for AWS integration. Choosing AWS integration is better if you want monitor more than 1 AWS service:
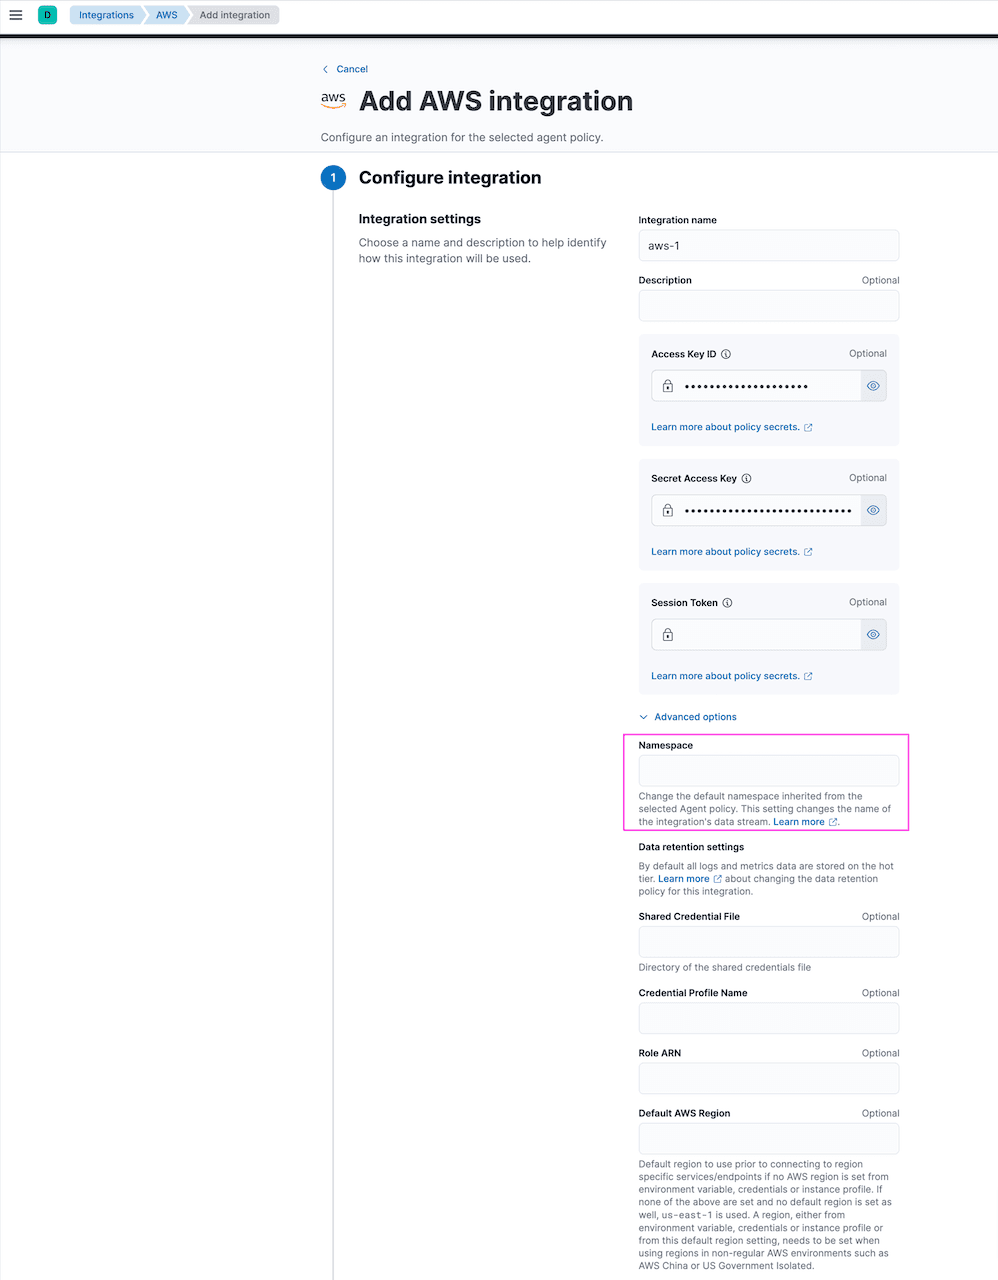
Provide AWS Access Key ID and Secret Access Key for authentication and allow Elastic Agent to read from AWS services. There are other authentication options available. Details here. Namespace option is used to segregate the data based on environment or any other identifier:
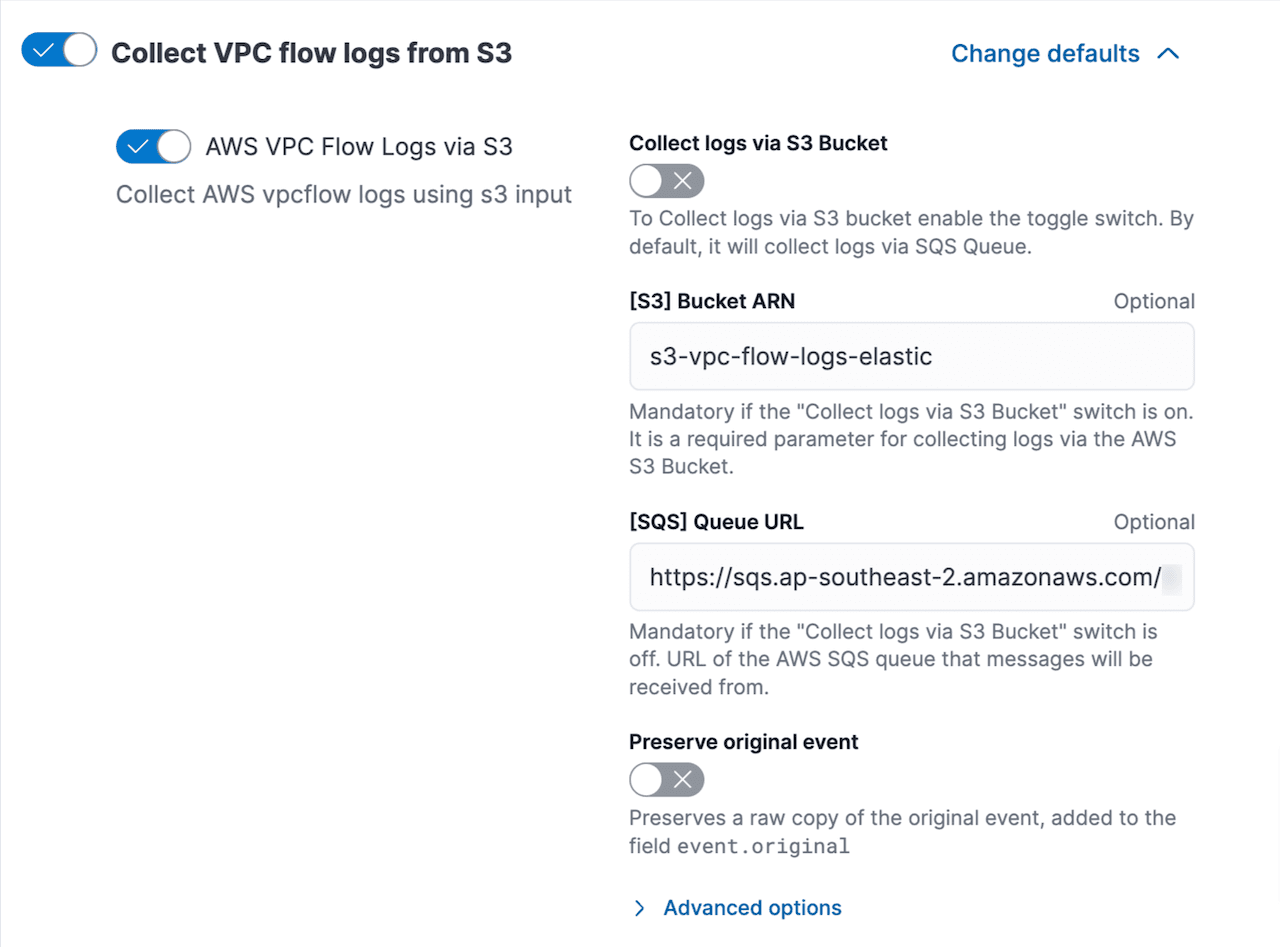
Toggle off other services and use Collect VPC flow logs from S3 . Update S3 bucket and SQS queue URL copied earlier. Leave advance settings as default:
Scroll down and click Existing hosts option as we have already intalled the agent and select the policy aws-vpc-flow-logs-s3-policy. Save and continue. This will push the configured integration to Elastic Agent:

Go to Kibana -> Fleet -> Agent policies and policy aws-vpc-flow-logs-s3-policy is updated with AWS integration.
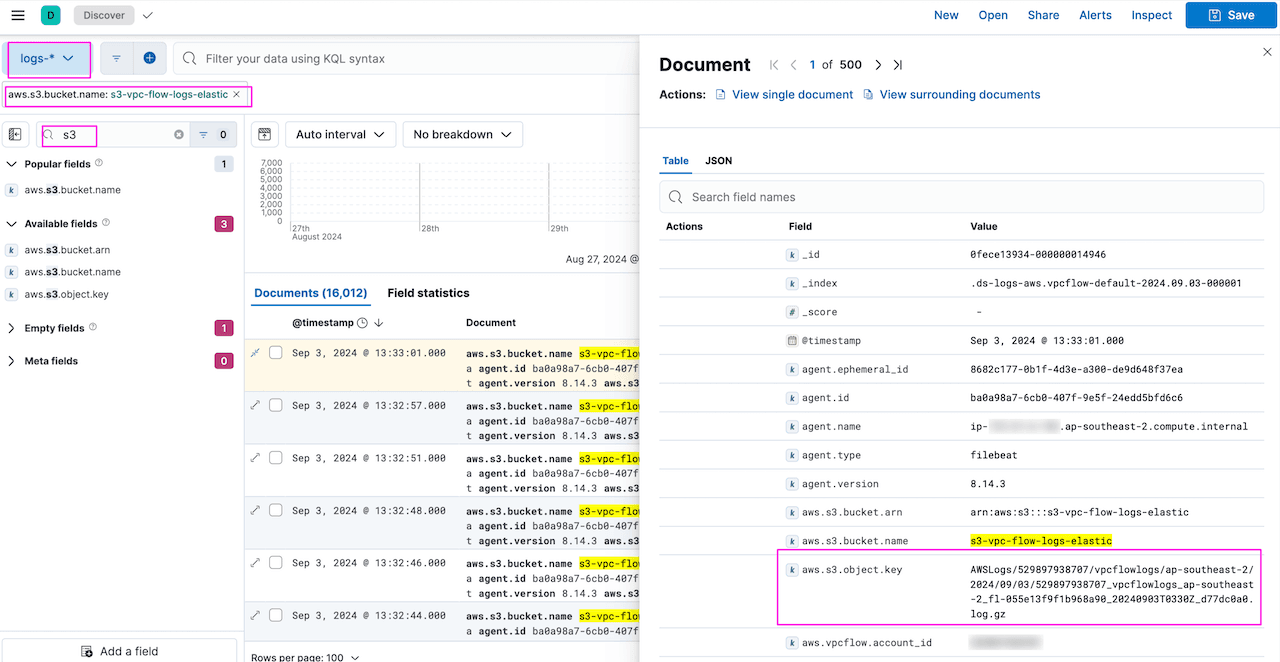
After a couple of minutes, you can validate flow logs are ingested from S3 into Elastic. Go to Kibana -> Discover:
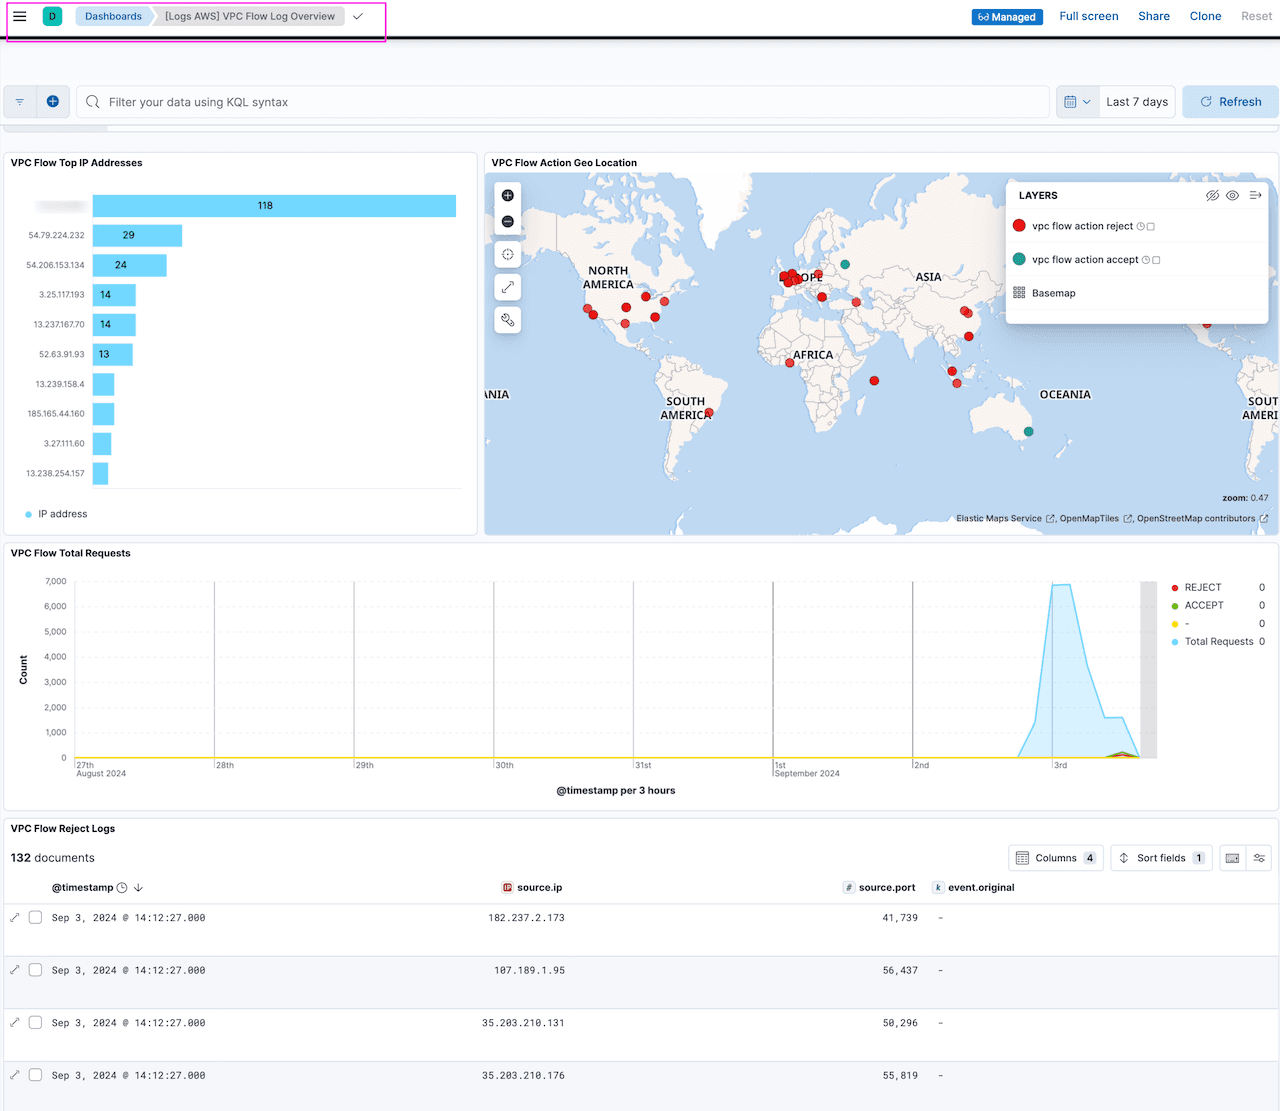
6. Monitor VPC flow logs in Kibana dashboards
Integrations comes with assets such as dashboard which are pre-built for common use cases. Go to Kibana -> Dashboard and search for VPC Flow logs:
More dashboards!
As promised, here are few dashboards that can help monitor AWS services used in our setup using the Elastic agent ingestion method. This will help in tracking usage and help in optimisation.
We will use the same setup used in the Elastic Agent data ingestion option to configure settings and populate dashboards.
Go to Kibana -> Fleet -> aws-vpc-flow-logs-s3-policy . Select AWS integration and toggle on the required service and fill in the details.
Some of the interesting Dashboards:
Note: All dashboards are available under Kibana->Analytics->Dashboards
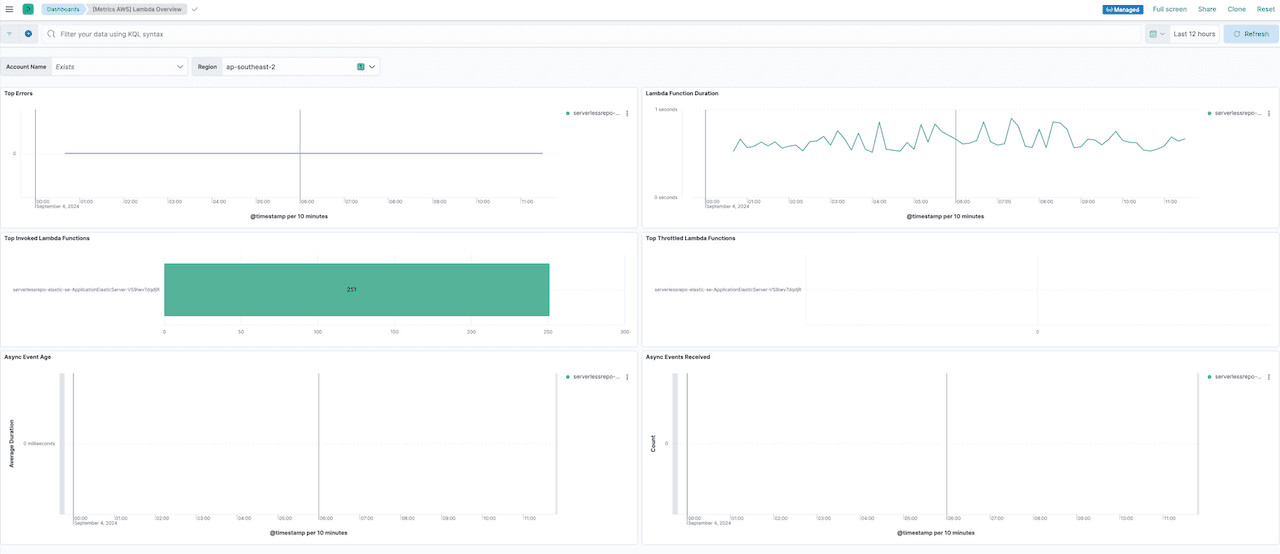
[Metrics AWS] Lambda overview
If you have implemented ingestion using Elastic Serverless Forwarder, then you can use this dashboard to track AWS Lambda metrics. It mainly shows Lambda function duration, errors, and any function throttling:
[Metrics
This dashboard outlines S3 usage and helps in monitoring bucket size, number of objects, etc. This can help in optimisation of S3 usage by tracking stale buckets and objects:

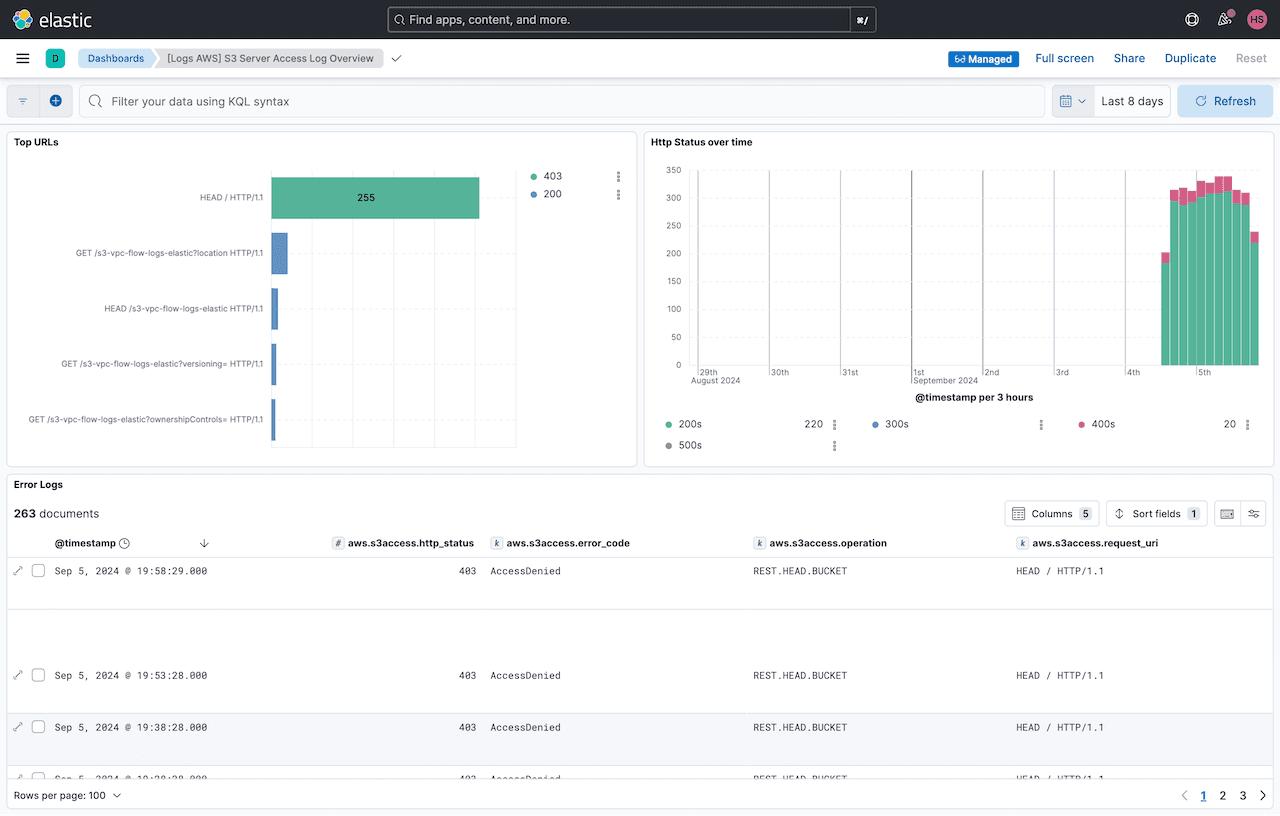
[Logs AWS] S3 server access log overview
This dashboard shows S3 server access logging and provides detailed records for the requests that are made to a bucket. This can be useful in security and access audits and can also help in learning how users access your S3 buckets and objects:
[Metrics AWS] Usage overview
This dashboard shows the general usage of AWS services and highlights API usage against AWS services. This can help in understanding the service usage and potential optimisation:

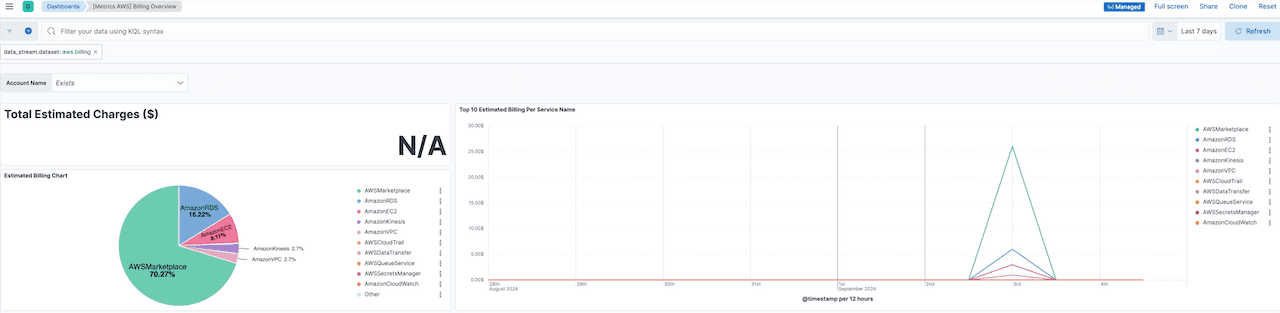
[Metrics AWS] Billing overview
This dashboard shows the billing usage by service and helps monitor how many $$ are spent for the services:
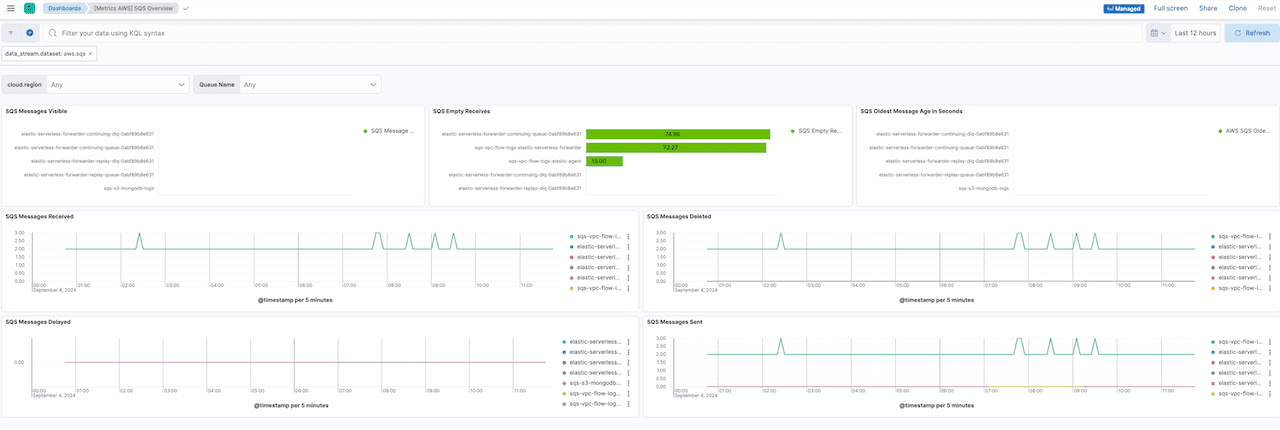
[Metrics AWS] SQS
This dashboard shows SQS queues utilisation showing messages sent, received and any delay in sending messages. This is important in monitoring the SQS queues for any issues as it is an important component in the architecture. Any issues with SQS can potentially cause delay in data ingestion:
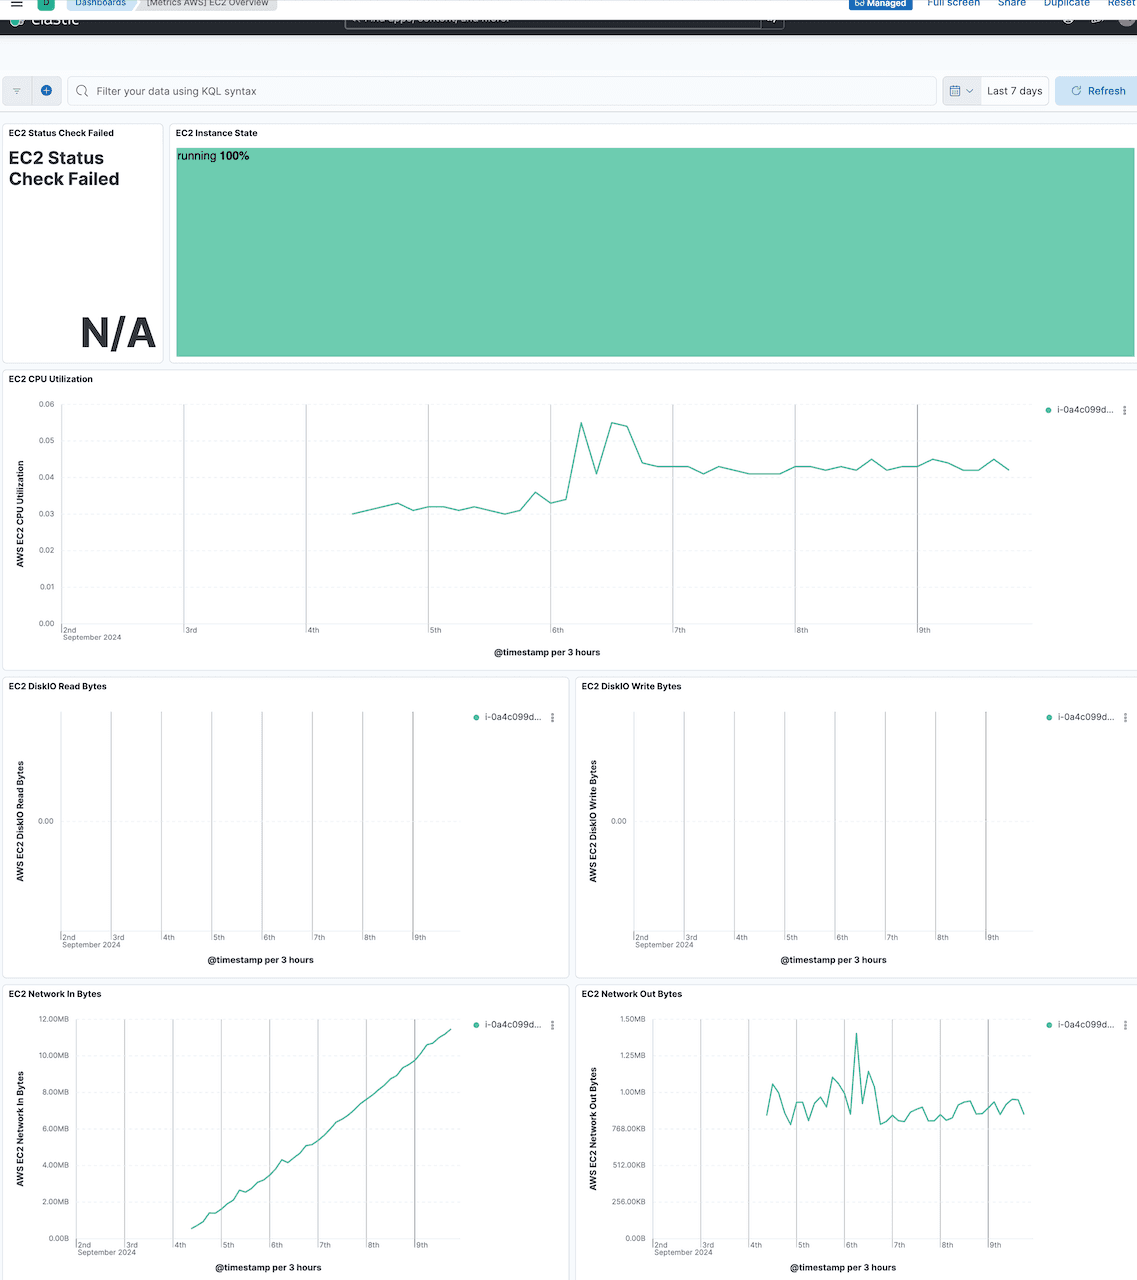
[Metrics AWS] EC2
If you are using the Elastic agent ingestion method, then you can monitor the utilisation of the EC2 instance for CPU, memory, disk, etc. hosting the Elastic agent, which can be helpful in sizing the instance if there is a high traffic load. This can also be used for your other EC2 instances:
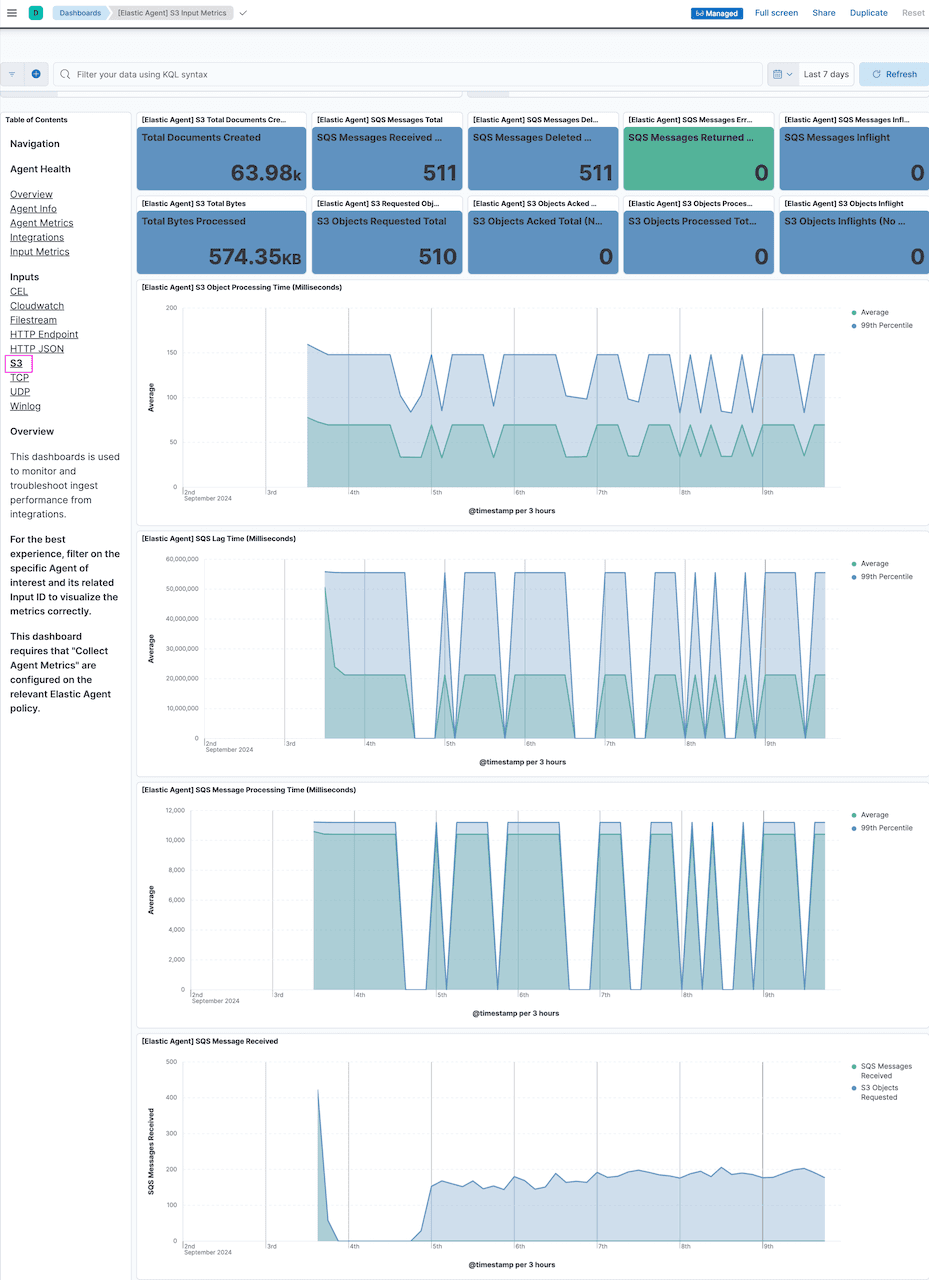
[Elastic Agent] S3 input metrics
This dashboard shows the detailed utilisation of Elastic agent showing how Elastic agent is processing S3 inputs and monitoring interaction with SQS and S3. The dashboard shows aggregated metrics of the Elastic agent on reading SQS messages and S3 objects and forwarding them to Elasticsearch. Together with the [Metrics AWS] EC2 Overview dashboard, this can help in understanding the utilisation of EC2 and Elastic agent and can potentially helps in scaling these components:
Conclusion
Elasticsearch provides multiple options to sync data from AWS S3 into Elasticsearch deployments. In this walkthrough, we have demonstrated that it is relatively easy to implement Elastic Agent ingestion options and leverage Elastic's industry-leading search capabilities.
In Part 3 of this series, we'll dive into using Elastic S3 Native Connector as another option for ingesting AWS S3 data.
Don't forget to check out Part 1 : Elastic Serverless Forwarder of the series and Part 3: Elastic S3 Connector.
Frequently Asked Questions
What is Elastic Agent?
Elastic Agent is a single, unified way to ingest data such as logs, metrics.
Related Content
December 16, 2025
Reducing Elasticsearch frozen tier costs with Deepfreeze S3 Glacier archival
Learn how to leverage Deepfreeze in Elasticsearch to automate searchable snapshot repository rotation, retaining historical data and aging it into lower cost S3 Glacier tiers after index deletion.

September 22, 2025
Elastic Open Web Crawler as a code
Learn how to use GitHub Actions to manage Elastic Open Crawler configurations, so every time we push changes to the repository, the changes are automatically applied to the deployed instance of the crawler.

August 6, 2025
How to display fields of an Elasticsearch index
Learn how to display fields of an Elasticsearch index using the _mapping and _search APIs, sub-fields, synthetic _source, and runtime fields.

July 14, 2025
Run Elastic Open Crawler in Windows with Docker
Learn how to use Docker to get Open Crawler working in a Windows environment.

June 24, 2025
Ruby scripting in Logstash
Learn about the Logstash Ruby filter plugin for advanced data transformation in your Logstash pipeline.