Identifying beaconing malware using Elastic

The early stages of an intrusion usually include initial access, execution, persistence, and command-and-control (C2) beaconing. When structured threats use zero-days, these first two stages are often not detected. It can often be challenging and time-consuming to identify persistence mechanisms left by an advanced adversary as we saw in the 2020 SUNBURST supply chain compromise. Could we then have detected SUNBURST in the initial hours or days by finding its C2 beacon?
The potential for beaconing detection is that it can serve as an early warning system and help discover novel persistence mechanisms in the initial hours or days after execution. This allows defenders to disrupt or evict the threat actor before they can achieve their objectives. So, while we are not quite "left of boom" by detecting C2 beaconing, we can make a big difference in the outcome of the attack by reducing its overall impact.
In this blog, we talk about a beaconing identification framework that we built using Painless and aggregations in the Elastic Stack. The framework can not only help threat hunters and analysts monitor network traffic for beaconing activity, but also provides useful indicators of compromise (IoCs) for them to start an investigation with. If you don’t have an Elastic Cloud cluster but would like to try out our beaconing identification framework, you can start a free 14-day trial of Elastic Cloud.
Beaconing — A primer
An enterprise's defense is only as good as its firewalls, antivirus, endpoint detection and intrusion detection capabilities, and SOC (Security Operations Center) — which consists of analysts, engineers, operators administrators, etc. who work round the clock to keep the organization secure. Malware however, enters enterprises in many different ways and uses a variety of techniques to go undetected. An increasingly common method being used by adversaries nowadays to evade detection is to use C2 beaconing as a part of their attack chain, given that it allows them to blend into networks like a normal user.
In networking, beaconing is a term used to describe a continuous cadence of communication between two systems. In the context of malware, beaconing is when malware periodically calls out to the attacker's C2 server to get further instructions on tasks to perform on the victim machine. The frequency at which the malware checks in and the methods used for the communications are configured by the attacker. Some of the common protocols used for C2 are HTTP/S, DNS, SSH, and SMTP, as well as common cloud services like Google, Twitter, Dropbox, etc. Using common protocols and services for C2 allows adversaries to masquerade as normal network traffic and hence evade firewalls.
While on the surface beaconing can appear similar to normal network traffic, it has some unique traits with respect to timing and packet size, which can be modeled using standard statistical and signal processing techniques.
Below is an example of a Koadic C2 beacon, which serves the malicious payload using the DLL host process. As you can see, the payload beacons consistently at an interval of 10 minutes, and the source, as well as destination packet sizes, are almost identical.
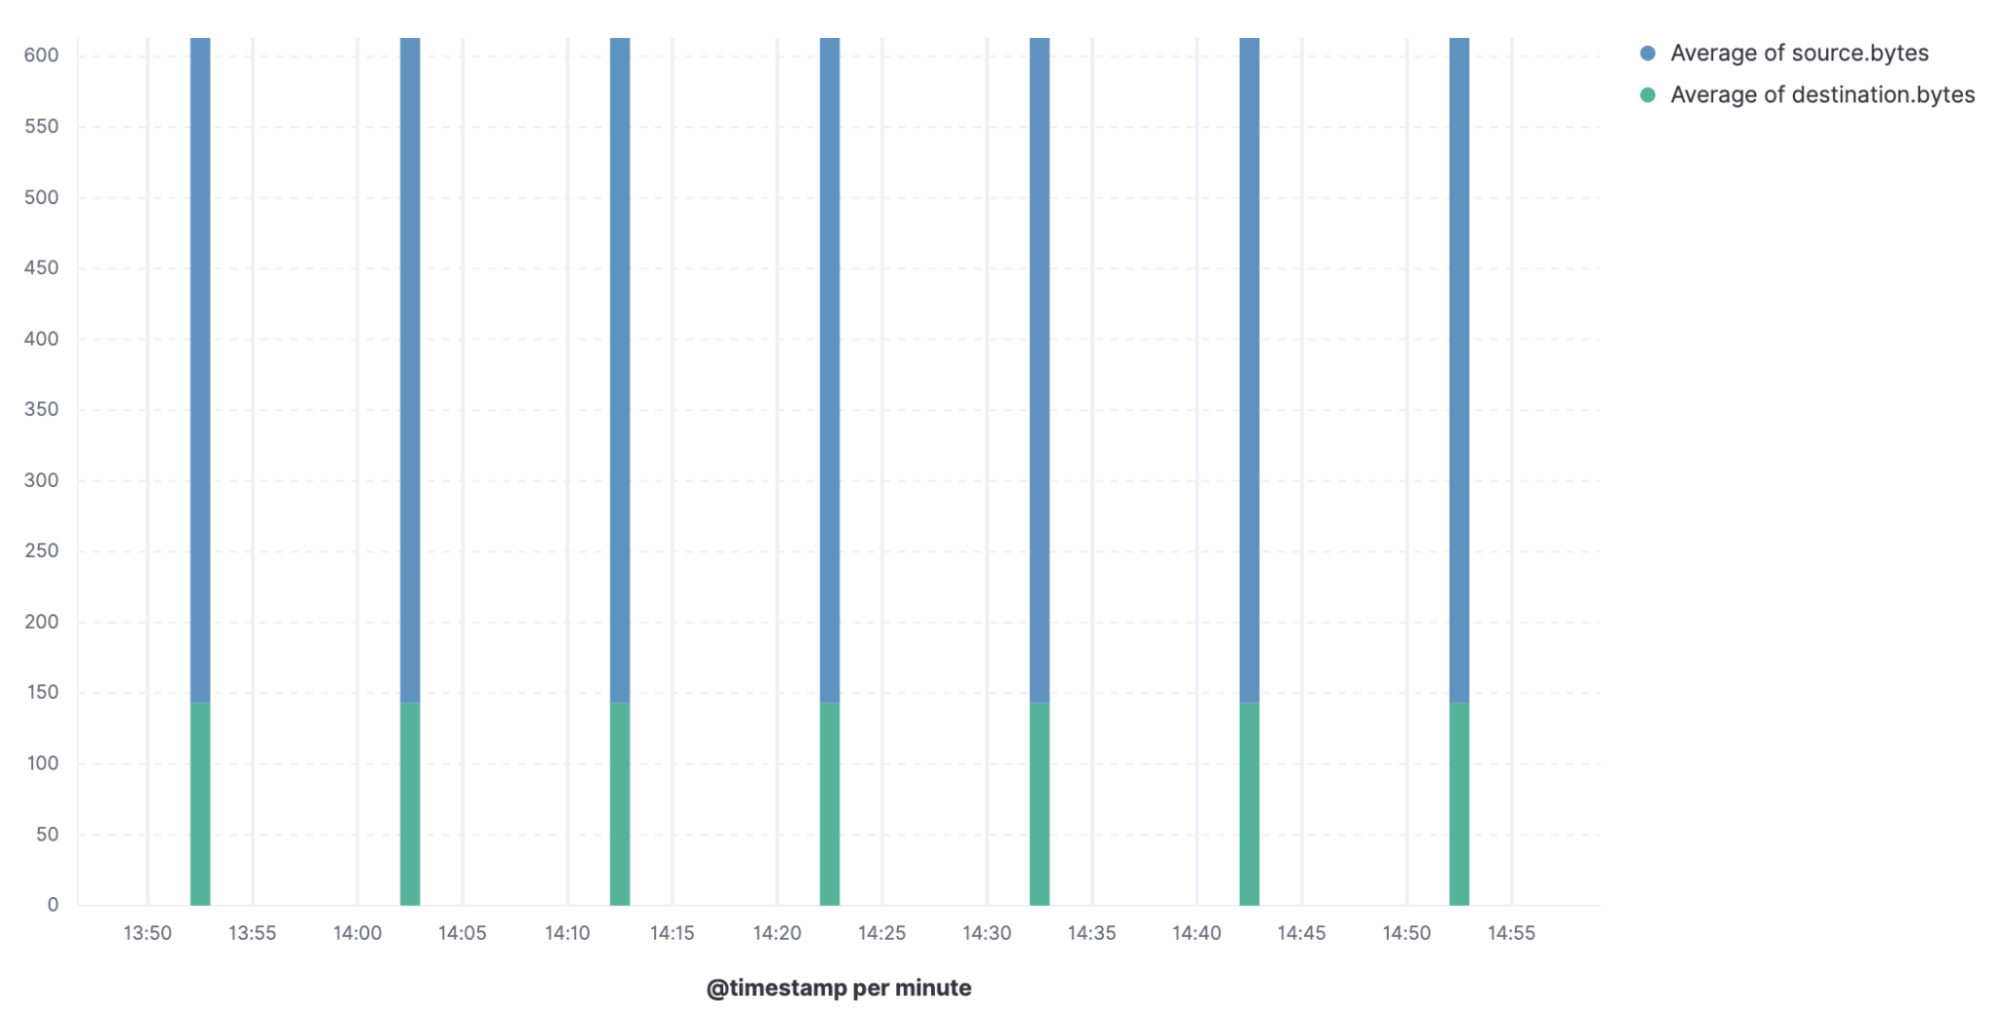
It might seem like a trivial task to catch C2 beaconing if all beacons were as neatly structured and predictable as the above. All one would have to look for is periodicity and consistency in packet sizes. However, malware these days is not as straightforward.
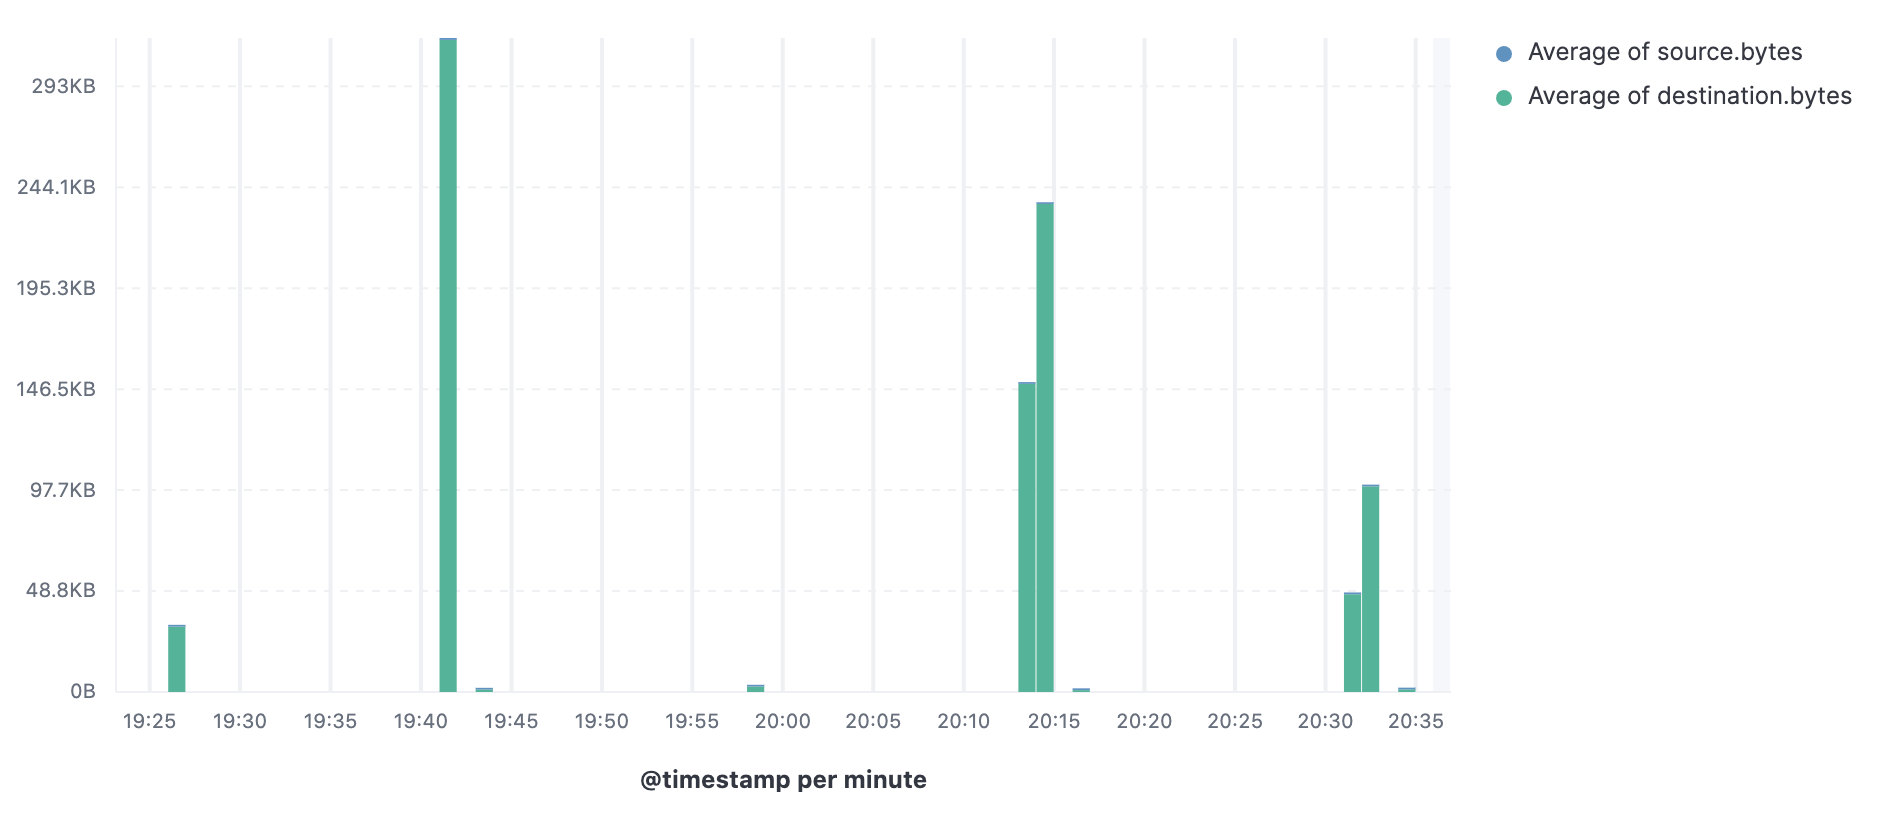
Most sophisticated malware nowadays adds a "jitter" or randomness to the beacon interval, making the signal more difficult to detect. Some malware authors also use longer beacon intervals. The beaconing identification framework we propose accounts for some of these elusive modifications to traditional beaconing behavior.
Our approach
We’ve discussed a bit about the why and what — in this section we dig deeper into how we identify beaconing traffic. Before we begin, it is important to note that beaconing is merely a communication characteristic. It is neither good nor evil by definition. While it is true that malware heavily relies on beaconing nowadays, a lot of legitimate software also exhibits beaconing behaviour.
While we have made efforts to reduce false positives, this framework should be looked at as a means for beaconing identification to help reduce the search space for a threat hunt, not as a means for detection. That said, indicators produced by this framework, when combined with other IoCs, can potentially be used to detect on malicious activity.
The beacons we are interested in comprise traffic from a single running process on a particular host machine to one or more external IPs. Given that the malware can have both short (order of seconds) and long (order of hours or days) check-in intervals, we will restrict our attention to a time window that works reasonably for both and attempt to answer the question: “What is beaconing in my environment right now or recently?” We have also parameterized the inputs to the framework to allow users to configure important settings like time window, etc. More on this in upcoming sections.
When dealing with large data sets, such as network data for an enterprise, you need to think carefully about what you can measure, which allows you to scale effectively. Scaling has several facets, but for our purposes, we have the following requirements:
- Work can be parallelised over different shards of data stored on different machines
- The amount of data that needs to move around to compute what is needed must be kept manageable.
Multiple approaches have been suggested for detecting beaconing characteristics, but not all of them satisfy these constraints. For example, a popular choice for detecting beacon timing characteristics is to measure the interval between events. This proves to be too inefficient to use on large datasets because the events can't be processed across multiple shards.
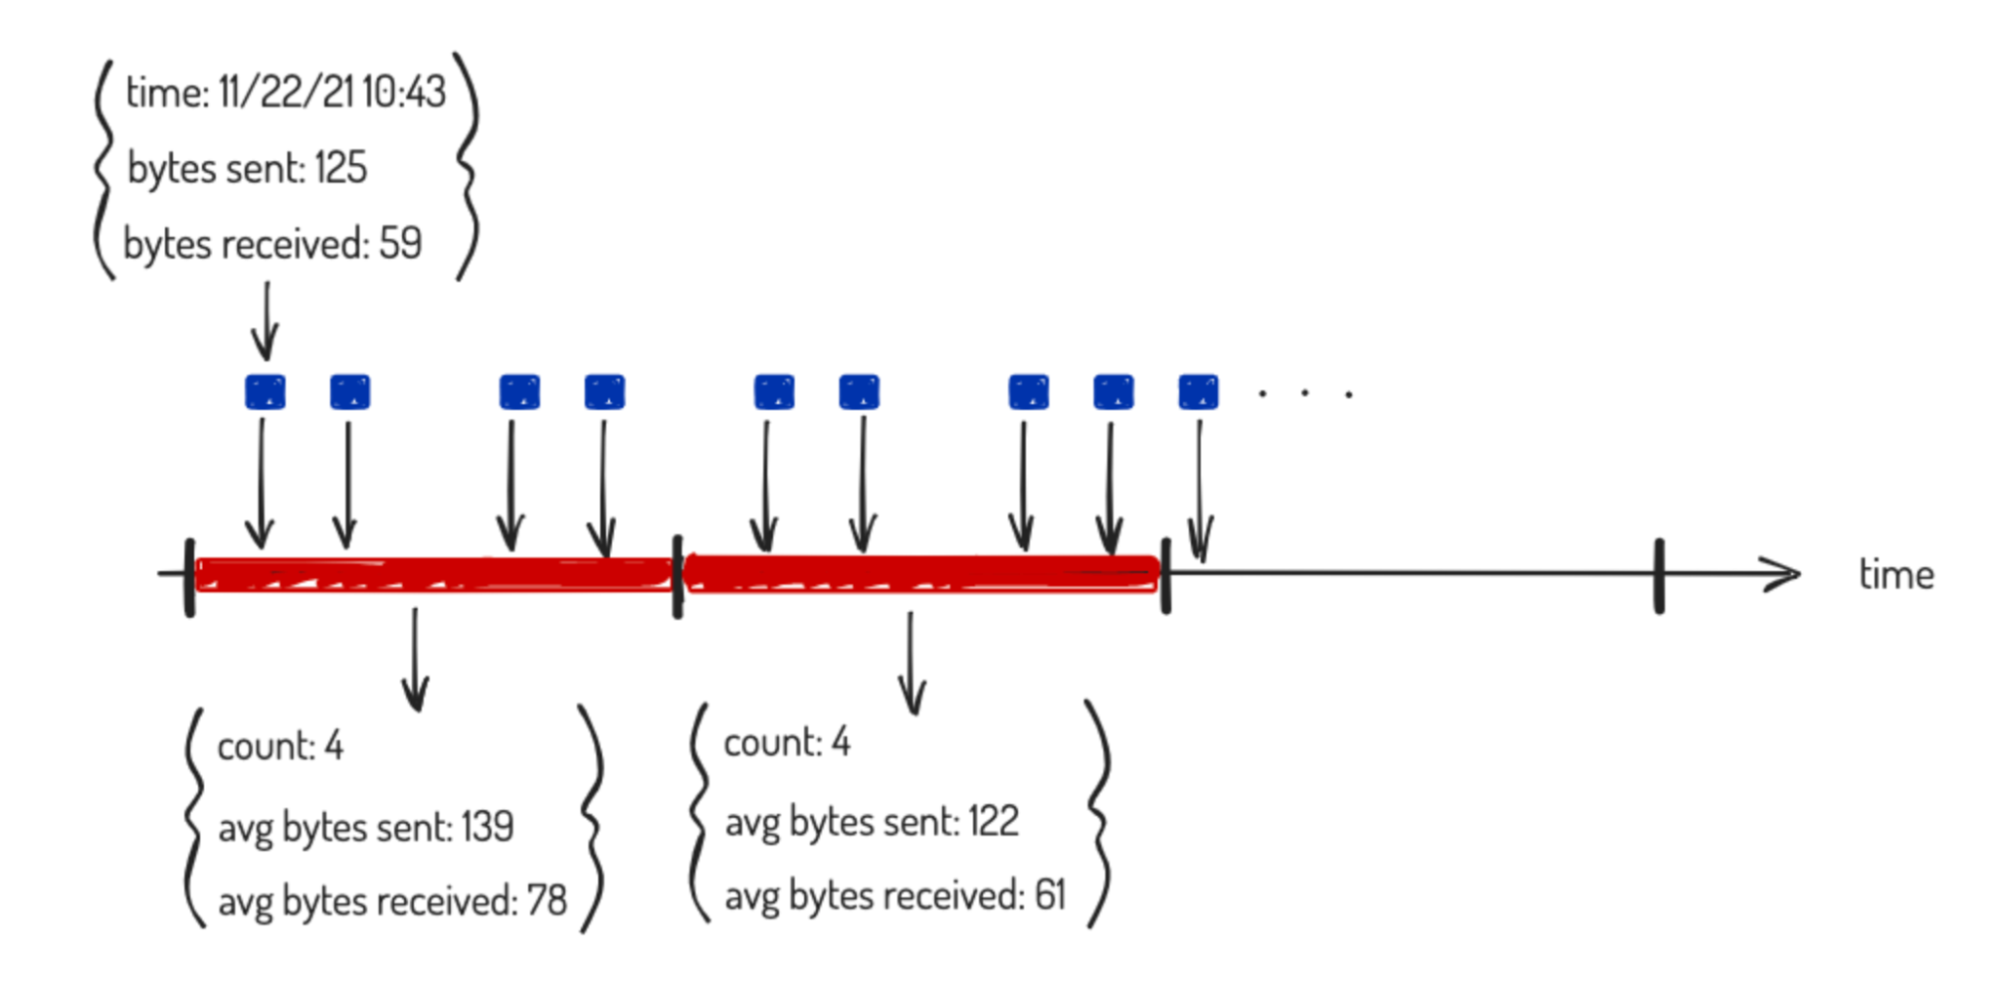
Driven by the need to scale, we chose to detect beaconing by bucketing the data in the time window to be analyzed. We gather the event count and average bytes sent and received in each bucket. These statistics can be computed in MapReduce fashion and values from different shards can be combined at the coordinating node of an Elasticsearch query.
Furthermore, by controlling the ratio between the bucket and window lengths, the data we pass per running process has predictable memory consumption, which is important for system stability. The whole process is illustrated diagrammatically below:
A key attribute of beaconing traffic is it often has similar netflow bytes for the majority of its communication. If we average the bytes over all the events that fall in a single bucket, the average for different buckets will in fact be even more similar. This is just the law of large numbers in action. A good way to measure similarity of several positive numbers (in our case these are average bucket netflow bytes) is using a statistic called the coefficient of variation (COV). This captures the average relative difference between the values and their mean. Because this is a relative value, a COV closer to 0 implies that values are tightly clustered around their mean.
We also found that occasional spikes in the netflow bytes in some beacons were inflating the COV statistic. In order to rectify this, we simply discarded low and high percentile values when computing the COV, which is a standard technique for creating a robust statistic. We threshold the value of this statistic to be significantly less than one to detect this characteristic of beacons.
For periodicity, we observed that signals displayed one of two characteristics when we viewed the bucket counts. If the period was less than the time bucket length (i.e. high frequency beacons), then the count showed little variation from bucket to bucket. If the period was longer than the time bucket length (i.e. low frequency beacons), then the signal had high autocorrelation. Let's discuss these in detail.
To test for high frequency beacons, we use a statistic called relative variance (RV). The rate of many naturally occurring phenomena are well described by a Poisson distribution. The reason for this is that if events arrive randomly at a constant average rate and the occurrence of one event doesn’t affect the chance of others occurring, then their count in a fixed time interval must be Poisson distributed.
Just to underline this point, it doesn’t matter the underlying mechanisms for that random delay between events (making a coffee, waiting for your software to build, etc.)— if those properties hold, their rate distribution is always the same. Therefore, we expect that the bucket counts to be Poisson distributed for much of the traffic in our network, but not for beacons, which are much more regular. A feature of the Poisson distribution is that its variance is equal to its average, i.e. its RV is 1. Loosely, this means that if the RV of our bucket counts is closer to 0, the signal is more regular than a Poisson process.
Autocorrelation is a useful statistic for understanding when a time series repeats itself. The basic idea behind autocorrelation is to compare the time series values to themselves after shifting them in time. Specifically, it is the covariance between the two sets of values (which is larger when they are more similar), normalized by dividing it by the square root of the variances of the two sets, which measures how much the values vary among themselves.
This process is illustrated schematically below. We apply this to the time series comprising the bucket counts: if the signal is periodic then the time bucketed counts must also repeat themselves. The nice thing about autocorrelation from our perspective is that it is capable of detecting any periodic pattern. For example, the events don’t need to be regularly spaced but might repeat like two events occurring close to one another in time, followed by a long gap and so on.
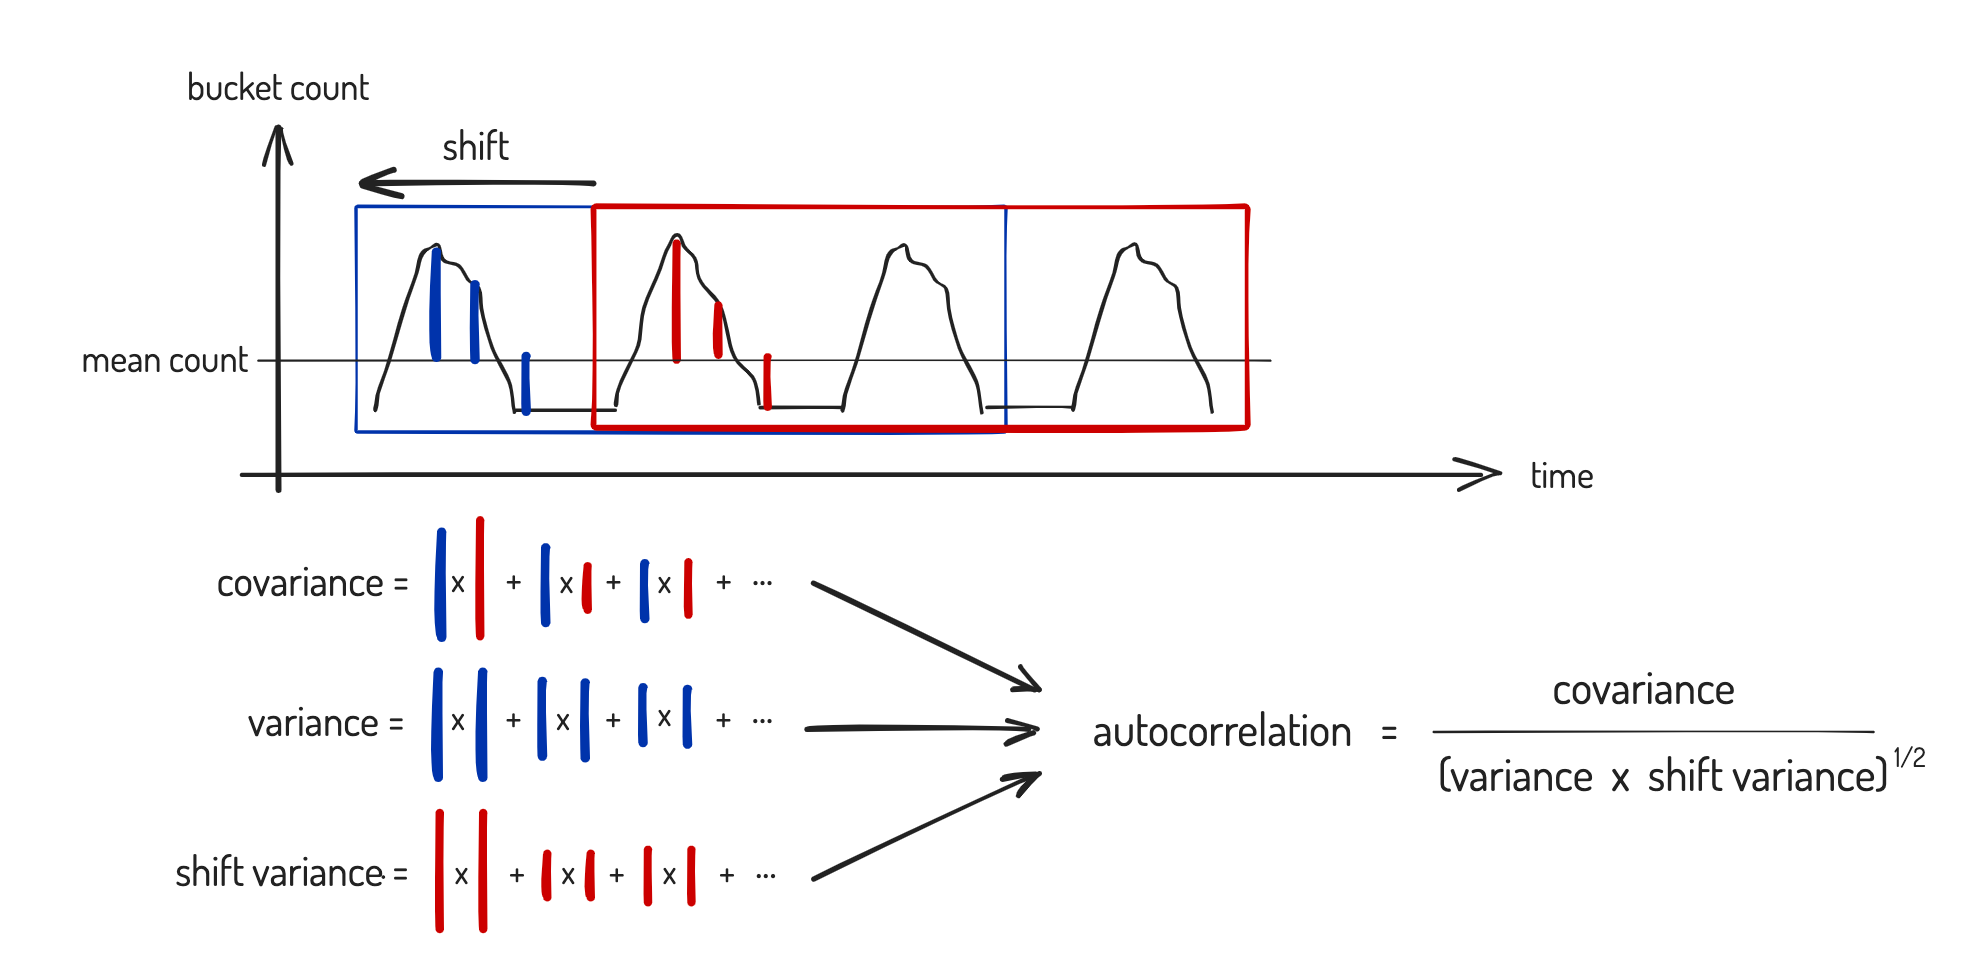
We don’t know the shift beforehand that will maximize the similarity between the two sets of values, so we search over all shifts for the maximum. This, in effect, is the period of the data — the closer its autocorrelation is to one, the closer the time series is to being truly periodic. We threshold the autocorrelation close to one to test for low frequency beacons.
Finally, we noted that most beaconing malware these days incorporates jitter. How does autocorrelation deal with this? Well first off, autocorrelation isn’t a binary measure — it is a sliding scale: the closer the value is to 1 the more similar the two sets of values are to one another. Even if they are not identical but similar it can still be close to one. In fact, we can do better than this by modelling how random jitter affects autocorrelation and undoing its effect. Provided the jitter isn’t too large, the process to do this turns out to be about as complex as just finding the maximum autocorrelation.
In our implementation, we’ve made the percentage configurable, although one would always use a small-ish percentage to avoid flagging too much traffic as periodic. If you'd like to dig into the gory details of our implementation, all the artifacts are available as a GitHub release in our detection rules repository.
How do we do this using Elasticsearch?
Elasticsearch has some very powerful tools for ad hoc data analysis. The scripted metric aggregation is one of them. The nice thing about this aggregation is that it allows you to write custom Painless scripts to derive different metrics about your data. We used the aggregation to script out the beaconing tests.
In a typical environment, the cardinality of the distinct processes running across endpoints is rather high. Trying to run an aggregation that partitions by every running process is therefore not feasible. This is where another feature of the Elastic Stack comes in handy. A transform is a complex aggregation which paginates through all your data and writes results to a destination index.
There are various basic operations available in transforms, one of them being partitioning data at scale. In our case, we partitioned our network event logs by host and process name and ran our scripted metric aggregation against each host-process name pair. The transform also writes out various beaconing related indicators and statistics. A sample document from the resulting destination index is as follows:
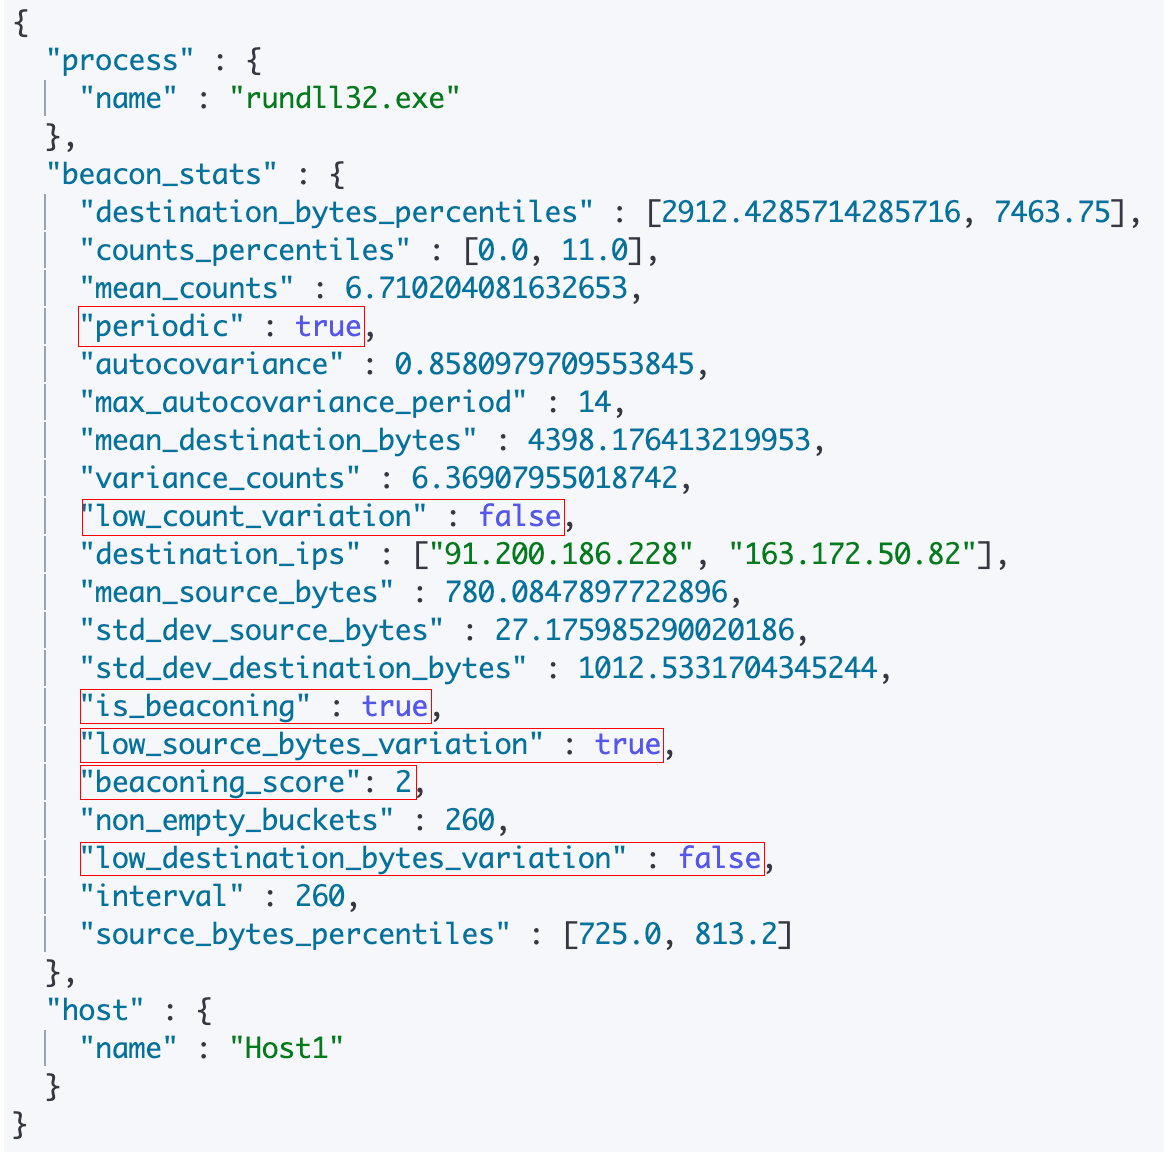
As you can see, the document contains valuable beaconing-related information about the process. First off, the beacon_stats.is_beaconing indicator says whether or not we found the process to be beaconing. If it is, as in the case above, the document will also contain important metadata, such as the frequency of the beacon. The indicator beacon_stats.periodic says whether or not the signal is a low-frequency beacon, while the indicator beacon_stats.low_count_variation indicates whether or not it is a high-frequency beacon.
Furthermore, the indicators beacon_stats.low_source_bytes_variation and low_destination_bytes_variation indicate whether or not the source and destination bytes sent during the beaconing communication were more or less uniform. Finally, you will also notice the beaconing_score indicator, which is a value from 1-3, representing the number of beaconing tests satisfied by the process for that time period.
Writing such metadata out to an index also means that you can search for different facets of beaconing software in your environment. For example, if you want to search for low frequency beaconing processes in your environment, you would query for documents where the beacon_stats.periodic indicator is true and beacon_stats.low_count_variation is false. You can also build second order analytics on top of the indexed data, such as using anomaly detection to find rare beaconing processes, or using a significant terms aggregation to detect lateral movement of beaconing malware in your environment.
Finally, we’ve included several dashboards for your threat hunters and analysts to use for monitoring beaconing activity in your environment. These can be found in the release package as well.
Tuning parameters and filtering
Advanced users can also tune important parameters to the scripted metric aggregation in the transforms, like jitter percentage, time window, etc. If you'd like to change the default parameters, all you would need to do is delete the transform, change the parameters, and restart it. The parameters you can tune are as follows:
number_buckets_in_range: The number of time buckets we split the time window into. You need enough to ensure you get reasonable estimates for the various statistics, but too many means the transform will use more memory and compute.time_bucket_length: The length of each time bucket. This controls the time window, so the larger this value the longer the time window. You might set this longer if you want to check for very low frequency beacons.number_destination_ips: The number of destination IPs to gather in the results. Setting this higher increases the transform resource usage.max_beaconing_bytes_cov: The maximum coefficient of variation in the payload bytes for the low source and destination bytes variance test. Setting this higher will increase the chance of detecting traffic as beaconing, so would likely increase recall for malicious C2 beacons. However, it will also reduce the precision of the test.max_beaconing_count_rv: The maximum relative variance in the bucket counts for the high frequency beacon test. As withmax_beaconing_bytes_cov, we suggest tuning this parameter based on the kind of tradeoff you want between precision and recall.truncate_at: The lower and upper fraction of bucket values discarded when computingmax_beaconing_bytes_covandmax_beaconing_count_rv. This allows you to ignore occasional changes in traffic patterns. However, if you retain too small a fraction of the data, these tests will be unreliable.min_beaconing_count_autocovariance: The minimum autocorrelation of the signal for the low frequency beacon test. Lowering this value will likely result in an increase in recall for malicious C2 beacons, at the cost of reduced test precision. As with some of the other parameters mentioned above, we suggest tuning this parameter based on the kind of tradeoff you want between precision and recall.max_jitter: The maximum amount by which we assume that a periodic beacon is jittered, as a fraction of its period.
You can also make changes to the transform query. We currently look for beaconing activity over a 6h time range, but you can change this to a different time range. As mentioned previously, beaconing is not a characteristic specific to malware and a lot of legitimate, benign processes also exhibit beaconing-like activity.
In order to curb the false positive rate, we have included a starter list of filters in the transform query to exclude known benign beaconing processes that we observed during testing, and a list of IPs that fall into two categories:
- The source IP is local and the destination is remote
- For certain Microsoft processes, the destination IP is in a Microsoft block
You can add to this list based on what you see in your environment.
Evaluation
In order to measure the effectiveness of our framework as a reduced search space for beaconing activity, we wanted to test two aspects:
- Does the framework flag actual malicious beaconing activity?
- By how much does the framework reduce the search space for malicious beacons?
In order to test the performance on malware beacons, we ran the transform on some synthetic data as well as some real malware! We set up test ranges for Emotet and Koadic, and also tested it on NOBELIUM logs we had from several months ago. The results from the real malware tests are worth mentioning here.
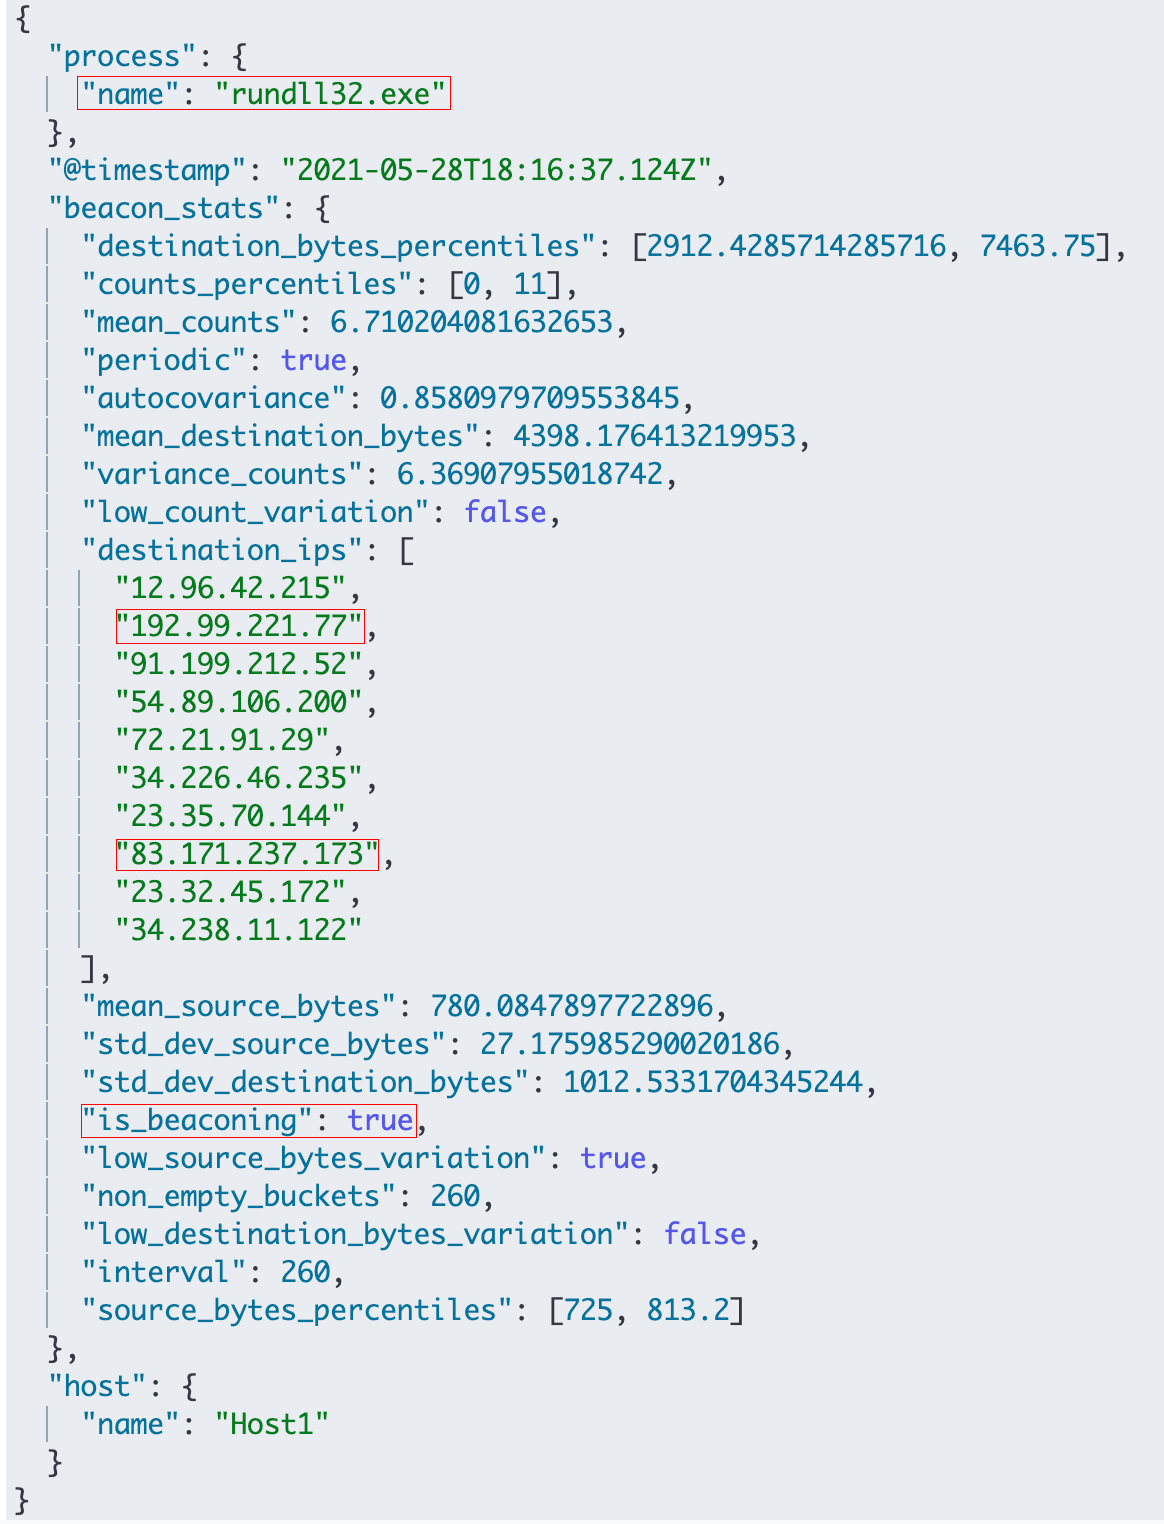
For NOBELIUM, the beaconing transform catches the offending process, rundll32.exe, as well as the two destination IPs, 192.99.221.77 and 83.171.237.173, which were among the main IoCs for NOBELIUM.
For Koadic and Emotet as well, the transform was able to flag the process as well as the known destination IPs on which the test C2 listeners were running. The characteristics of each of the beacons were different. For example, Koadic was a straightforward, high-frequency beacon that satisfied all the beaconing criteria being checked in the transform i.e. periodicity, as well as low variation of source and destination bytes. Emotet was slightly trickier since it was a low frequency beacon with a high jitter percentage. But we were able to detect it due to the low variation in the source bytes of the beacon.
To test the amount of reduction in search space, we ran the transform over three weeks on an internal cluster that was receiving network event logs from ~ 2k hosts during the testing period. We measured the reduction in search space based on the number of network event log messages, processes, and hosts an analyst or threat hunter would have to sift through before and after running the transform, in order to identify malicious beacons. The numbers are as follows:

While the reduction in search space is obvious, another point to note is the scale of data that the transforms are able to churn through comfortably, which becomes an important aspect to consider, especially in production environments. Additionally, we have also released dashboards (available in the release package), which track metrics like prevalence of the beaconing processes, etc. that can help make informed decisions about further filtering of the search space.
While the released dashboards, and the statistics in the above table are based on cases where the beacon_stats.is_beaconing indicator is true i.e. beacons that satisfy either of the beaconing tests, threat hunters may want to further streamline their search by starting with the most obvious beaconing-like cases and then moving on to the less obvious ones. This can be done by filtering and searching by the beacon_stats.beaconing_score indicator instead of beacon_stats.is_beaconing, where a score of 3 indicates a typical beacon (satisfying tests for periodicity as well as low variation in packet bytes), and score of 1 indicates a less obvious beacon (satisfying only one of the three tests).
For reference, we observed the following on our internal cluster:

What's next
We’d love for you to try out our beaconing identification framework and give us feedback as we work on improving it. If you run into any issues during the process, please reach out to us on our community Slack channel, discussion forums, or even our open detections repository. Stay tuned for Part 2 of this blog, where we’ll cover going from identifying beaconing activity to actually detecting on malicious beacons!
Try out our beaconing identification framework with a free 14-day trial of Elastic Cloud.
