New in Elasticsearch 7.13: Even faster aggregations
In our last episode, I wrote about some speed improvements to date_histogram and I was beside myself with excitement to see if I could apply the same principles to other aggregations. I've spent most of the past few months playing a small part developing runtime fields but eventually I found time to take a look at the terms aggregation.
It's time for terms!
With the date_histogram aggregation we got a huge performance boost by rewriting it as a filters aggregation internally. Rewriting terms as filters has more mixed results. I often saw a wonderful speed up (454ms -> 131ms). Check the linked PR for more about "often". But now that we've rewritten the agg as filters, we can do much better!
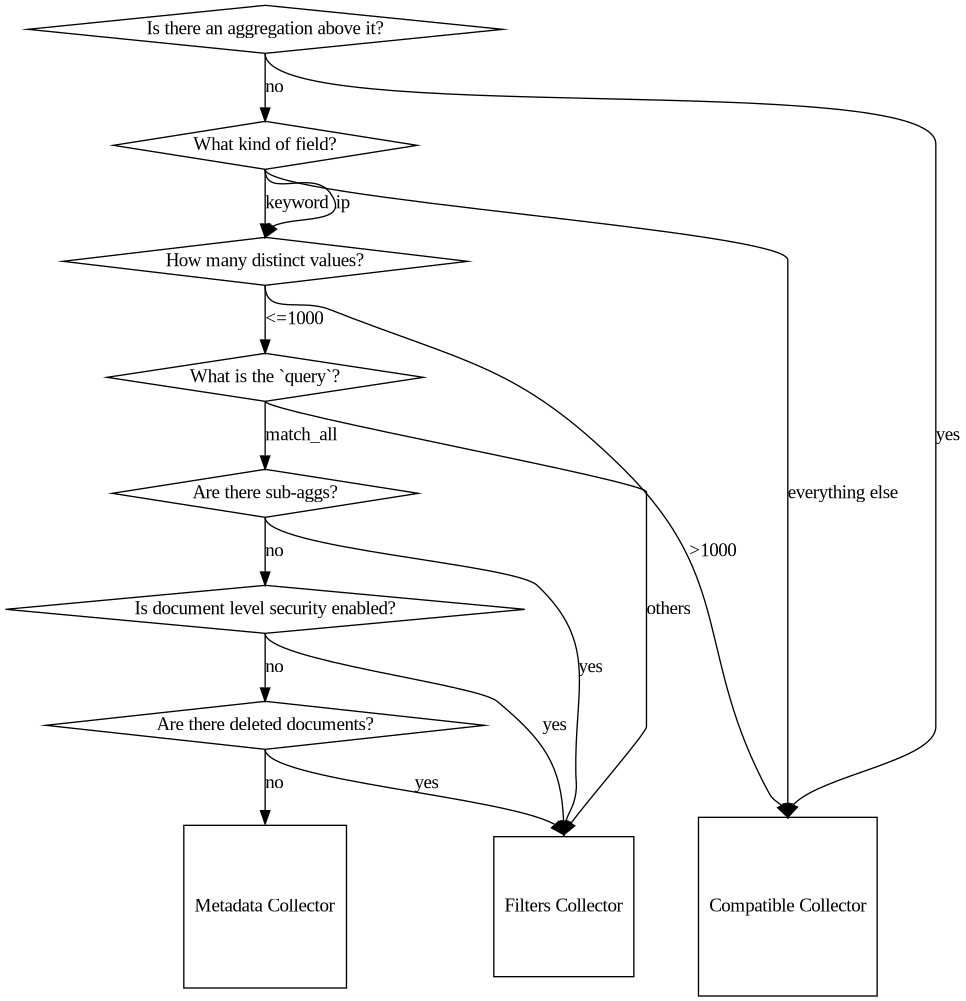
We landed another optimization that I'm really excited about. It's such a great shortcut it feels unfair to the original code. It's good code! It works hard! But the new code doesn't collect hits at all. It just reads the count from the index metadata. It's sort of searching without searching. See, we have to store a count of documents that contain each term so we can send it to similarities to compute scores. And, if about seven preconditions hold true (see image to the right), the count is exactly the answer the original code would give. So we just read that count instead of performing a search. The 130ms request drops to 37ms. It's reasonably common for requests to be able to use this optimization. Especially for shards that have been around a while. This is doubly important because those shards often end up on spinning disks or even as searchable snapshots, both of which have slower IO then a "hot" shard on a fancy SSD.

That 3.5x speed up isn't really the whole story on it either. Most of the other improvements I've made make *collection* faster. So aggregations still run in times related to the number of documents on the shard. Depending on your query you'll see some O(docs_in_index) and some O(log docs_in_index) and some O(matching_docs). But this optimization is O(1). Said another way, no matter how many docs you put in the index this will return in the same amount of time. Almost. We do have to sum that statistics for each segment and if you have more documents in the index you'll have more segments. The number of segments grows roughly logarithmic to the number of docs. But the constant factors associated with reading the metadata are so low that I expect you won't notice. So, practically speaking, the runtime isn't related to the number of docs.
We got that 130ms to 37ms change on a 5.9GB index of 33 million climate measurements. If all is right with the world you'll see much larger improvements on your larger data sets. Why climate data, you may ask? Because I like it and I'm the one running the performance tests.
But wait, there's more
In our last episode we talked about rewriting a date_histogram into a filters. Specifically, it turned into a filters aggregation containing range queries. And that is what we optimized. range queries. But Elasticsearch is tricky. Sometimes when you ask it to build a range query it'll build an exists query instead. It'll do that if all of the values for the field are within the range. And we can use an optimization similar to the terms query for the exists query. This didn't make it for 7.13, but it's on the 7.14 release train. 🚂
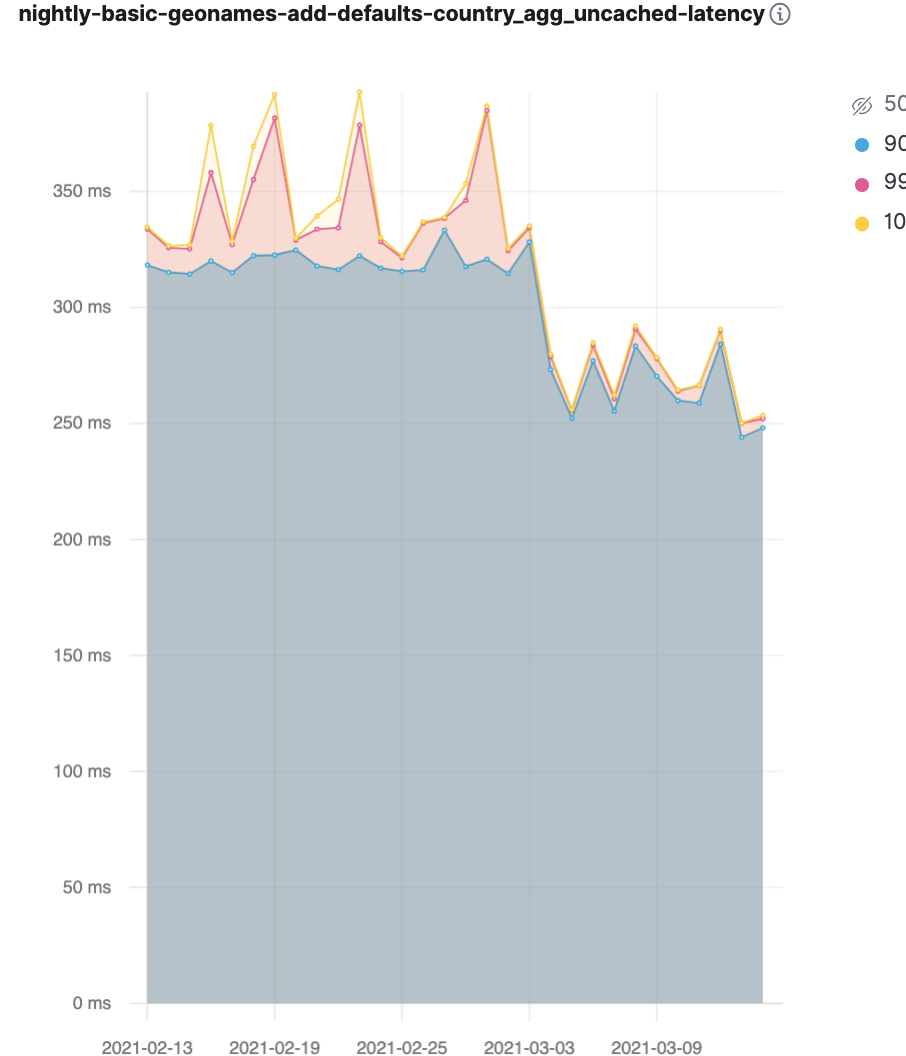
7.13 does apply some of these optimizations when the date_histogram or terms has sub-aggregations like a max or avg or even another terms aggregation. We can't use any of the truly unfair optimizations against metadata so you won't see any 8ms aggregations or anything. But with this change lots of the optimizations we've done in the past few releases can apply in more places. Our benchmarks caught one such improvement. That's the graph below, dropping from 320ms to 270ms or so.

That 50ms drop in the benchmark amounts to a 15% performance improvement for the agg. That 15% is likely pretty indicative of what you'll see from us being able to use these optimized top level collection mechanisms with sub-aggregations. The sub-aggregations themselves take the same amount of time, sort of "diluting" the performance gain we get from making the top level aggregation much faster.
Have you tried filters?
So far I've only talked about the performance of terms and date_histogram. Specifically about how we made them faster by running them as filters and then by making filters faster. filters used to be one of our slowest aggregations. And when it can't take the fast path it still is. We just don't take that path when running terms or date_histogram as filters. Easy!
But what if you *need* the filters agg for some reason? The "fast path" for filters is about 20 times faster than the slow one. For now you can get the fast path if filters is the top most aggregation and you don't use the other bucket. Before the sub-agg change I mentioned above you'd *also* have to make sure there aren't aggregations under the filters agg.
Plans within plans
Right now none of these fancy optimizations work when the terms or date_histogram is not the top most aggregation in the search. That feels like the next logical step from here. Then we'd be able to optimize a terms inside of a date_histogram. Or a terms inside of a terms. Exciting!