Monitoring service performance: An overview of SLA calculation for Elastic Observability

Elastic Stack provides many valuable insights for different users. Developers are interested in low-level metrics and debugging information. SREs are interested in seeing everything at once and identifying where the root cause is. Managers want reports that tell them how good service performance is and if the service level agreement (SLA) is met. In this post, we’ll focus on the service perspective and provide an overview of calculating an SLA.
Since version 8.8, we have a built in functionality to calculate SLOs — check out our guide!
Foundations of calculating an SLA
There are many ways to calculate and measure an SLA. The most important part is the definition of the SLA, and as a consultant, I’ve seen many different ways. Some examples include:
- Count of HTTP 2xx must be above 98% of all HTTP status
- Response time of successful HTTP 2xx requests must be below x milliseconds
- Synthetic monitor must be up at least 99%
- 95% of all batch transactions from the billing service need to complete within 4 seconds
Depending on the origin of the data, calculating the SLA can be easier or more difficult. For uptime (Synthetic Monitoring), we automatically provide SLA values and offer out-of-the-box alerts to simply define alert when availability below 98% for the last 1 hour.
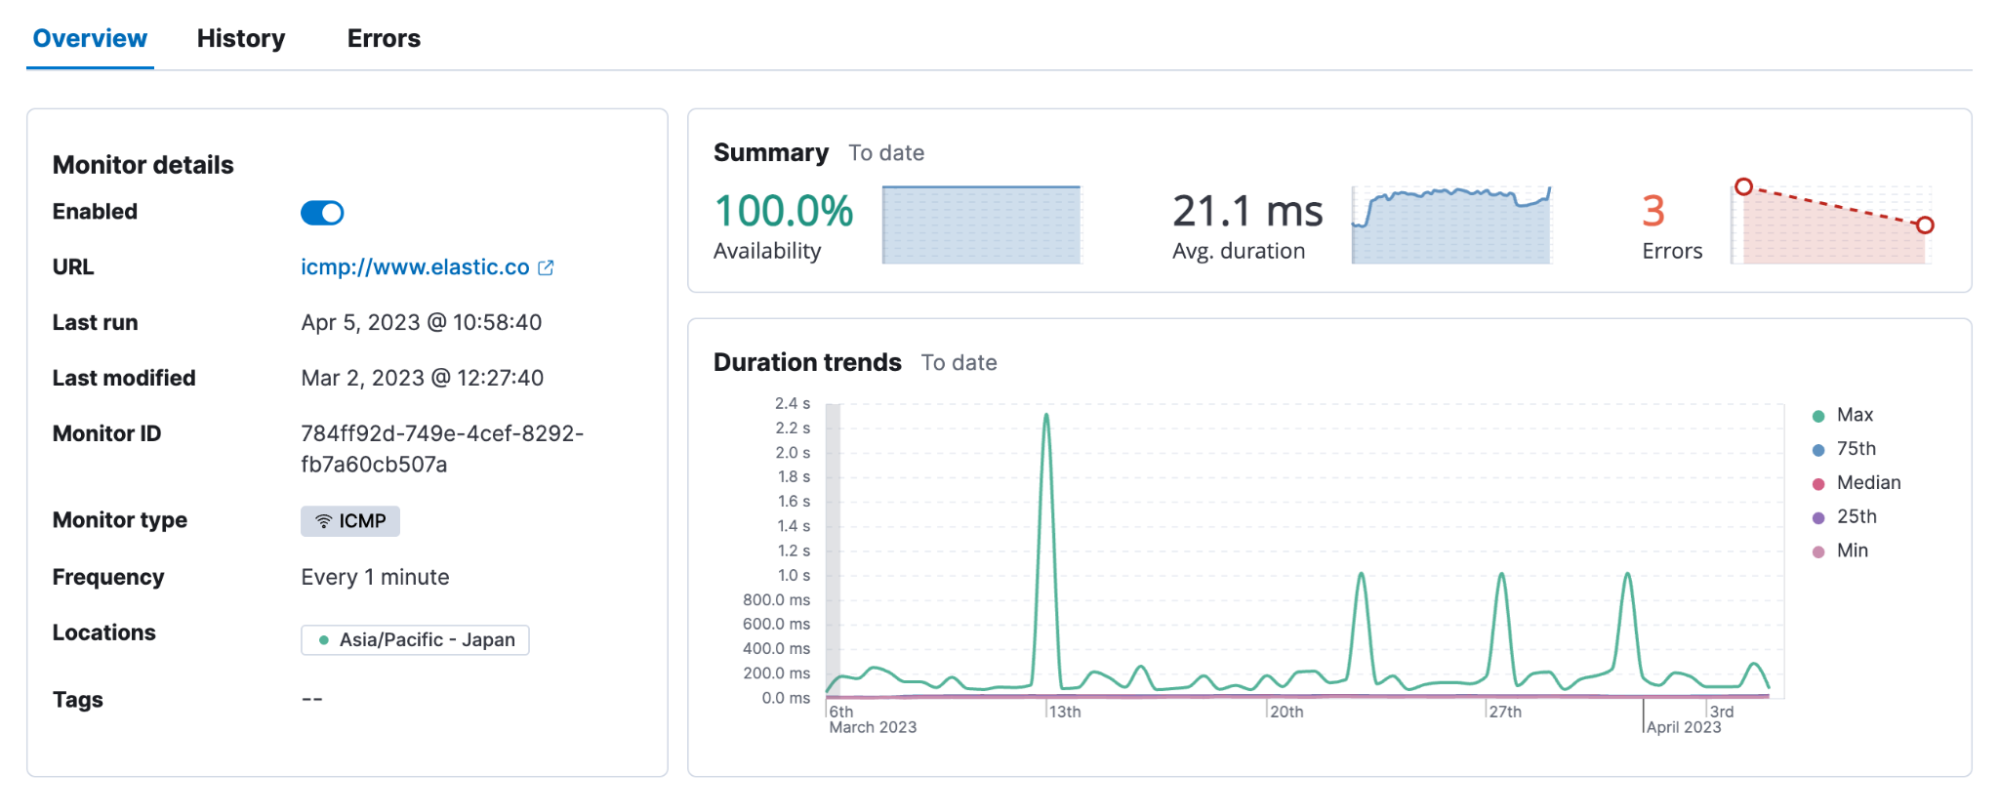
I personally recommend using Elastic Synthetic Monitoring whenever possible to monitor service performance. Running HTTP requests and verifying the answers from the service, or doing fully fledged browser monitors and clicking through the website as a real user does, ensures a better understanding of the health of your service.
Sometimes this is impossible because you want to calculate the uptime of a specific Windows Service that does not offer any TCP port or HTTP interaction. Here the caveat applies that just because the service is running, it does not necessarily imply that the service is working fine.
Transforms to the rescue
We have identified our important service. In our case, it is the Steam Client Helper. There are two ways to solve this.
Lens formula
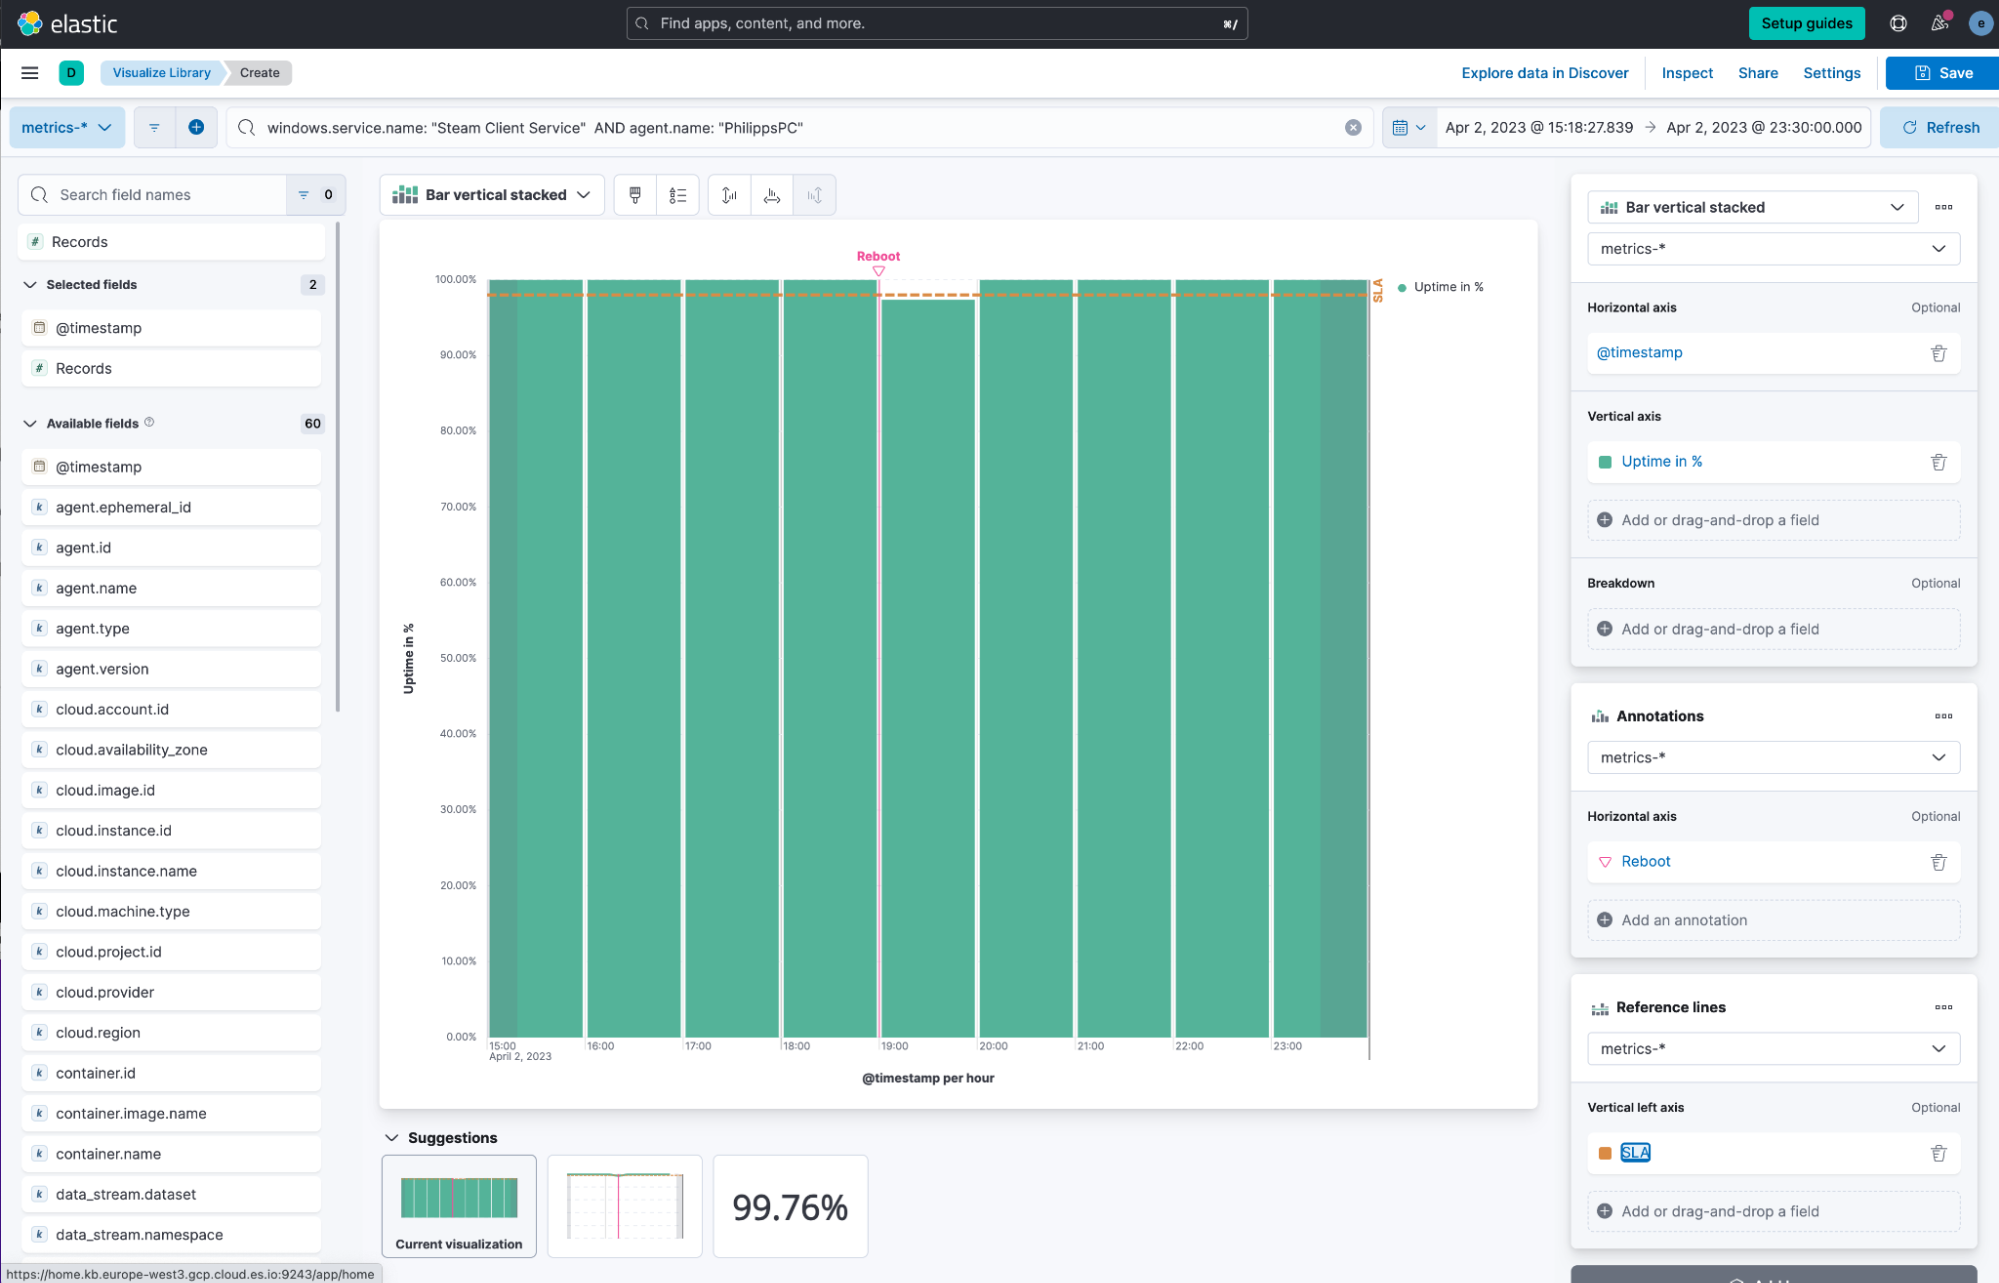
You can use Lens and formula (for a deep dive into formulas, check out this blog). Use the Search bar to filter down the data you want. Then use the formula option in Lens. We are dividing all counts of records with Running as a state and dividing it by the overall count of records. This is a nice solution when there is a need to calculate quickly and on the fly.
count(kql='windows.service.state: "Running" ')/count()Using the formula posted above as the bar chart's vertical axis calculates the uptime percentage. We use an annotation to mark why there is a dip and why this service was below the threshold. The annotation is set to reboot, which indicates a reboot happening, and thus, the service was down for a moment. Lastly, we add a reference line and set this to our defined threshold at 98%. This ensures that a quick look at the visualization allows our eyes to gauge if we are above or below the threshold.
Transform
What if I am not interested in just one service, but there are multiple services needed for your SLA? That is where Transforms can solve this problem. Furthermore, the second issue is that this data is only available inside the Lens. Therefore, we cannot create any alerts on this.
Go to Transforms and create a pivot transform.
1. Add the following filter to narrow it to only services data sets: data_stream.dataset: "windows.service". If you are interested in a specific service, you can always add it to the search bar if you want to know if a specific remote management service is up in your entire fleet!
2. Select data histogram(@timestamp) and set it to your chosen unit. By default, the Elastic Agent only collects service states every 60 seconds. I am going with 1 hour.
3. Select agent.name and windows.service.name as well.
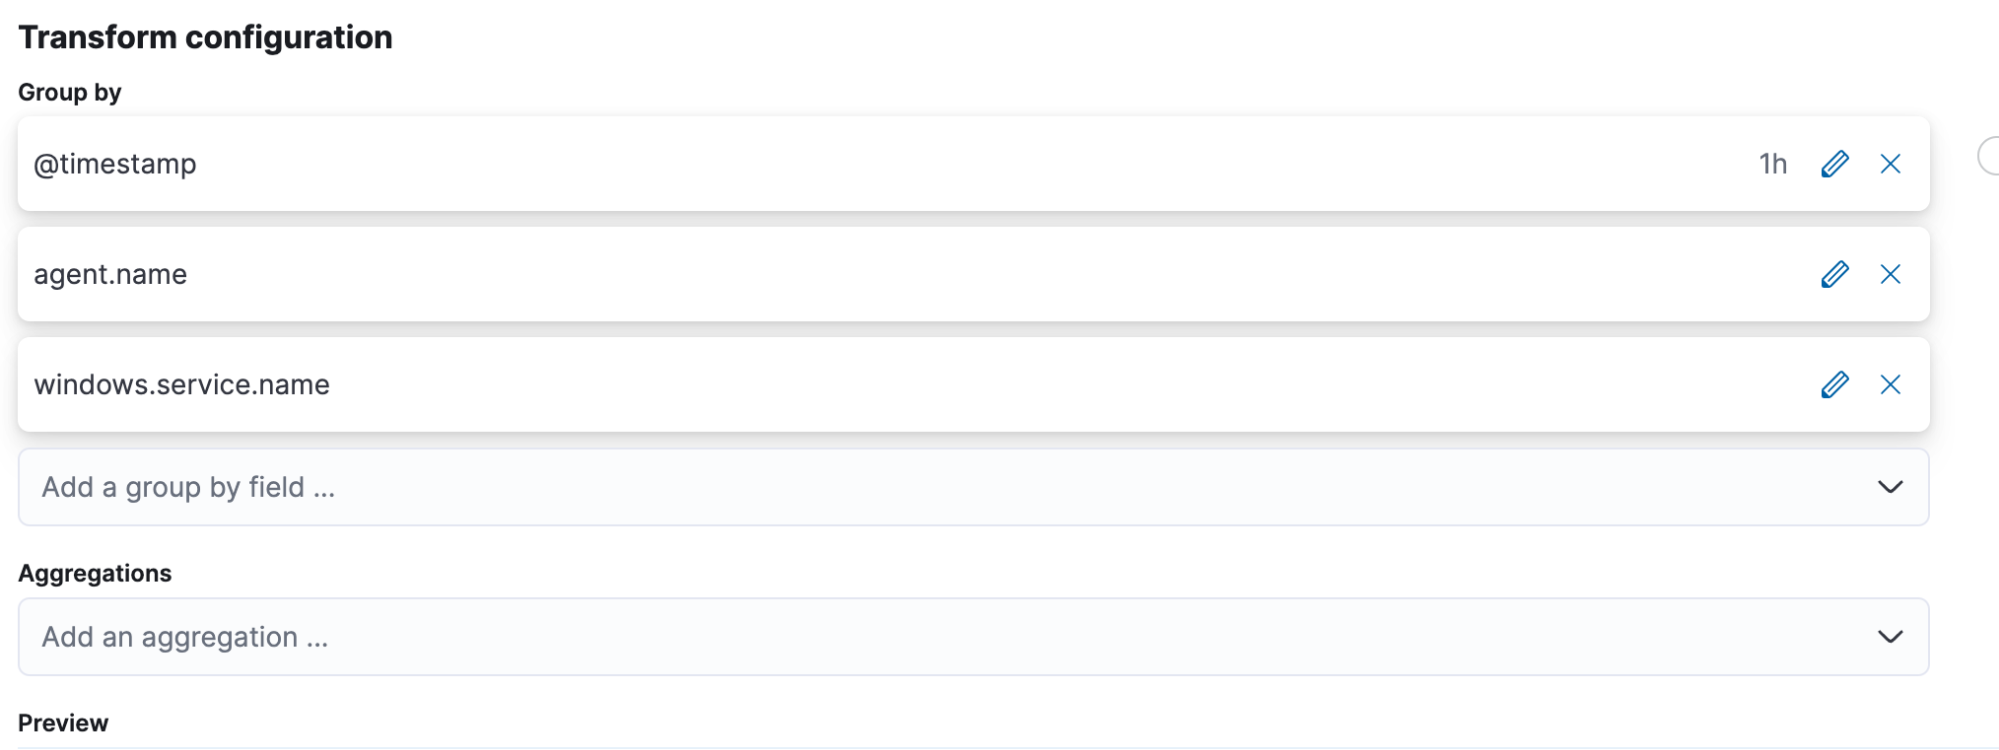
4. Now we need to define an aggregation type. We will use a value_count of windows.service.state. That just counts how many records have this value.
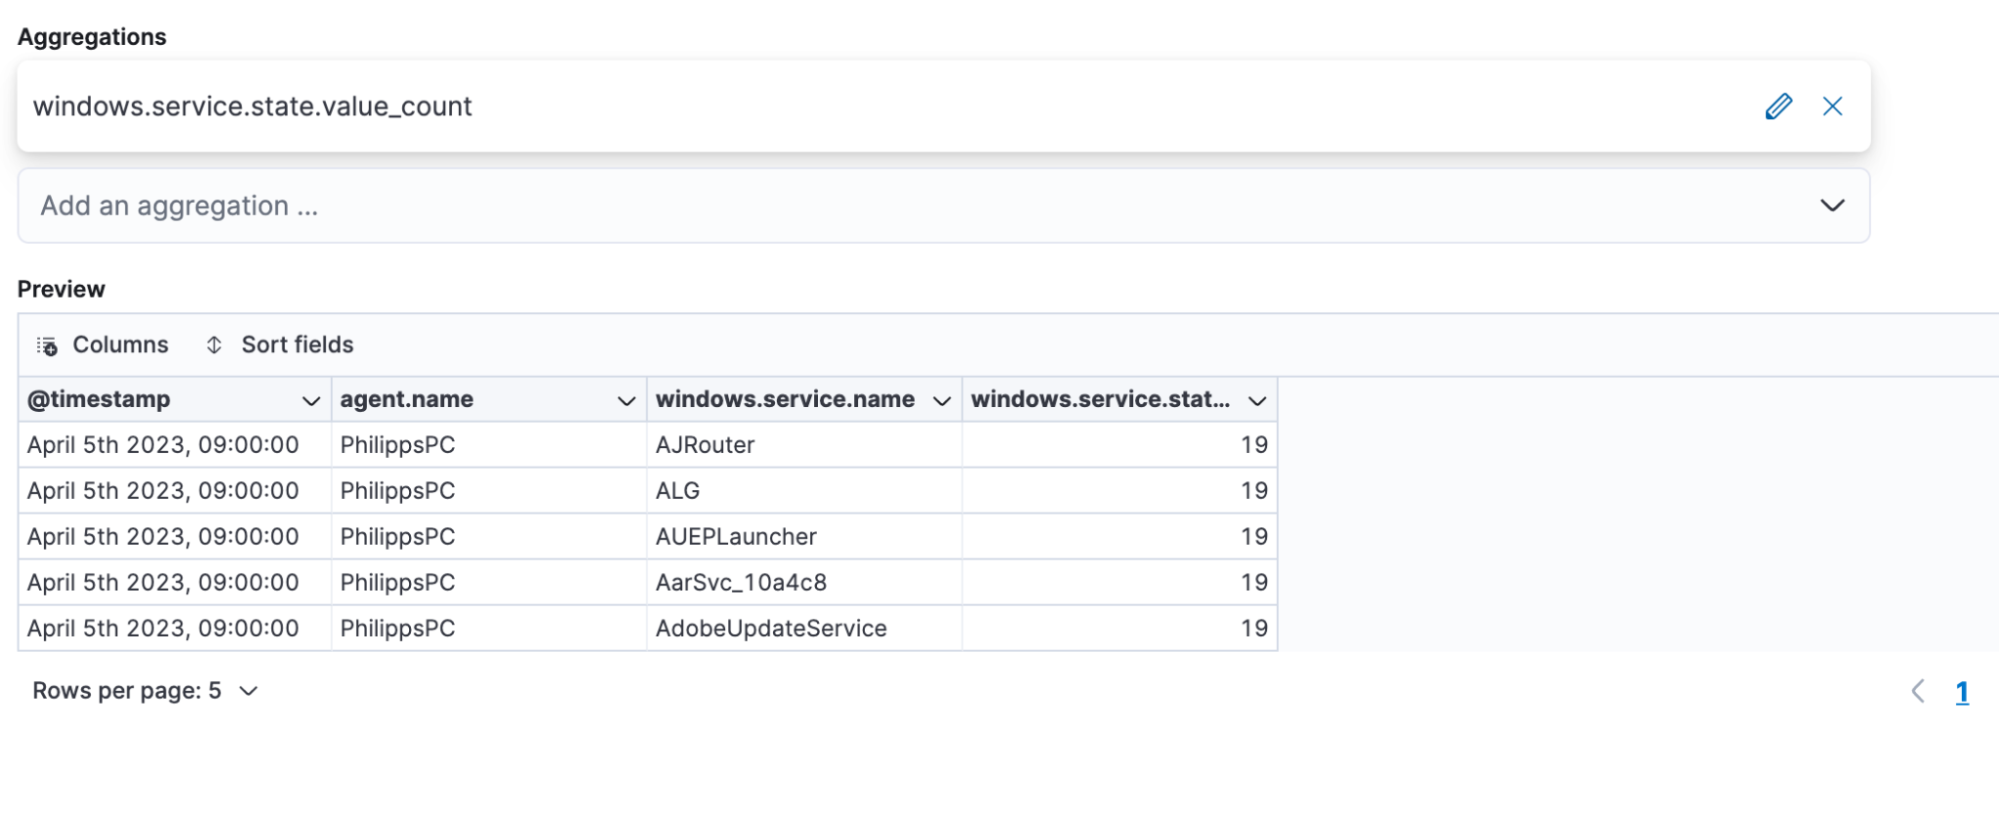
5. Rename the value_count to total_count.
6. Add value_count for windows.service.state a second time and use the pencil icon to edit it to terms, which aggregates for running.
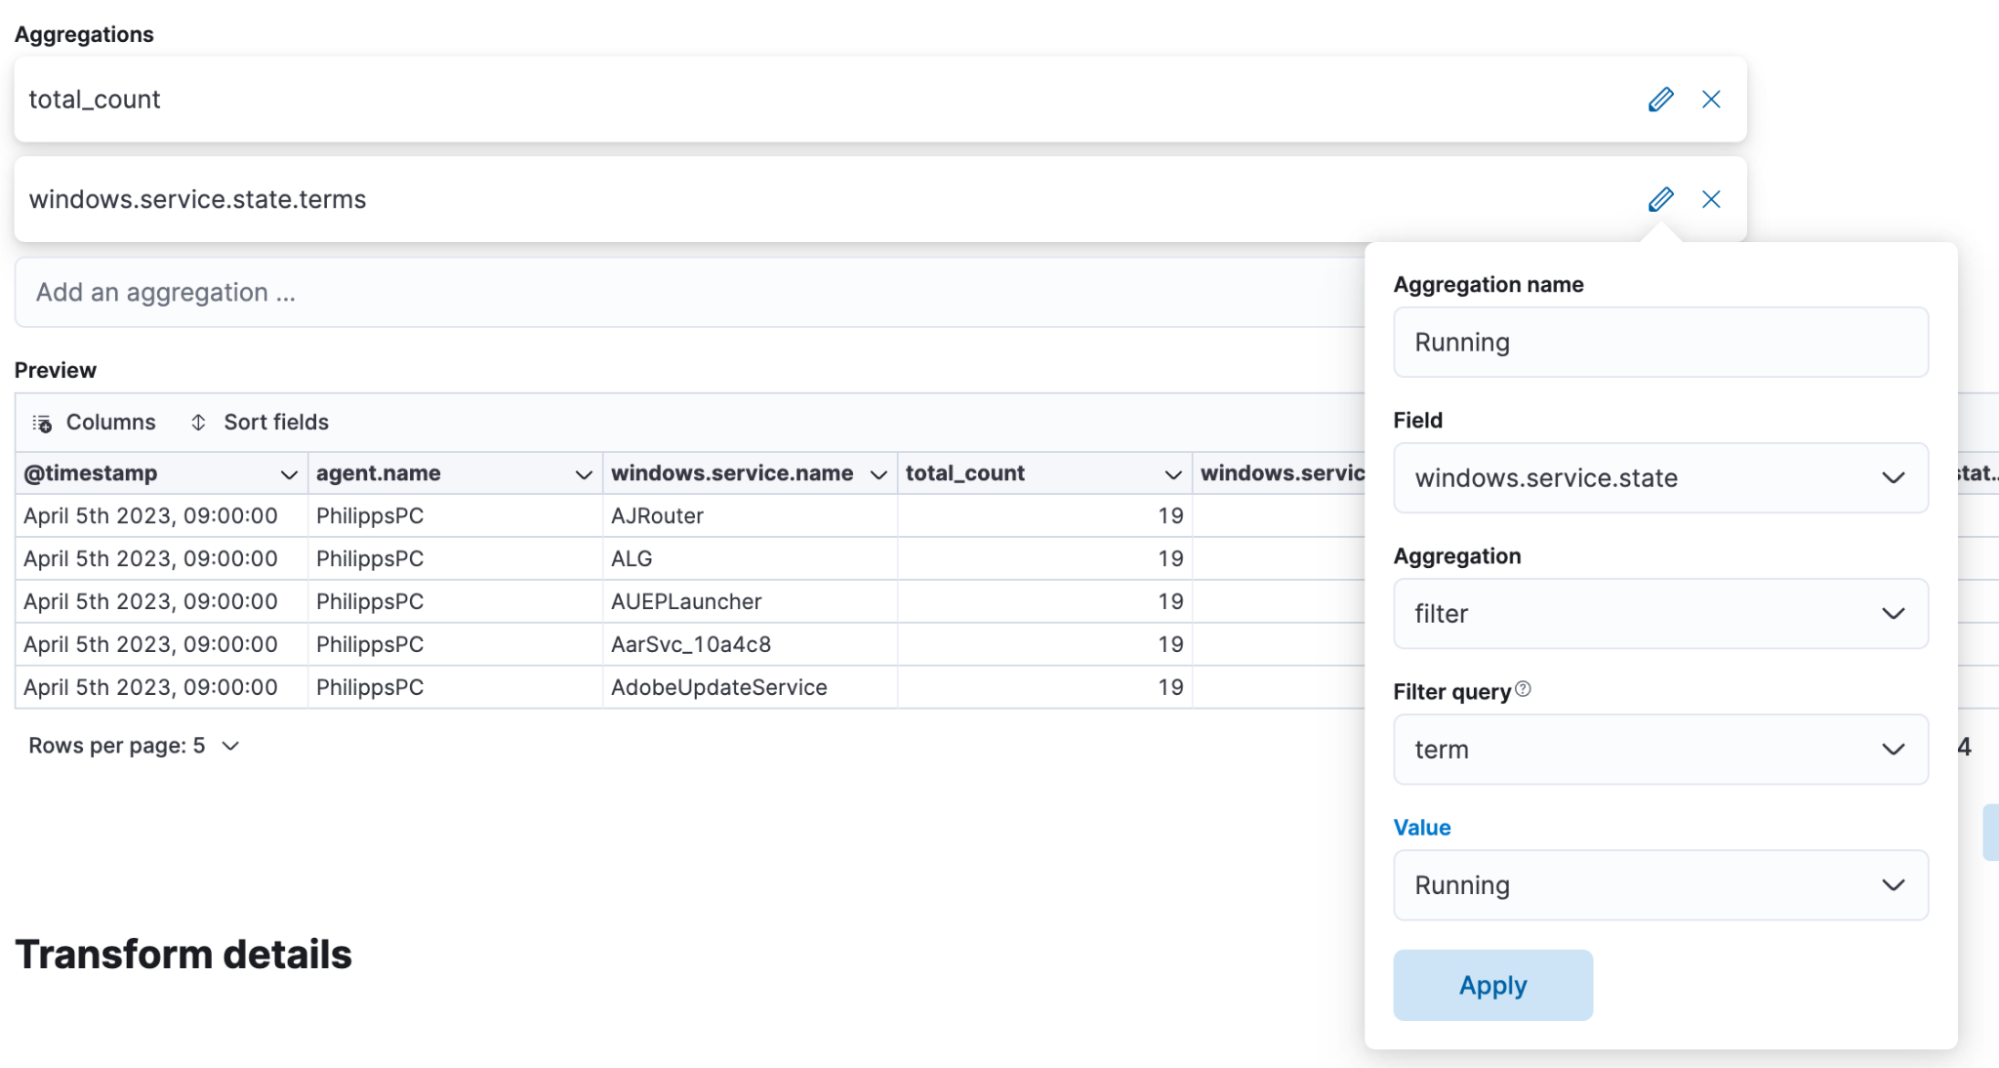
7. This opens up a sub-aggregation. Once again, select value_count(windows.service.state) and rename it to values.
8. Now, the preview shows us the count of records with any states and the count of running.
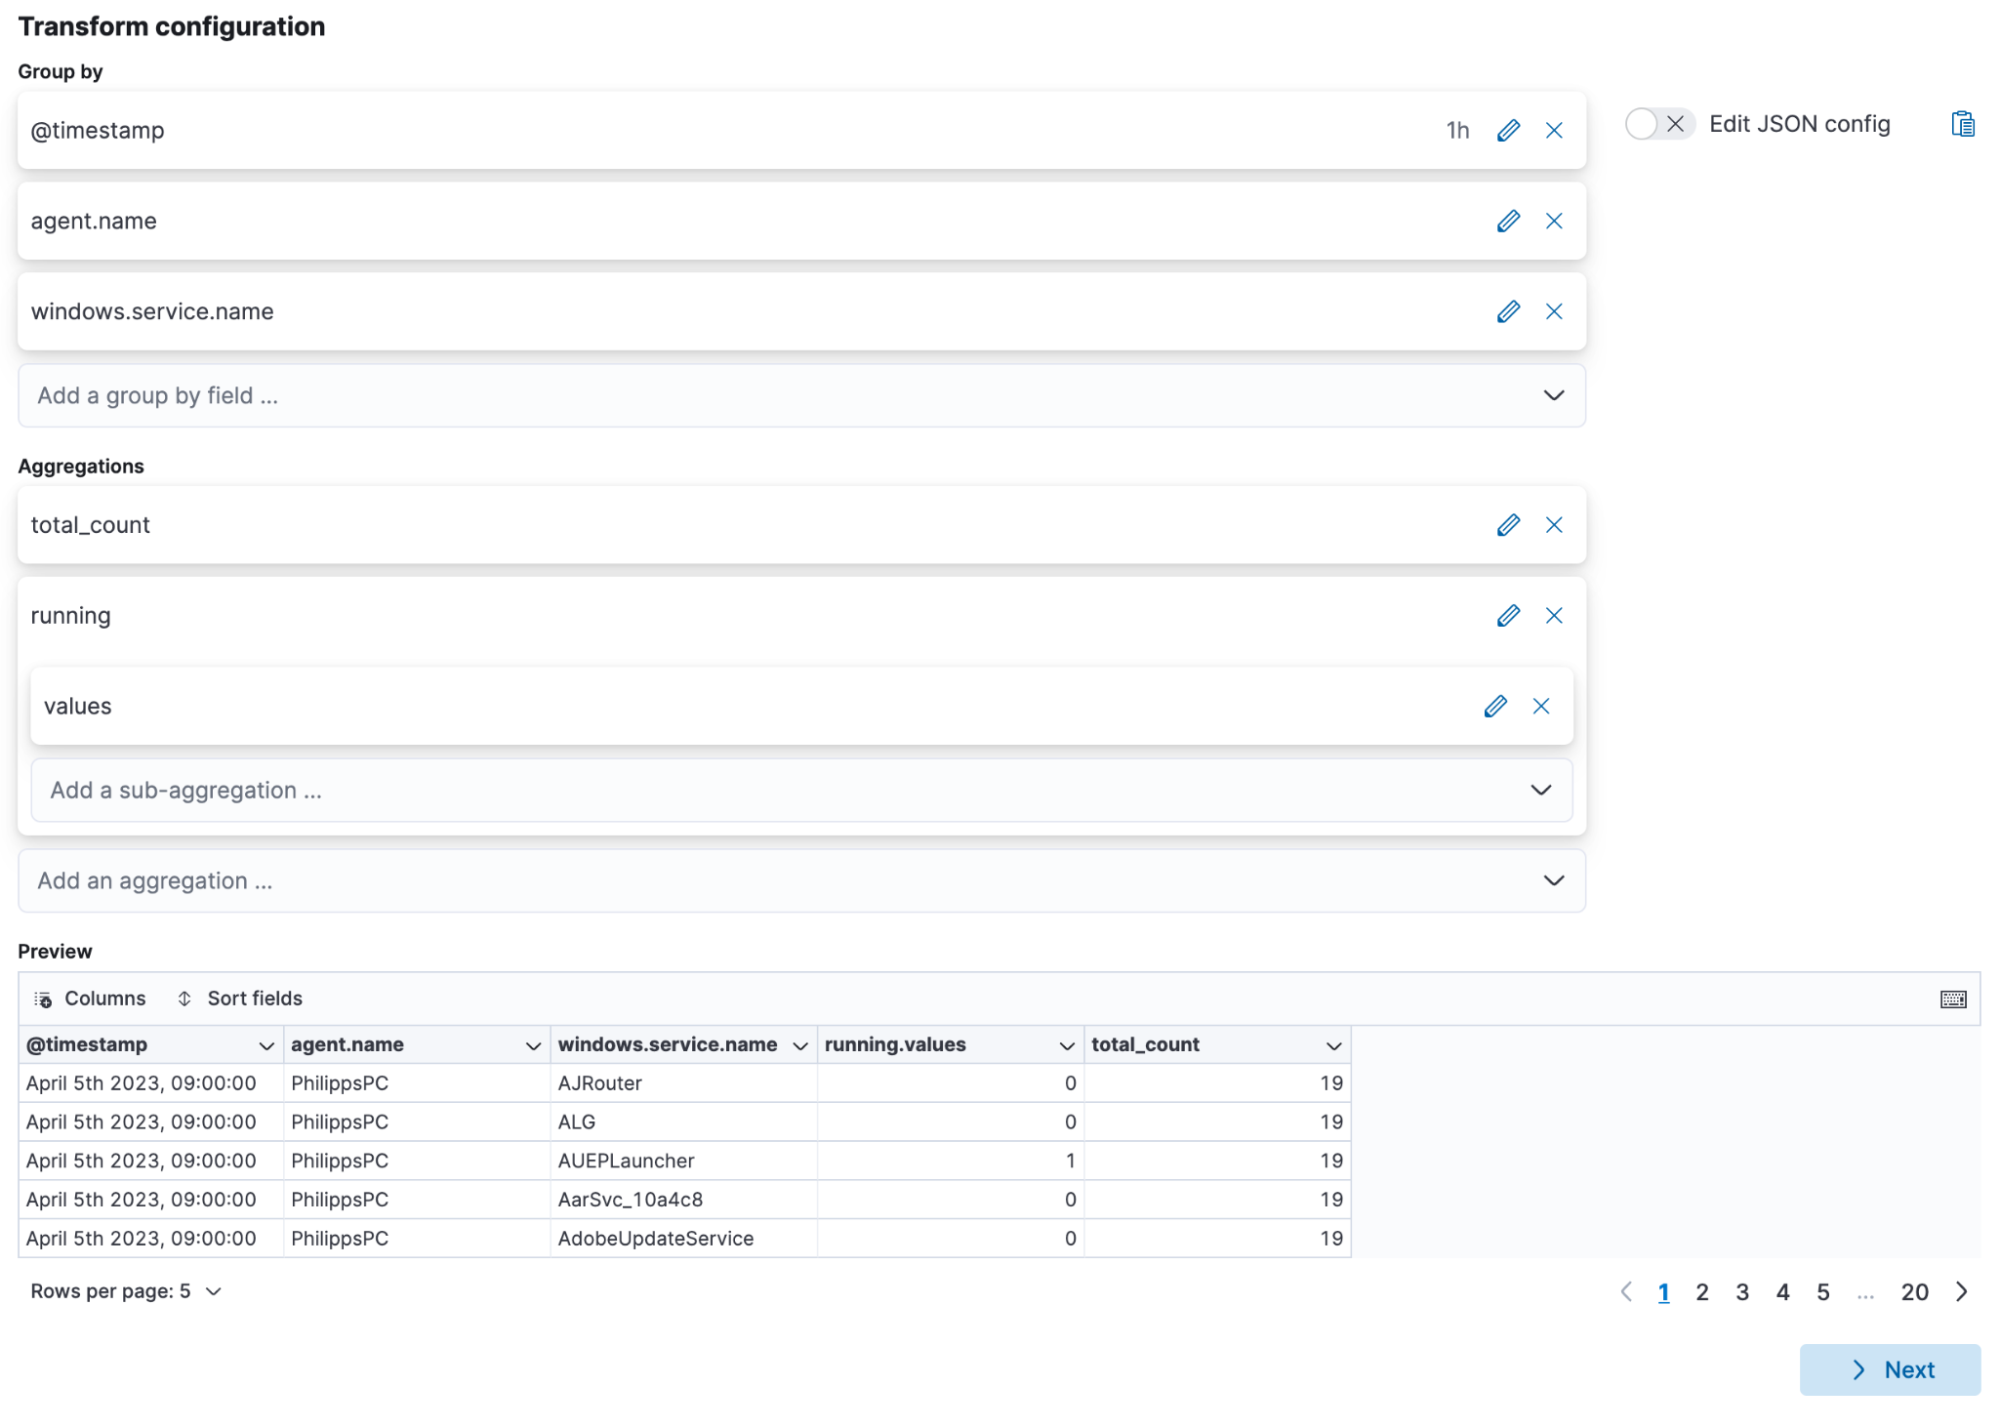
9. Here comes the tricky part. We need to write some custom aggregations to calculate the percentage of uptime. Click on the copy icon next to the edit JSON config.
10. In a new tab, go to Dev Tools. Paste what you have in the clipboard.
11. Press the play button or use the keyboard shortcut ctrl+enter/cmd+enter and run it. This will create a preview of what the data looks like. It should give you the same information as in the table preview.
12. Now, we need to calculate the percentage of up, which means doing a bucket script where we divide running.values by total_count, just like we did in the Lens visualization. Suppose you name the columns differently or use more than a single value. In that case, you will need to adapt accordingly.
 "availability": {
        "bucket_script": {
          "buckets_path": {
            "up": "running>values",
            "total": "total_count"
          },
          "script": "params.up/params.total"
        }
}13. This is the entire transform for me:
POST _transform/_preview
{
  "source": {
    "index": [
      "metrics-*"
    ]
  },
  "pivot": {
    "group_by": {
      "@timestamp": {
        "date_histogram": {
          "field": "@timestamp",
          "calendar_interval": "1h"
        }
      },
      "agent.name": {
        "terms": {
          "field": "agent.name"
        }
      },
      "windows.service.name": {
        "terms": {
          "field": "windows.service.name"
        }
      }
    },
    "aggregations": {
      "total_count": {
        "value_count": {
          "field": "windows.service.state"
        }
      },
      "running": {
        "filter": {
          "term": {
            "windows.service.state": "Running"
          }
        },
        "aggs": {
          "values": {
            "value_count": {
              "field": "windows.service.state"
            }
          }
        }
      },
      "availability": {
        "bucket_script": {
          "buckets_path": {
            "up": "running>values",
            "total": "total_count"
          },
          "script": "params.up/params.total"
        }
      }
    }
  }
}14. The preview in Dev Tools should work and be complete. Otherwise, you must debug any errors. Most of the time, it is the bucket script and the path to the values. You might have called it up instead of running. This is what the preview looks like for me.
 {
      "running": {
        "values": 1
      },
      "agent": {
        "name": "AnnalenasMac"
      },
      "@timestamp": "2021-12-07T19:00:00.000Z",
      "total_count": 1,
      "availability": 1,
      "windows": {
        "service": {
          "name": "InstallService"
        }
      }
},15. Now we only paste the bucket script into the transform creation UI after selecting Edit JSON. It looks like this:
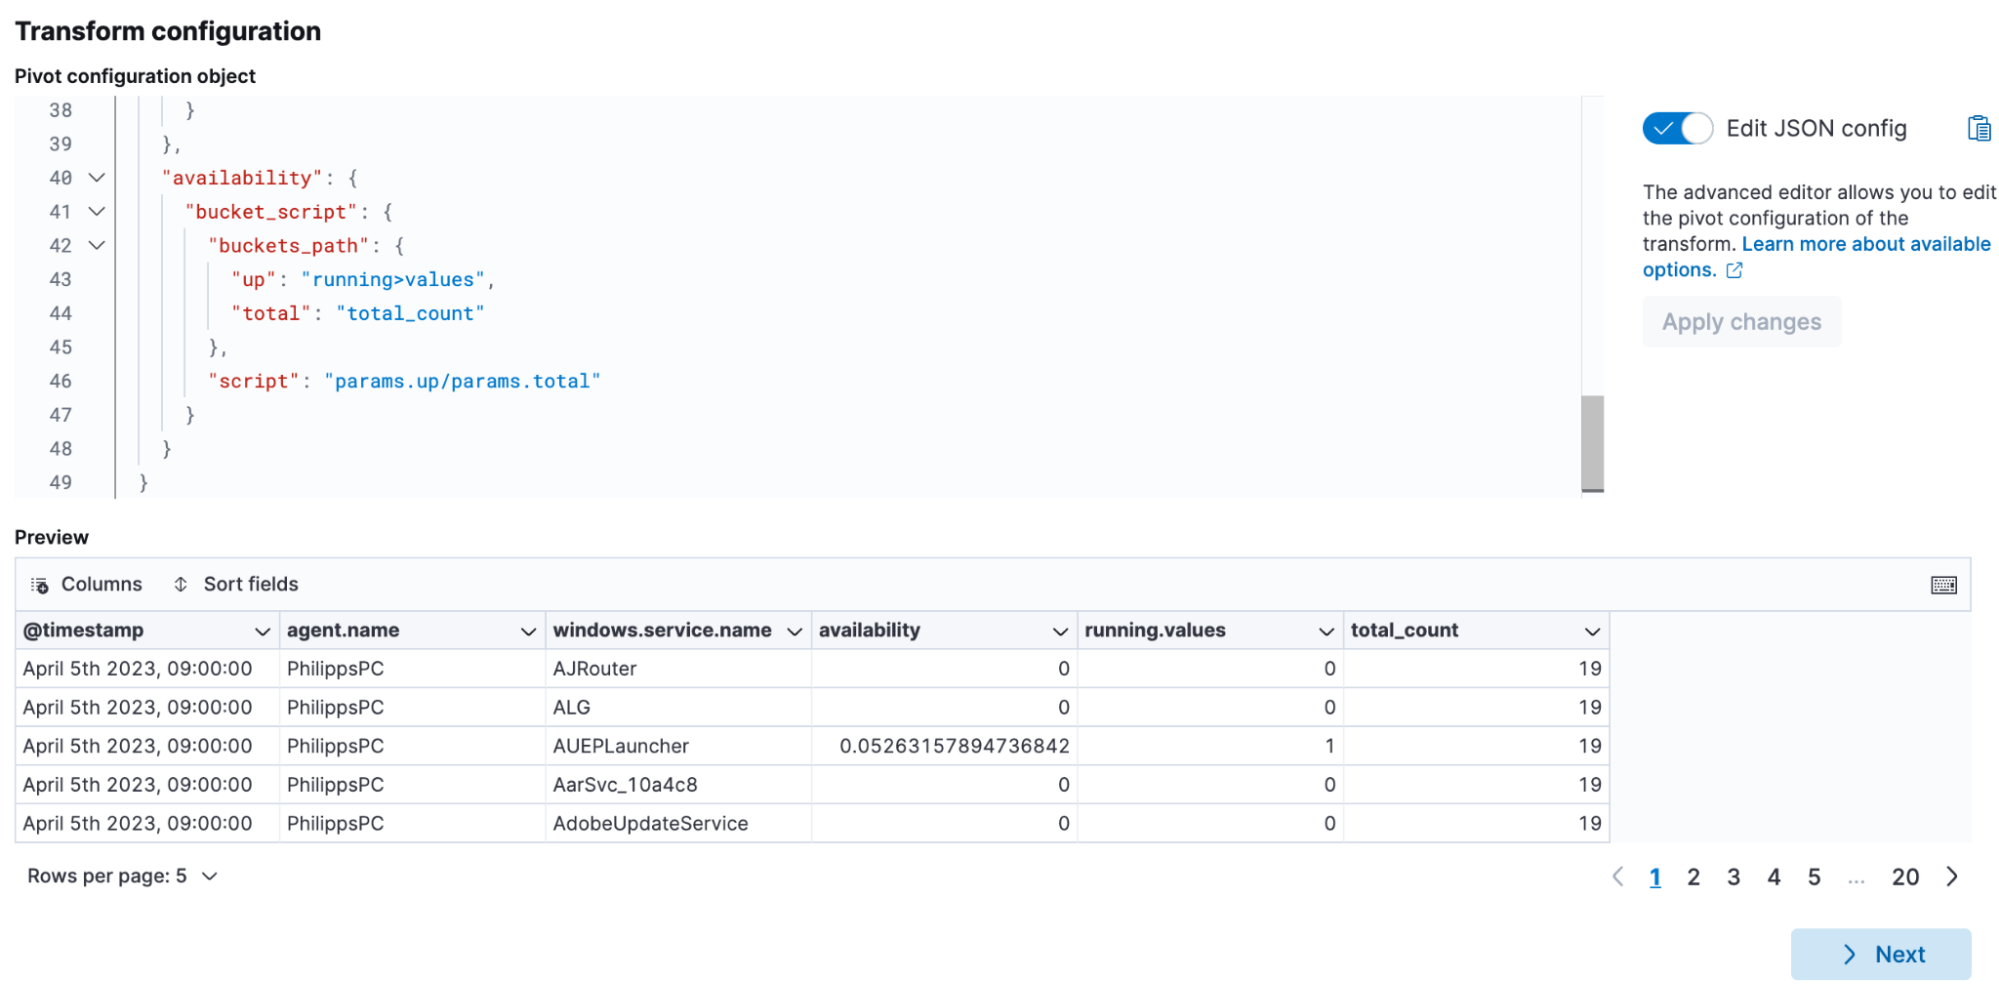
16. Give your transform a name, set the destination index, and run it continuously. When selecting this, please also make sure not to use @timestamp. Instead, opt for event.ingested. Our documentation explains this in detail.
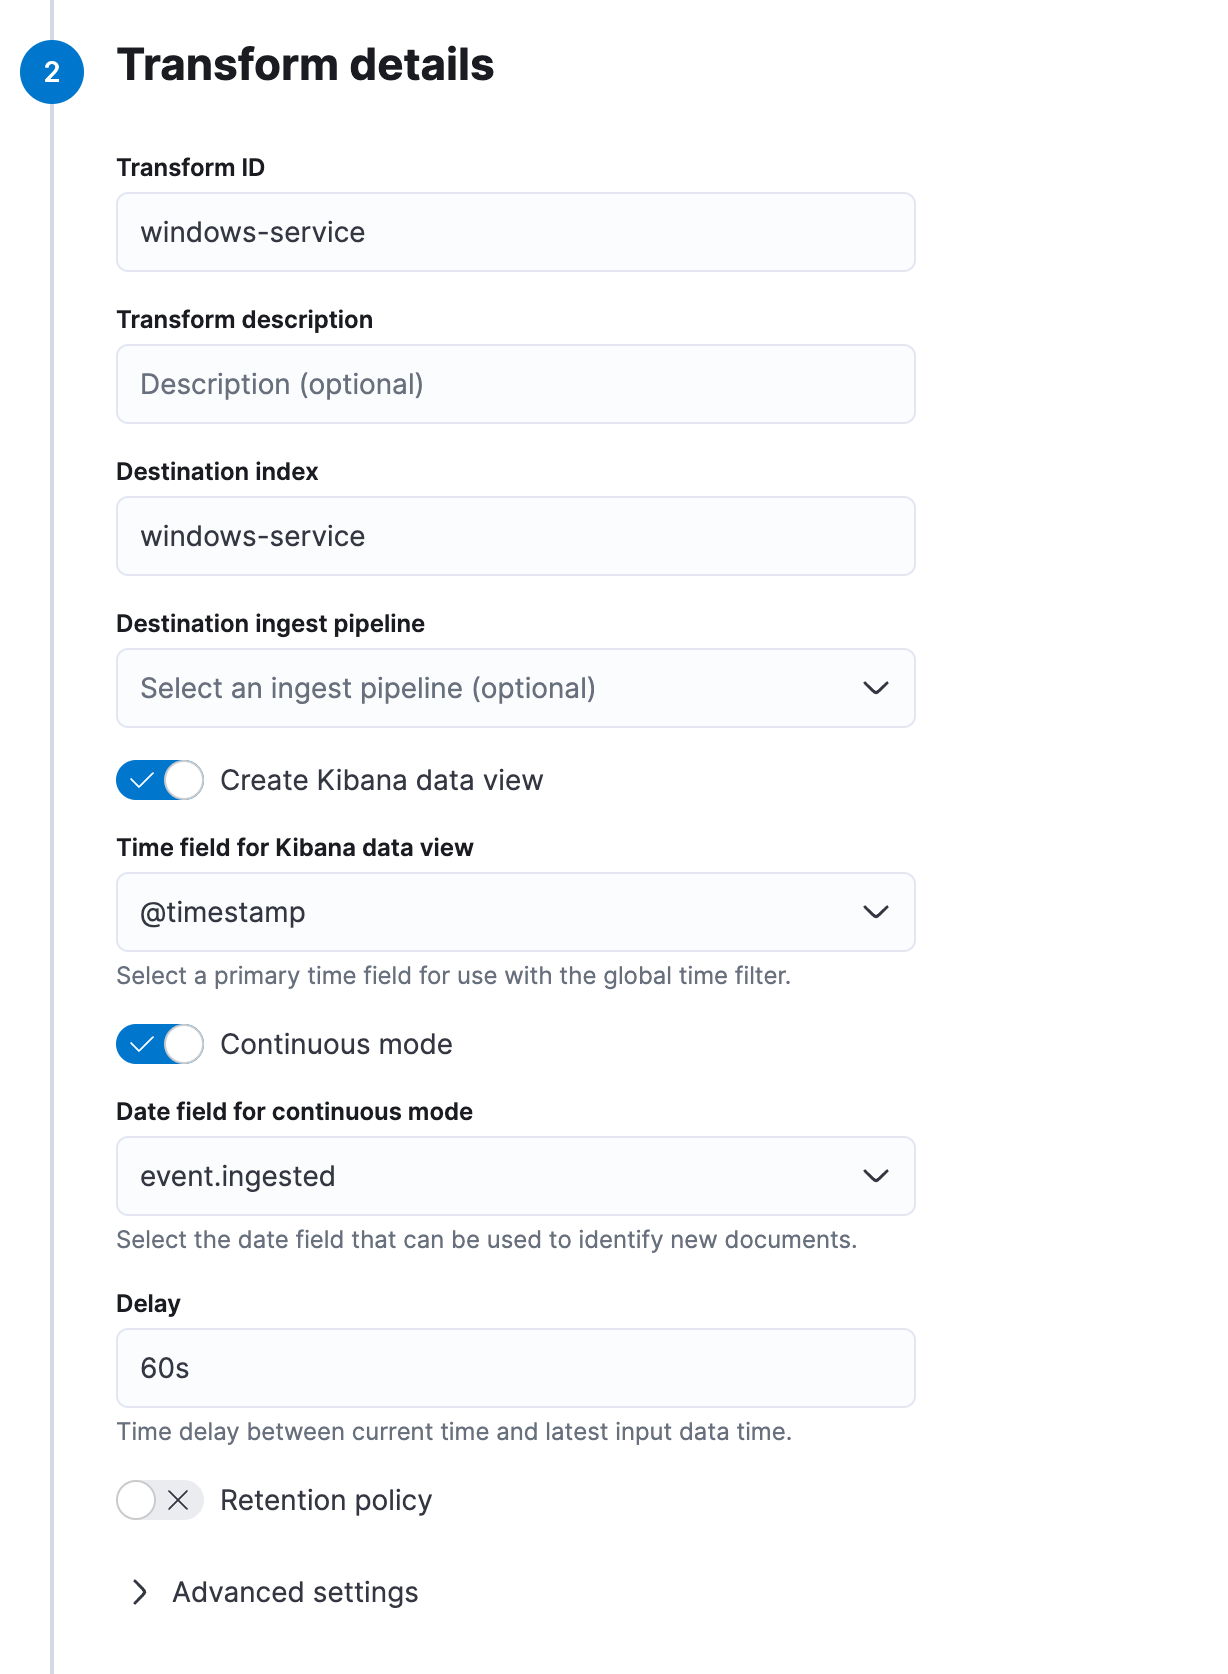
17. Click next and create and start. This can take a bit, so don’t worry.
To summarize, we have now created a pivot transform using a bucket script aggregation to calculate the running time of a service in percentage. There is a caveat because Elastic Agent, per default, only collects the every 60 seconds the services state. It can be that a service is up exactly when collected and down a few seconds later. If it is that important and no other monitoring possibilities, such as Elastic Synthetics are possible, you might want to reduce the collection time on the Agent side to get the services state every 30 seconds, 45 seconds. Depending on how important your thresholds are, you can create multiple policies having different collection times. This ensures that a super important server might collect the services state every 10 seconds because you need as much granularity and insurance for the correctness of the metric. For normal workstations where you just want to know if your remote access solution is up the majority of the time, you might not mind having a single metric every 60 seconds.
After you have created the transform, one additional feature you get is that the data is stored in an index, similar to in Elasticsearch. When you just do the visualization, the metric is calculated for this visualization only and not available anywhere else. Since this is now data, you can create a threshold alert to your favorite connection (Slack, Teams, Service Now, Mail, and so many more to choose from).
Visualizing the transformed data
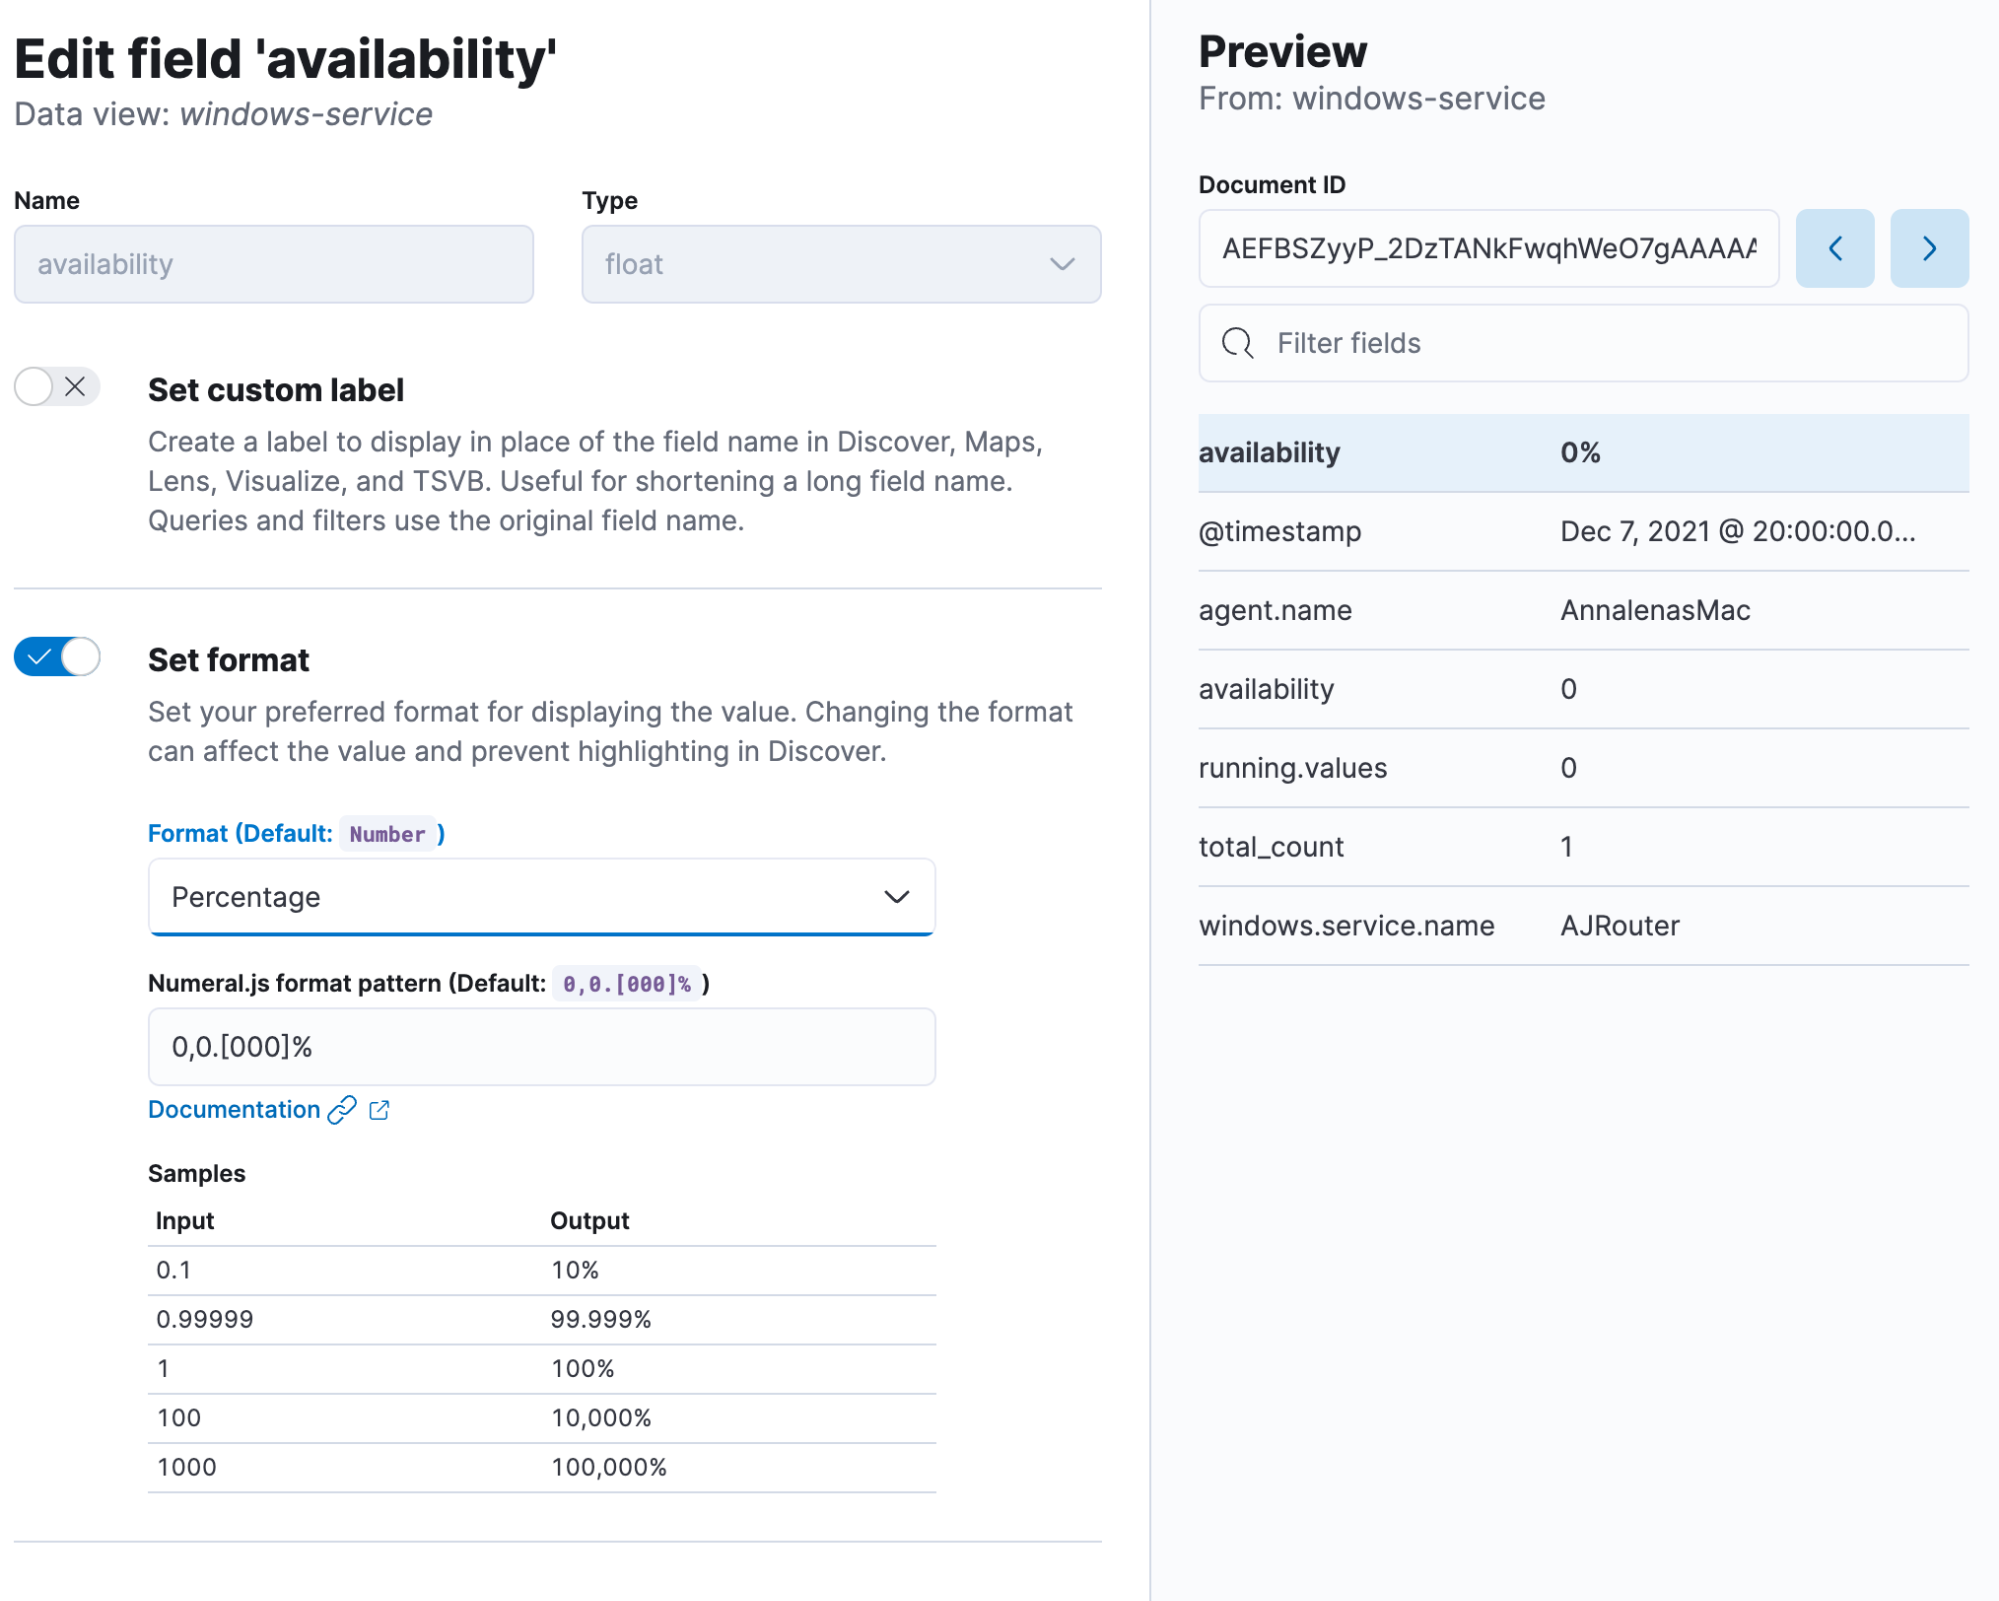
The transform created a data view called windows-service. The first thing we want to do is change the format of the availability field to a percentage. This automatically tells Lens that this needs to be formatted as a percentage field, so you don’t need to select it manually as well as do calculations. Furthermore, in Discover, instead of seeing 0.5 you see 50%. Isn’t that cool? This is also possible for durations, like event.duration if you have it as nanoseconds! No more calculations on the fly and thinking if you need to divide by 1,000 or 1,000,000.
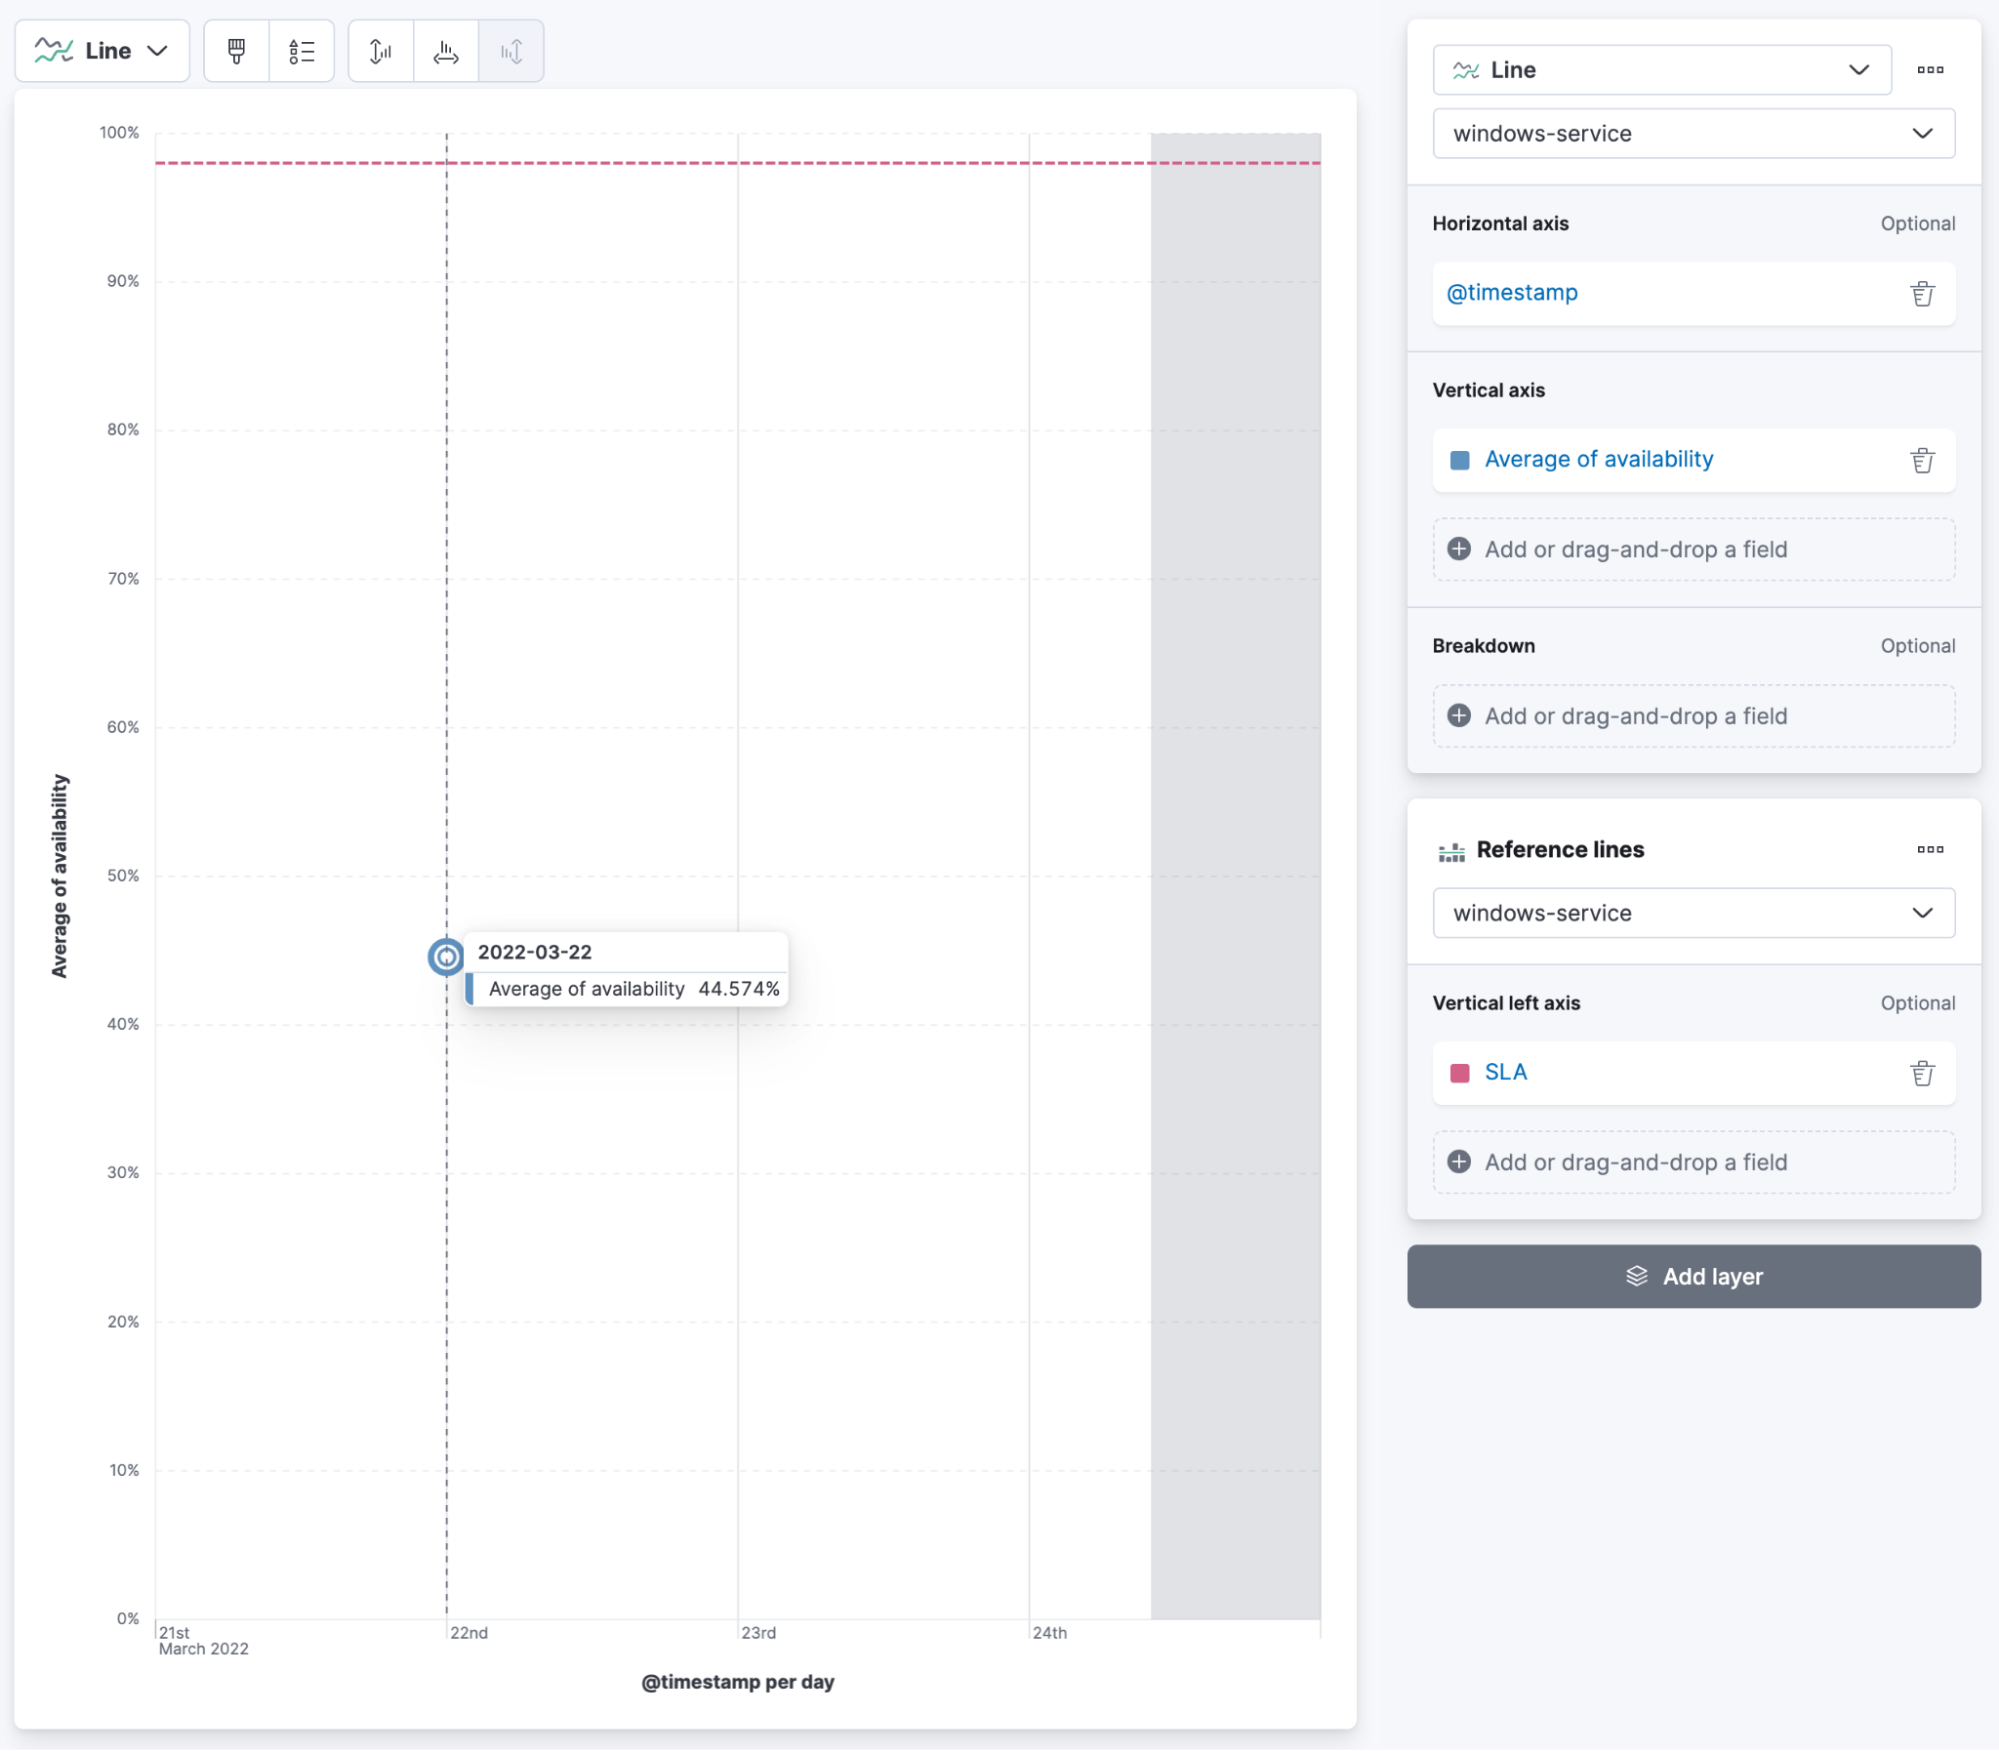
We get this view by using a simple Lens visualization with a timestamp on the vertical axis with the minimum interval for 1 day and an average of availability. Don’t worry — the other data will be populated once the transformation finishes. We can add a reference line using the value 0.98 because our target is 98% uptime of the service.
Summary
This blog post covered the steps needed to calculate the SLA for a specific data set in Elastic Observability, as well as how to visualize it. Using this calculation method opens the door to a lot of interesting use cases. You can change the bucket script and start calculating the number of sales, and the average basket size. Interested in learning more about Elastic Synthetics? Read our documentation or check out our free Synthetic Monitoring Quick Start training.

