- Elasticsearch Guide: other versions:
- What is Elasticsearch?
- What’s new in 7.7
- Getting started with Elasticsearch
- Set up Elasticsearch
- Installing Elasticsearch
- Configuring Elasticsearch
- Setting JVM options
- Secure settings
- Auditing settings
- Circuit breaker settings
- Cluster-level shard allocation and routing settings
- Cross-cluster replication settings
- Discovery and cluster formation settings
- Field data cache settings
- HTTP
- Index lifecycle management settings
- Index recovery settings
- Indexing buffer settings
- License settings
- Local gateway settings
- Logging configuration
- Machine learning settings
- Monitoring settings
- Node
- Network settings
- Node query cache settings
- Search settings
- Security settings
- Shard request cache settings
- Snapshot lifecycle management settings
- SQL access settings
- Transforms settings
- Transport
- Thread pools
- Watcher settings
- Important Elasticsearch configuration
- Important System Configuration
- Bootstrap Checks
- Heap size check
- File descriptor check
- Memory lock check
- Maximum number of threads check
- Max file size check
- Maximum size virtual memory check
- Maximum map count check
- Client JVM check
- Use serial collector check
- System call filter check
- OnError and OnOutOfMemoryError checks
- Early-access check
- G1GC check
- All permission check
- Discovery configuration check
- Bootstrap Checks for X-Pack
- Starting Elasticsearch
- Stopping Elasticsearch
- Discovery and cluster formation
- Add and remove nodes in your cluster
- Full-cluster restart and rolling restart
- Remote clusters
- Set up X-Pack
- Configuring X-Pack Java Clients
- Plugins
- Upgrade Elasticsearch
- Search your data
- Query DSL
- SQL access
- Overview
- Getting Started with SQL
- Conventions and Terminology
- Security
- SQL REST API
- SQL Translate API
- SQL CLI
- SQL JDBC
- SQL ODBC
- SQL Client Applications
- SQL Language
- Functions and Operators
- Comparison Operators
- Logical Operators
- Math Operators
- Cast Operators
- LIKE and RLIKE Operators
- Aggregate Functions
- Grouping Functions
- Date/Time and Interval Functions and Operators
- Full-Text Search Functions
- Mathematical Functions
- String Functions
- Type Conversion Functions
- Geo Functions
- Conditional Functions And Expressions
- System Functions
- Reserved keywords
- SQL Limitations
- Aggregations
- Metrics Aggregations
- Avg Aggregation
- Weighted Avg Aggregation
- Boxplot Aggregation
- Cardinality Aggregation
- Stats Aggregation
- Extended Stats Aggregation
- Geo Bounds Aggregation
- Geo Centroid Aggregation
- Max Aggregation
- Min Aggregation
- Median Absolute Deviation Aggregation
- Percentiles Aggregation
- Percentile Ranks Aggregation
- Scripted Metric Aggregation
- String Stats Aggregation
- Sum Aggregation
- Top Hits Aggregation
- Top Metrics Aggregation
- Value Count Aggregation
- Bucket Aggregations
- Adjacency Matrix Aggregation
- Auto-interval Date Histogram Aggregation
- Children Aggregation
- Composite aggregation
- Date histogram aggregation
- Date Range Aggregation
- Diversified Sampler Aggregation
- Filter Aggregation
- Filters Aggregation
- Geo Distance Aggregation
- GeoHash grid Aggregation
- GeoTile Grid Aggregation
- Global Aggregation
- Histogram Aggregation
- IP Range Aggregation
- Missing Aggregation
- Nested Aggregation
- Parent Aggregation
- Range Aggregation
- Rare Terms Aggregation
- Reverse nested Aggregation
- Sampler Aggregation
- Significant Terms Aggregation
- Significant Text Aggregation
- Terms Aggregation
- Subtleties of bucketing range fields
- Pipeline Aggregations
- Bucket Script Aggregation
- Bucket Selector Aggregation
- Bucket Sort Aggregation
- Avg Bucket Aggregation
- Max Bucket Aggregation
- Min Bucket Aggregation
- Sum Bucket Aggregation
- Cumulative Cardinality Aggregation
- Cumulative Sum Aggregation
- Derivative Aggregation
- Percentiles Bucket Aggregation
- Moving Average Aggregation
- Moving Function Aggregation
- Serial Differencing Aggregation
- Stats Bucket Aggregation
- Extended Stats Bucket Aggregation
- Matrix Aggregations
- Caching heavy aggregations
- Returning only aggregation results
- Aggregation Metadata
- Returning the type of the aggregation
- Indexing aggregation results with transforms
- Metrics Aggregations
- Scripting
- Mapping
- Text analysis
- Overview
- Concepts
- Configure text analysis
- Built-in analyzer reference
- Tokenizer reference
- Char Group Tokenizer
- Classic Tokenizer
- Edge n-gram tokenizer
- Keyword Tokenizer
- Letter Tokenizer
- Lowercase Tokenizer
- N-gram tokenizer
- Path Hierarchy Tokenizer
- Path Hierarchy Tokenizer Examples
- Pattern Tokenizer
- Simple Pattern Tokenizer
- Simple Pattern Split Tokenizer
- Standard Tokenizer
- Thai Tokenizer
- UAX URL Email Tokenizer
- Whitespace Tokenizer
- Token filter reference
- Apostrophe
- ASCII folding
- CJK bigram
- CJK width
- Classic
- Common grams
- Conditional
- Decimal digit
- Delimited payload
- Dictionary decompounder
- Edge n-gram
- Elision
- Fingerprint
- Flatten graph
- Hunspell
- Hyphenation decompounder
- Keep types
- Keep words
- Keyword marker
- Keyword repeat
- KStem
- Length
- Limit token count
- Lowercase
- MinHash
- Multiplexer
- N-gram
- Normalization
- Pattern capture
- Pattern replace
- Phonetic
- Porter stem
- Predicate script
- Remove duplicates
- Reverse
- Shingle
- Snowball
- Stemmer
- Stemmer override
- Stop
- Synonym
- Synonym graph
- Trim
- Truncate
- Unique
- Uppercase
- Word delimiter
- Word delimiter graph
- Character filters reference
- Normalizers
- Index modules
- Ingest node
- Pipeline Definition
- Accessing Data in Pipelines
- Conditional Execution in Pipelines
- Handling Failures in Pipelines
- Enrich your data
- Processors
- Append Processor
- Bytes Processor
- Circle Processor
- Convert Processor
- CSV Processor
- Date Processor
- Date Index Name Processor
- Dissect Processor
- Dot Expander Processor
- Drop Processor
- Enrich Processor
- Fail Processor
- Foreach Processor
- GeoIP Processor
- Grok Processor
- Gsub Processor
- HTML Strip Processor
- Inference Processor
- Join Processor
- JSON Processor
- KV Processor
- Lowercase Processor
- Pipeline Processor
- Remove Processor
- Rename Processor
- Script Processor
- Set Processor
- Set Security User Processor
- Split Processor
- Sort Processor
- Trim Processor
- Uppercase Processor
- URL Decode Processor
- User Agent processor
- ILM: Manage the index lifecycle
- Monitor a cluster
- Frozen indices
- Roll up or transform your data
- Set up a cluster for high availability
- Snapshot and restore
- Secure a cluster
- Overview
- Configuring security
- User authentication
- Built-in users
- Internal users
- Token-based authentication services
- Realms
- Realm chains
- Active Directory user authentication
- File-based user authentication
- LDAP user authentication
- Native user authentication
- OpenID Connect authentication
- PKI user authentication
- SAML authentication
- Kerberos authentication
- Integrating with other authentication systems
- Enabling anonymous access
- Controlling the user cache
- Configuring SAML single-sign-on on the Elastic Stack
- Configuring single sign-on to the Elastic Stack using OpenID Connect
- User authorization
- Built-in roles
- Defining roles
- Security privileges
- Document level security
- Field level security
- Granting privileges for indices and aliases
- Mapping users and groups to roles
- Setting up field and document level security
- Submitting requests on behalf of other users
- Configuring authorization delegation
- Customizing roles and authorization
- Enabling audit logging
- Encrypting communications
- Restricting connections with IP filtering
- Cross cluster search, clients, and integrations
- Tutorial: Getting started with security
- Tutorial: Encrypting communications
- Troubleshooting
- Some settings are not returned via the nodes settings API
- Authorization exceptions
- Users command fails due to extra arguments
- Users are frequently locked out of Active Directory
- Certificate verification fails for curl on Mac
- SSLHandshakeException causes connections to fail
- Common SSL/TLS exceptions
- Common Kerberos exceptions
- Common SAML issues
- Internal Server Error in Kibana
- Setup-passwords command fails due to connection failure
- Failures due to relocation of the configuration files
- Limitations
- Alerting on cluster and index events
- Command line tools
- How To
- Glossary of terms
- REST APIs
- API conventions
- cat APIs
- cat aliases
- cat allocation
- cat anomaly detectors
- cat count
- cat data frame analytics
- cat datafeeds
- cat fielddata
- cat health
- cat indices
- cat master
- cat nodeattrs
- cat nodes
- cat pending tasks
- cat plugins
- cat recovery
- cat repositories
- cat shards
- cat segments
- cat snapshots
- cat task management
- cat templates
- cat thread pool
- cat trained model
- cat transforms
- Cluster APIs
- Cluster allocation explain
- Cluster get settings
- Cluster health
- Cluster reroute
- Cluster state
- Cluster stats
- Cluster update settings
- Nodes feature usage
- Nodes hot threads
- Nodes info
- Nodes reload secure settings
- Nodes stats
- Pending cluster tasks
- Remote cluster info
- Task management
- Voting configuration exclusions
- Cross-cluster replication APIs
- Document APIs
- Enrich APIs
- Explore API
- Index APIs
- Add index alias
- Analyze
- Clear cache
- Clone index
- Close index
- Create index
- Delete index
- Delete index alias
- Delete index template
- Flush
- Force merge
- Freeze index
- Get field mapping
- Get index
- Get index alias
- Get index settings
- Get index template
- Get mapping
- Index alias exists
- Index exists
- Index recovery
- Index segments
- Index shard stores
- Index stats
- Index template exists
- Open index
- Put index template
- Put mapping
- Refresh
- Rollover index
- Shrink index
- Split index
- Synced flush
- Type exists
- Unfreeze index
- Update index alias
- Update index settings
- Index lifecycle management API
- Ingest APIs
- Info API
- Licensing APIs
- Machine learning anomaly detection APIs
- Add events to calendar
- Add jobs to calendar
- Close jobs
- Create jobs
- Create calendar
- Create datafeeds
- Create filter
- Delete calendar
- Delete datafeeds
- Delete events from calendar
- Delete filter
- Delete forecast
- Delete jobs
- Delete jobs from calendar
- Delete model snapshots
- Delete expired data
- Estimate model memory
- Find file structure
- Flush jobs
- Forecast jobs
- Get buckets
- Get calendars
- Get categories
- Get datafeeds
- Get datafeed statistics
- Get influencers
- Get jobs
- Get job statistics
- Get machine learning info
- Get model snapshots
- Get overall buckets
- Get scheduled events
- Get filters
- Get records
- Open jobs
- Post data to jobs
- Preview datafeeds
- Revert model snapshots
- Set upgrade mode
- Start datafeeds
- Stop datafeeds
- Update datafeeds
- Update filter
- Update jobs
- Update model snapshots
- Machine learning data frame analytics APIs
- Create data frame analytics jobs
- Create inference trained model
- Delete data frame analytics jobs
- Delete inference trained model
- Evaluate data frame analytics
- Explain data frame analytics API
- Get data frame analytics jobs
- Get data frame analytics jobs stats
- Get inference trained model
- Get inference trained model stats
- Start data frame analytics jobs
- Stop data frame analytics jobs
- Migration APIs
- Reload search analyzers
- Rollup APIs
- Search APIs
- Security APIs
- Authenticate
- Change passwords
- Clear cache
- Clear roles cache
- Create API keys
- Create or update application privileges
- Create or update role mappings
- Create or update roles
- Create or update users
- Delegate PKI authentication
- Delete application privileges
- Delete role mappings
- Delete roles
- Delete users
- Disable users
- Enable users
- Get API key information
- Get application privileges
- Get builtin privileges
- Get role mappings
- Get roles
- Get token
- Get users
- Has privileges
- Invalidate API key
- Invalidate token
- OpenID Connect Prepare Authentication API
- OpenID Connect authenticate API
- OpenID Connect logout API
- SAML prepare authentication API
- SAML authenticate API
- SAML logout API
- SAML invalidate API
- SSL certificate
- Snapshot and restore APIs
- Snapshot lifecycle management API
- Transform APIs
- Usage API
- Watcher APIs
- Definitions
- Breaking changes
- Release notes
- Elasticsearch version 7.7.1
- Elasticsearch version 7.7.0
- Elasticsearch version 7.6.2
- Elasticsearch version 7.6.1
- Elasticsearch version 7.6.0
- Elasticsearch version 7.5.2
- Elasticsearch version 7.5.1
- Elasticsearch version 7.5.0
- Elasticsearch version 7.4.2
- Elasticsearch version 7.4.1
- Elasticsearch version 7.4.0
- Elasticsearch version 7.3.2
- Elasticsearch version 7.3.1
- Elasticsearch version 7.3.0
- Elasticsearch version 7.2.1
- Elasticsearch version 7.2.0
- Elasticsearch version 7.1.1
- Elasticsearch version 7.1.0
- Elasticsearch version 7.0.0
- Elasticsearch version 7.0.0-rc2
- Elasticsearch version 7.0.0-rc1
- Elasticsearch version 7.0.0-beta1
- Elasticsearch version 7.0.0-alpha2
- Elasticsearch version 7.0.0-alpha1
Starting Elasticsearch
editStarting Elasticsearch
editThe method for starting Elasticsearch varies depending on how you installed it.
Archive packages (.tar.gz)
editIf you installed Elasticsearch with a .tar.gz package, you can start Elasticsearch from the
command line.
Running Elasticsearch from the command line
editElasticsearch can be started from the command line as follows:
./bin/elasticsearch
If you have password-protected the Elasticsearch keystore, you will be prompted to enter the keystore’s password. See Secure settings for more details.
By default, Elasticsearch runs in the foreground, prints its logs to the
standard output (stdout), and can be stopped by pressing Ctrl-C.
All scripts packaged with Elasticsearch require a version of Bash
that supports arrays and assume that Bash is available at /bin/bash.
As such, Bash should be available at this path either directly or via a
symbolic link.
Running as a daemon
editTo run Elasticsearch as a daemon, specify -d on the command line, and record
the process ID in a file using the -p option:
./bin/elasticsearch -d -p pid
If you have password-protected the Elasticsearch keystore, you will be prompted to enter the keystore’s password. See Secure settings for more details.
Log messages can be found in the $ES_HOME/logs/ directory.
To shut down Elasticsearch, kill the process ID recorded in the pid file:
pkill -F pid
Archive packages (.zip)
editIf you installed Elasticsearch on Windows with a .zip package, you can start Elasticsearch from
the command line. If you want Elasticsearch to start automatically at boot time without
any user interaction, install Elasticsearch as a service.
Running Elasticsearch from the command line
editElasticsearch can be started from the command line as follows:
.\bin\elasticsearch.bat
If you have password-protected the Elasticsearch keystore, you will be prompted to enter the keystore’s password. See Secure settings for more details.
By default, Elasticsearch runs in the foreground, prints its logs to STDOUT,
and can be stopped by pressing Ctrl-C.
Debian packages
editElasticsearch is not started automatically after installation. How to start
and stop Elasticsearch depends on whether your system uses SysV init or
systemd (used by newer distributions). You can tell which is being used by
running this command:
ps -p 1
Running Elasticsearch with SysV init
editUse the update-rc.d command to configure Elasticsearch to start automatically
when the system boots up:
sudo update-rc.d elasticsearch defaults 95 10
Elasticsearch can be started and stopped using the service command:
sudo -i service elasticsearch start
sudo -i service elasticsearch stop
If Elasticsearch fails to start for any reason, it will print the reason for
failure to STDOUT. Log files can be found in /var/log/elasticsearch/.
Running Elasticsearch with systemd
editTo configure Elasticsearch to start automatically when the system boots up, run the following commands:
sudo /bin/systemctl daemon-reload
sudo /bin/systemctl enable elasticsearch.service
Elasticsearch can be started and stopped as follows:
sudo systemctl start elasticsearch.service
sudo systemctl stop elasticsearch.service
These commands provide no feedback as to whether Elasticsearch was started
successfully or not. Instead, this information will be written in the log
files located in /var/log/elasticsearch/.
If you have password-protected your Elasticsearch keystore, you will need to provide
systemd with the keystore password using a local file and systemd environment
variables. This local file should be protected while it exists and may be
safely deleted once Elasticsearch is up and running.
echo "keystore_password" > /path/to/my_pwd_file.tmp
chmod 600 /path/to/my_pwd_file.tmp
sudo systemctl set-environment ES_KEYSTORE_PASSPHRASE_FILE=/path/to/my_pwd_file.tmp
sudo systemctl start elasticsearch.service
By default the Elasticsearch service doesn’t log information in the systemd
journal. To enable journalctl logging, the --quiet option must be removed
from the ExecStart command line in the elasticsearch.service file.
When systemd logging is enabled, the logging information are available using
the journalctl commands:
To tail the journal:
sudo journalctl -f
To list journal entries for the elasticsearch service:
sudo journalctl --unit elasticsearch
To list journal entries for the elasticsearch service starting from a given time:
sudo journalctl --unit elasticsearch --since "2016-10-30 18:17:16"
Check man journalctl or https://www.freedesktop.org/software/systemd/man/journalctl.html for
more command line options.
Docker images
editIf you installed a Docker image, you can start Elasticsearch from the command line. There are different methods depending on whether you’re using development mode or production mode. See Docker Run.
MSI packages
editIf you installed Elasticsearch on Windows using the .msi package, you can start Elasticsearch
from the command line. If you want it to start automatically at boot time
without any user interaction,
install Elasticsearch as a Windows service.
Running Elasticsearch from the command line
editOnce installed, Elasticsearch can be started from the command line, if not installed as a service and configured to start when installation completes, as follows:
.\bin\elasticsearch.exe
The command line terminal will display output similar to the following:
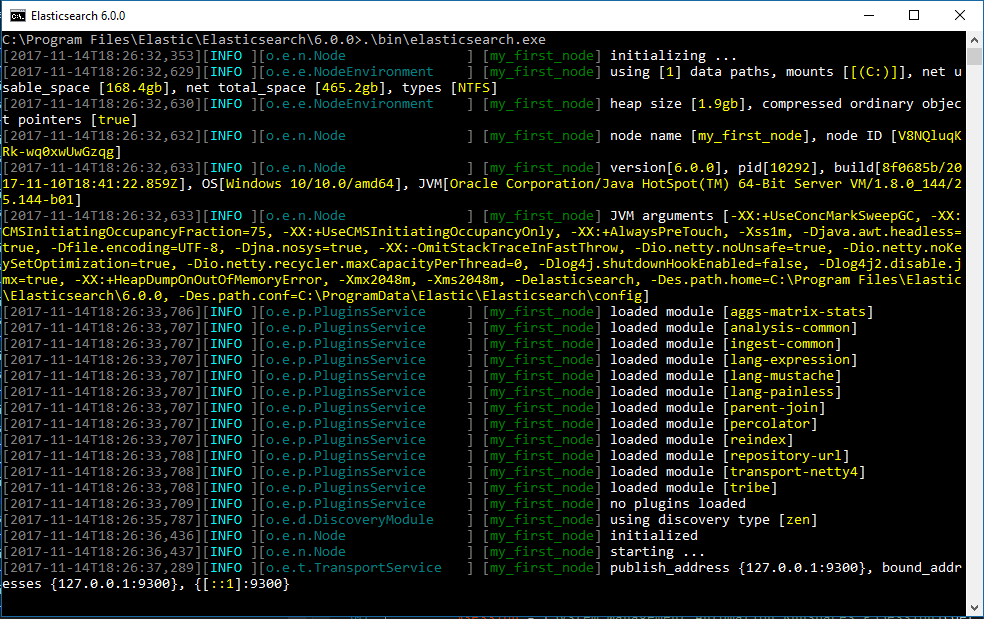
By default, Elasticsearch runs in the foreground, prints its logs to STDOUT in addition
to the <cluster name>.log file within LOGSDIRECTORY, and can be stopped by pressing Ctrl-C.
RPM packages
editElasticsearch is not started automatically after installation. How to start
and stop Elasticsearch depends on whether your system uses SysV init or
systemd (used by newer distributions). You can tell which is being used by
running this command:
ps -p 1
Running Elasticsearch with SysV init
editUse the chkconfig command to configure Elasticsearch to start automatically
when the system boots up:
sudo chkconfig --add elasticsearch
Elasticsearch can be started and stopped using the service command:
sudo -i service elasticsearch start
sudo -i service elasticsearch stop
If Elasticsearch fails to start for any reason, it will print the reason for
failure to STDOUT. Log files can be found in /var/log/elasticsearch/.
Running Elasticsearch with systemd
editTo configure Elasticsearch to start automatically when the system boots up, run the following commands:
sudo /bin/systemctl daemon-reload
sudo /bin/systemctl enable elasticsearch.service
Elasticsearch can be started and stopped as follows:
sudo systemctl start elasticsearch.service
sudo systemctl stop elasticsearch.service
These commands provide no feedback as to whether Elasticsearch was started
successfully or not. Instead, this information will be written in the log
files located in /var/log/elasticsearch/.
If you have password-protected your Elasticsearch keystore, you will need to provide
systemd with the keystore password using a local file and systemd environment
variables. This local file should be protected while it exists and may be
safely deleted once Elasticsearch is up and running.
echo "keystore_password" > /path/to/my_pwd_file.tmp
chmod 600 /path/to/my_pwd_file.tmp
sudo systemctl set-environment ES_KEYSTORE_PASSPHRASE_FILE=/path/to/my_pwd_file.tmp
sudo systemctl start elasticsearch.service
By default the Elasticsearch service doesn’t log information in the systemd
journal. To enable journalctl logging, the --quiet option must be removed
from the ExecStart command line in the elasticsearch.service file.
When systemd logging is enabled, the logging information are available using
the journalctl commands:
To tail the journal:
sudo journalctl -f
To list journal entries for the elasticsearch service:
sudo journalctl --unit elasticsearch
To list journal entries for the elasticsearch service starting from a given time:
sudo journalctl --unit elasticsearch --since "2016-10-30 18:17:16"
Check man journalctl or https://www.freedesktop.org/software/systemd/man/journalctl.html for
more command line options.
On this page
- Archive packages (
.tar.gz) - Running Elasticsearch from the command line
- Running as a daemon
- Archive packages (
.zip) - Running Elasticsearch from the command line
- Debian packages
- Running Elasticsearch with SysV
init - Running Elasticsearch with
systemd - Docker images
- MSI packages
- Running Elasticsearch from the command line
- RPM packages
- Running Elasticsearch with SysV
init - Running Elasticsearch with
systemd