Example: Use standalone Elastic Agent with Elastic Cloud Serverless to monitor nginx
This guide walks you through a simple monitoring scenario so you can learn the basics of setting up standalone Elastic Agent, using it to work with Elastic Cloud Serverless and an Elastic integration.
Following these steps, you’ll deploy the Elastic Stack, install a standalone Elastic Agent on a host to monitor an nginx web server instance, and access visualizations based on the collected logs.
- Install nginx.
- Create an Elastic Cloud Serverless project.
- Create an API key.
- Create an Elastic Agent policy.
- Add the Nginx Integration.
- Configure standalone Elastic Agent.
- Confirm that your Elastic Agent data is flowing.
- View your system data.
- View your nginx logging data.
To get started, you need:
- An internet connection and an email address for your Elastic Cloud trial.
- A Linux host machine on which you’ll install an nginx web server. The commands in this guide use an Ubuntu image but any Linux distribution should be fine.
To start, we’ll set up a basic nginx web server.
Run the following command on an Ubuntu Linux host, or refer to the nginx install documentation for the command appropriate to your operating system.
sudo apt install nginxOpen a web browser and visit your host machine’s external URL, for example
http://192.168.64.17/. You should see the nginx welcome message.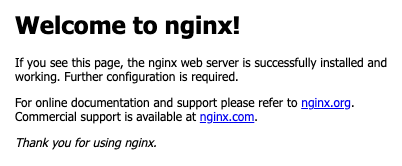
If you’ve already signed up for a trial deployment you can skip this step.
Now that your web server is running, let’s get set up to monitor it in Elastic Cloud. An Elastic Cloud Serverless project offers you all of the features of the Elastic Stack as a hosted service. To test drive your first deployment, sign up for a free Elastic Cloud trial:
Go to our Elastic Cloud Trial page.
Enter your email address and a password.
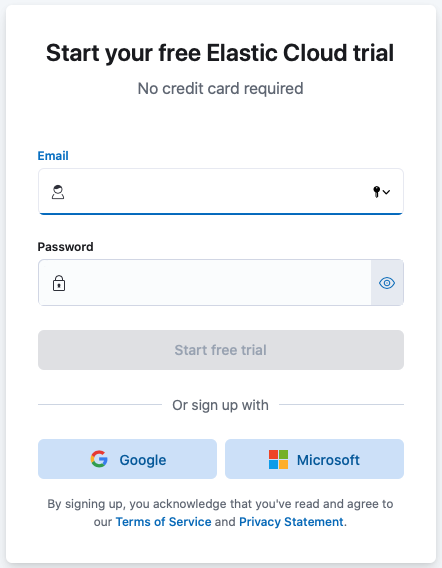
After you’ve logged in, select Create project.
On the Observability tab, select Next. The Observability and Security projects both include Fleet, which you can use to create a policy for the Elastic Agent that will monitor your nginx installation.
Give your project a name. You can leave the default options or select a different cloud provider and region.
Select Create project, and then wait a few minutes for the new project to set up.
Once the project is ready, select Continue. At this point, you access Kibana and a selection of setup guides.
- When your Serverless project is ready, open the Kibana menu and go to Project settings → Management → API keys.
- Select Create API key.
- Give the key a name, for example
nginx example API key. - Leave the other default options and select Create API key.
- In the Create API key confirmation dialog, change the dropdown menu setting from
EncodedtoBeats. This sets the API key to the format used for communication between Elastic Agent and Elasticsearch. - Copy the generated API key and store it in a safe place. You’ll use it in a later step.
Elastic Agent is a single, unified way to add monitoring for logs, metrics, and other types of data to a host. It can also protect hosts from security threats, query data from operating systems, and more. A single agent makes it easy and fast to deploy monitoring across your infrastructure. Each agent has a single policy (a collection of input settings) that you can update to add integrations for new data sources, security protections, and more.
Open the Kibana menu and go to Project settings → Fleet → Agent policies.

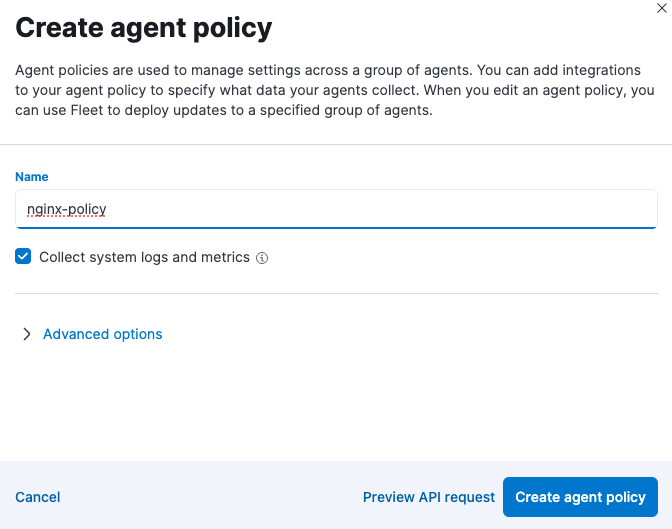
Click Create agent policy.
Give your policy a name. For this example we’ll call it
nginx-policy.Leave Collect system logs and metrics selected.
Click Create agent policy.
Elastic integrations are a streamlined way to connect your data from popular services and platforms to the Elastic Stack, including nginx.
From the Fleet → Agent policies tab, click the link for your new
nginx-policy.
The System integration (
system-1) is included because you opted earlier to collect system logs and metrics.Click Add integration.
On the Integrations page search for "nginx".
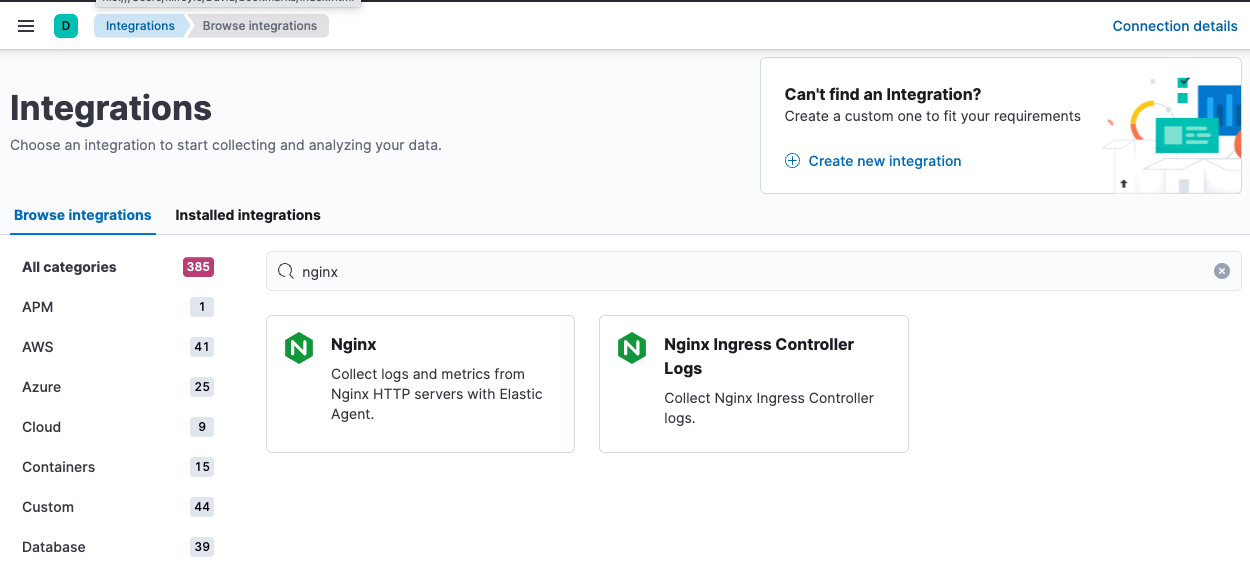
Select the Nginx card.
Click Add Nginx.
Click the link to Add integration only (skip agent installation). You’ll install standalone Elastic Agent in a later step.
Here, you can select options such as the paths to where your nginx logs are stored, whether or not to collect metrics data, and various other settings.
For now, leave all of the default settings and click Save and continue to add the Nginx integration to your
nginx-policypolicy.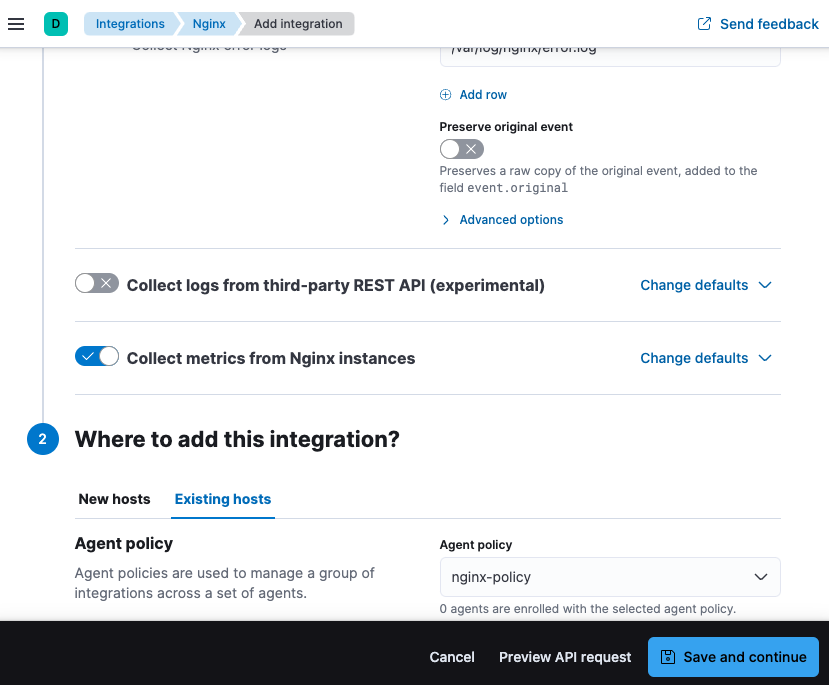
In the confirmation dialog, select to Add Elastic Agent later.

Rather than opt for Fleet to centrally manage Elastic Agent, you’ll configure an agent to run in standalone mode, so it will be managed by hand.
Open the Kibana menu and go to Fleet → Agents and click Add agent.
For the What type of host are you adding? step, select
nginx-policyfrom the drop-down menu if it’s not already selected.For the Enroll in Fleet? step, select Run standalone.
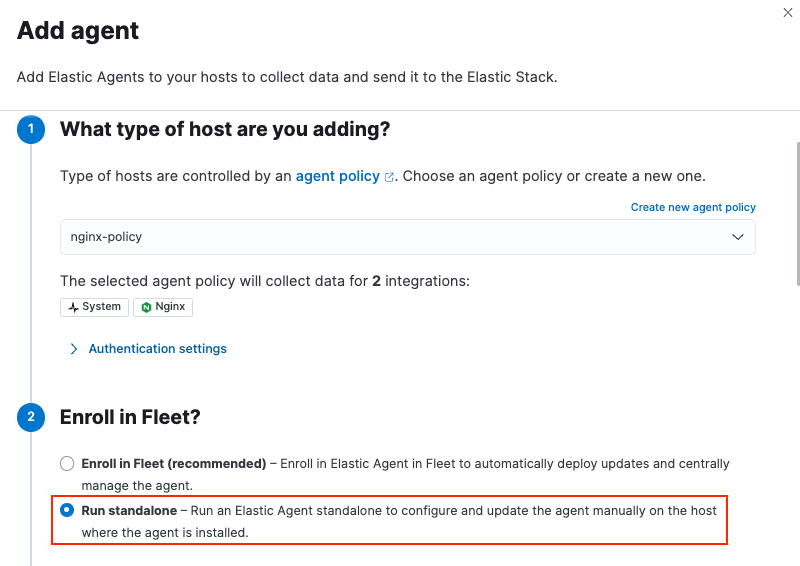
For the Configure the agent step, choose Download Policy. Save the
elastic-agent.ymlfile to a directory on the host where you’ll install nginx for monitoring.Have a look inside the policy file and notice that it contains all of the input, output, and other settings for the Nginx and System integrations. If you already have a standalone agent installed on a host with an existing Elastic Agent policy, you can use the method described here to add a new integration. Add the settings from the Configure the agent step to your existing
elastic-agent.ymlfile.For the Install Elastic Agent on your host step, select the tab for your host operating system and run the commands on your host.
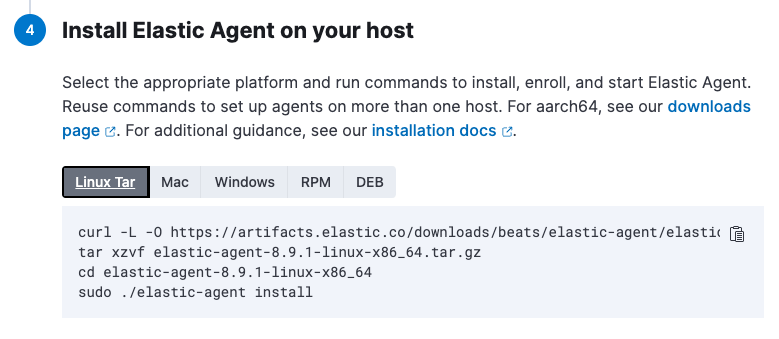 Note
NoteElastic Agent commands should be run as
root. You can prefix each agent command withsudoor you can start a new shell asrootby runningsudo su. If you need to run Elastic Agent commands withoutrootaccess, refer to Run Elastic Agent without administrative privileges.If you’re prompted with
Elastic Agent will be installed at {installation location} and will run as a service. Do you want to continue?answerYes.If you’re prompted with
Do you want to enroll this Agent into Fleet?answerno.You can run the
statuscommand to confirm that Elastic Agent is running.elastic-agent status ┌─ fleet │ └─ status: (STOPPED) Not enrolled into Fleet └─ elastic-agent └─ status: (HEALTHY) RunningSince you’re running the agent in standalone mode the
Not enrolled into Fleetmessage is expected.Open the
elastic-agent.ymlpolicy file that you saved.Near the top of the file, replace:
username: '${ES_USERNAME}'
password: '${ES_PASSWORD}'
with:
api_key: '<your-api-key>'where
your-api-keyis the API key that you generated in Step 3: Create an Elasticsearch API key.Find the location of the default
elastic-agent.ymlpolicy file that is included in your Elastic Agent install. Install directories for each platform are described in Installation layout. In our example Ubuntu image the default policy file can be found in/etc/elastic-agent/elastic-agent.yml.Replace the default policy file with the version that you downloaded and updated. For example:
cp /home/ubuntu/homedir/downloads/elastic-agent.yml /etc/elastic-agent/elastic-agent.ymlNoteYou may need to prefix the
cpcommand withsudofor the permission required to replace the default file.By default, Elastic Agent monitors the configuration file and reloads the configuration automatically when
elastic-agent.ymlis updated.Run the
statuscommand again, this time with the--output yamloption which provides structured and much more detailed output. See theelastic-agent statuscommand documentation for more details.elastic-agent status --output yamlThe results show you the agent status together with details about the running components, which correspond to the inputs and outputs defined for the integrations that have been added to the Elastic Agent policy, in this case the System and Nginx Integrations.
At the top of the command output, the
infosection contains details about the agent instance. Make a note of the agent ID. In this example the ID is4779b439-1130-4841-a878-e3d7d1a457d0. You’ll use that ID in the next section.elastic-agent status --output yaml info: id: 4779b439-1130-4841-a878-e3d7d1a457d0 version: 8.9.1 commit: 5640f50143410fe33b292c9f8b584117c7c8f188 build_time: 2023-08-10 17:04:04 +0000 UTC snapshot: false state: 2 message: Running
Now that Elastic Agent is running, it’s time to confirm that the agent data is flowing into Elasticsearch.
Check that Elastic Agent logs are flowing.
Open the Kibana menu and go to Observability → Discover.
In the KQL query bar, enter the query
agent.id : "{{agent-id}}"where{{agent-id}}is the ID you retrieved from theelastic-agent status --output yamlcommand. For example:agent.id : "4779b439-1130-4841-a878-e3d7d1a457d0".If Elastic Agent has connected successfully with your Elastic Cloud deployment, the agent logs should be flowing into Elasticsearch and visible in Kibana Discover.
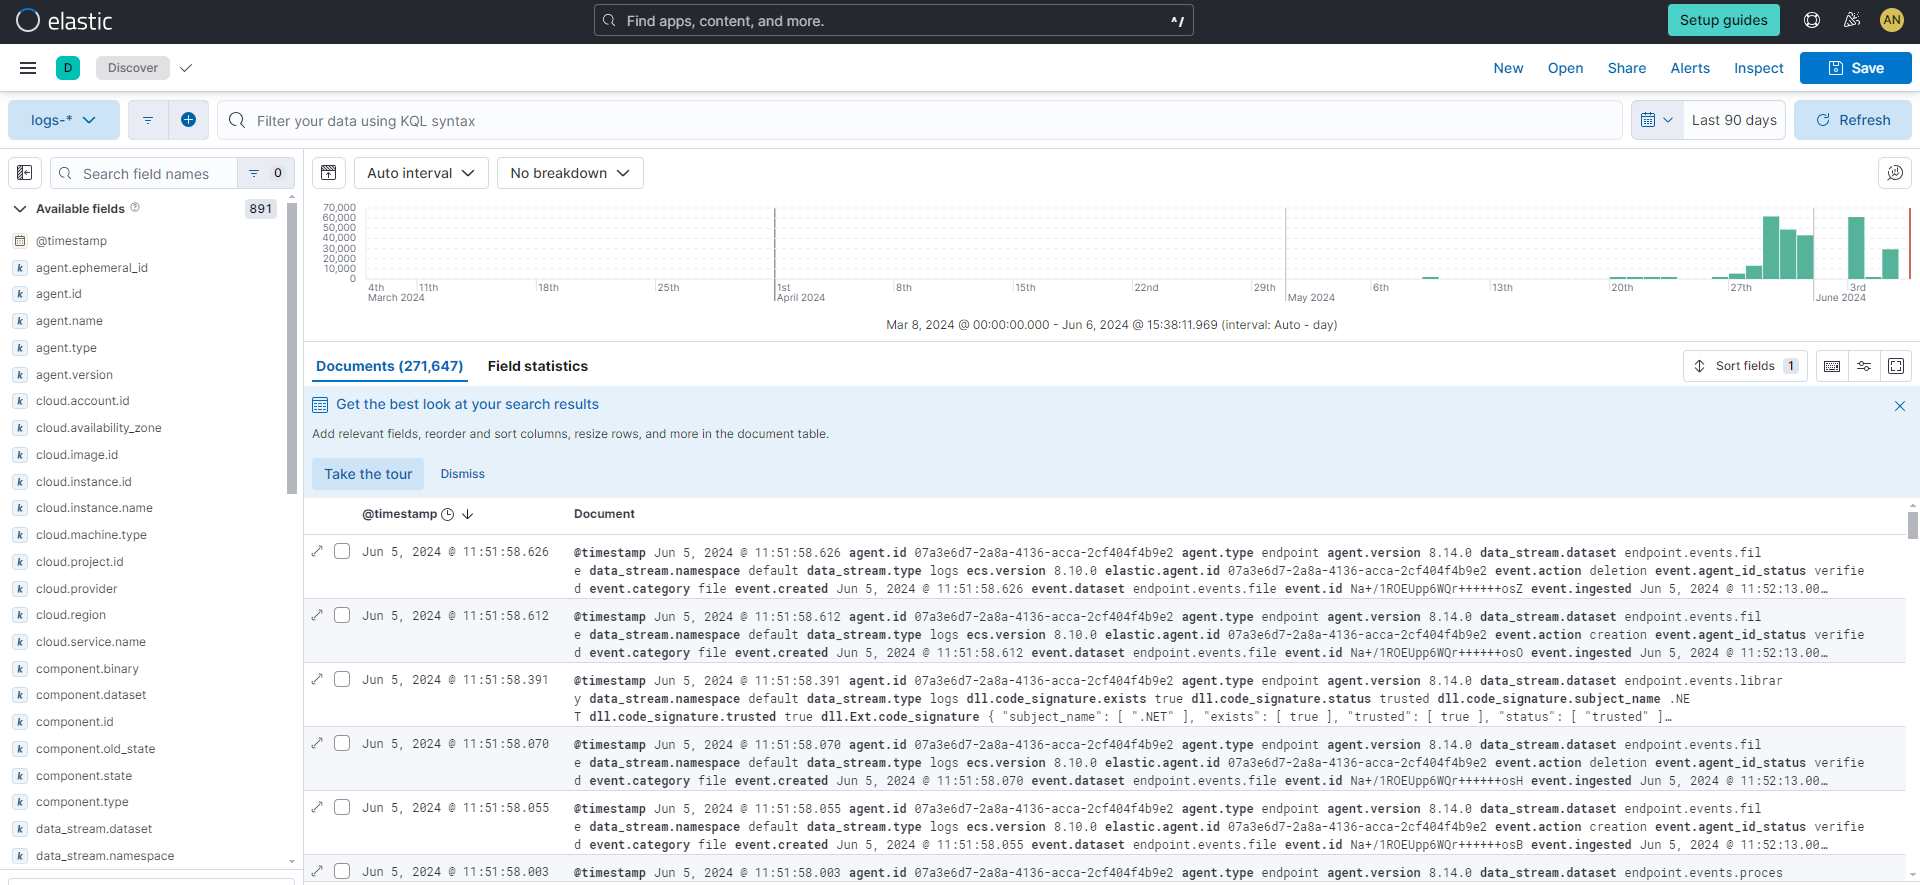
Check that Elastic Agent metrics are flowing.
Open the Kibana menu and go to Observability → Dashboards.
In the search field, search for
Elastic Agentand select[Elastic Agent] Agent metricsin the results.like the agent logs, the agent metrics should be flowing into Elasticsearch and visible in Kibana Dashboard. You can view metrics on CPU usage, memory usage, open handles, events rate, and more.
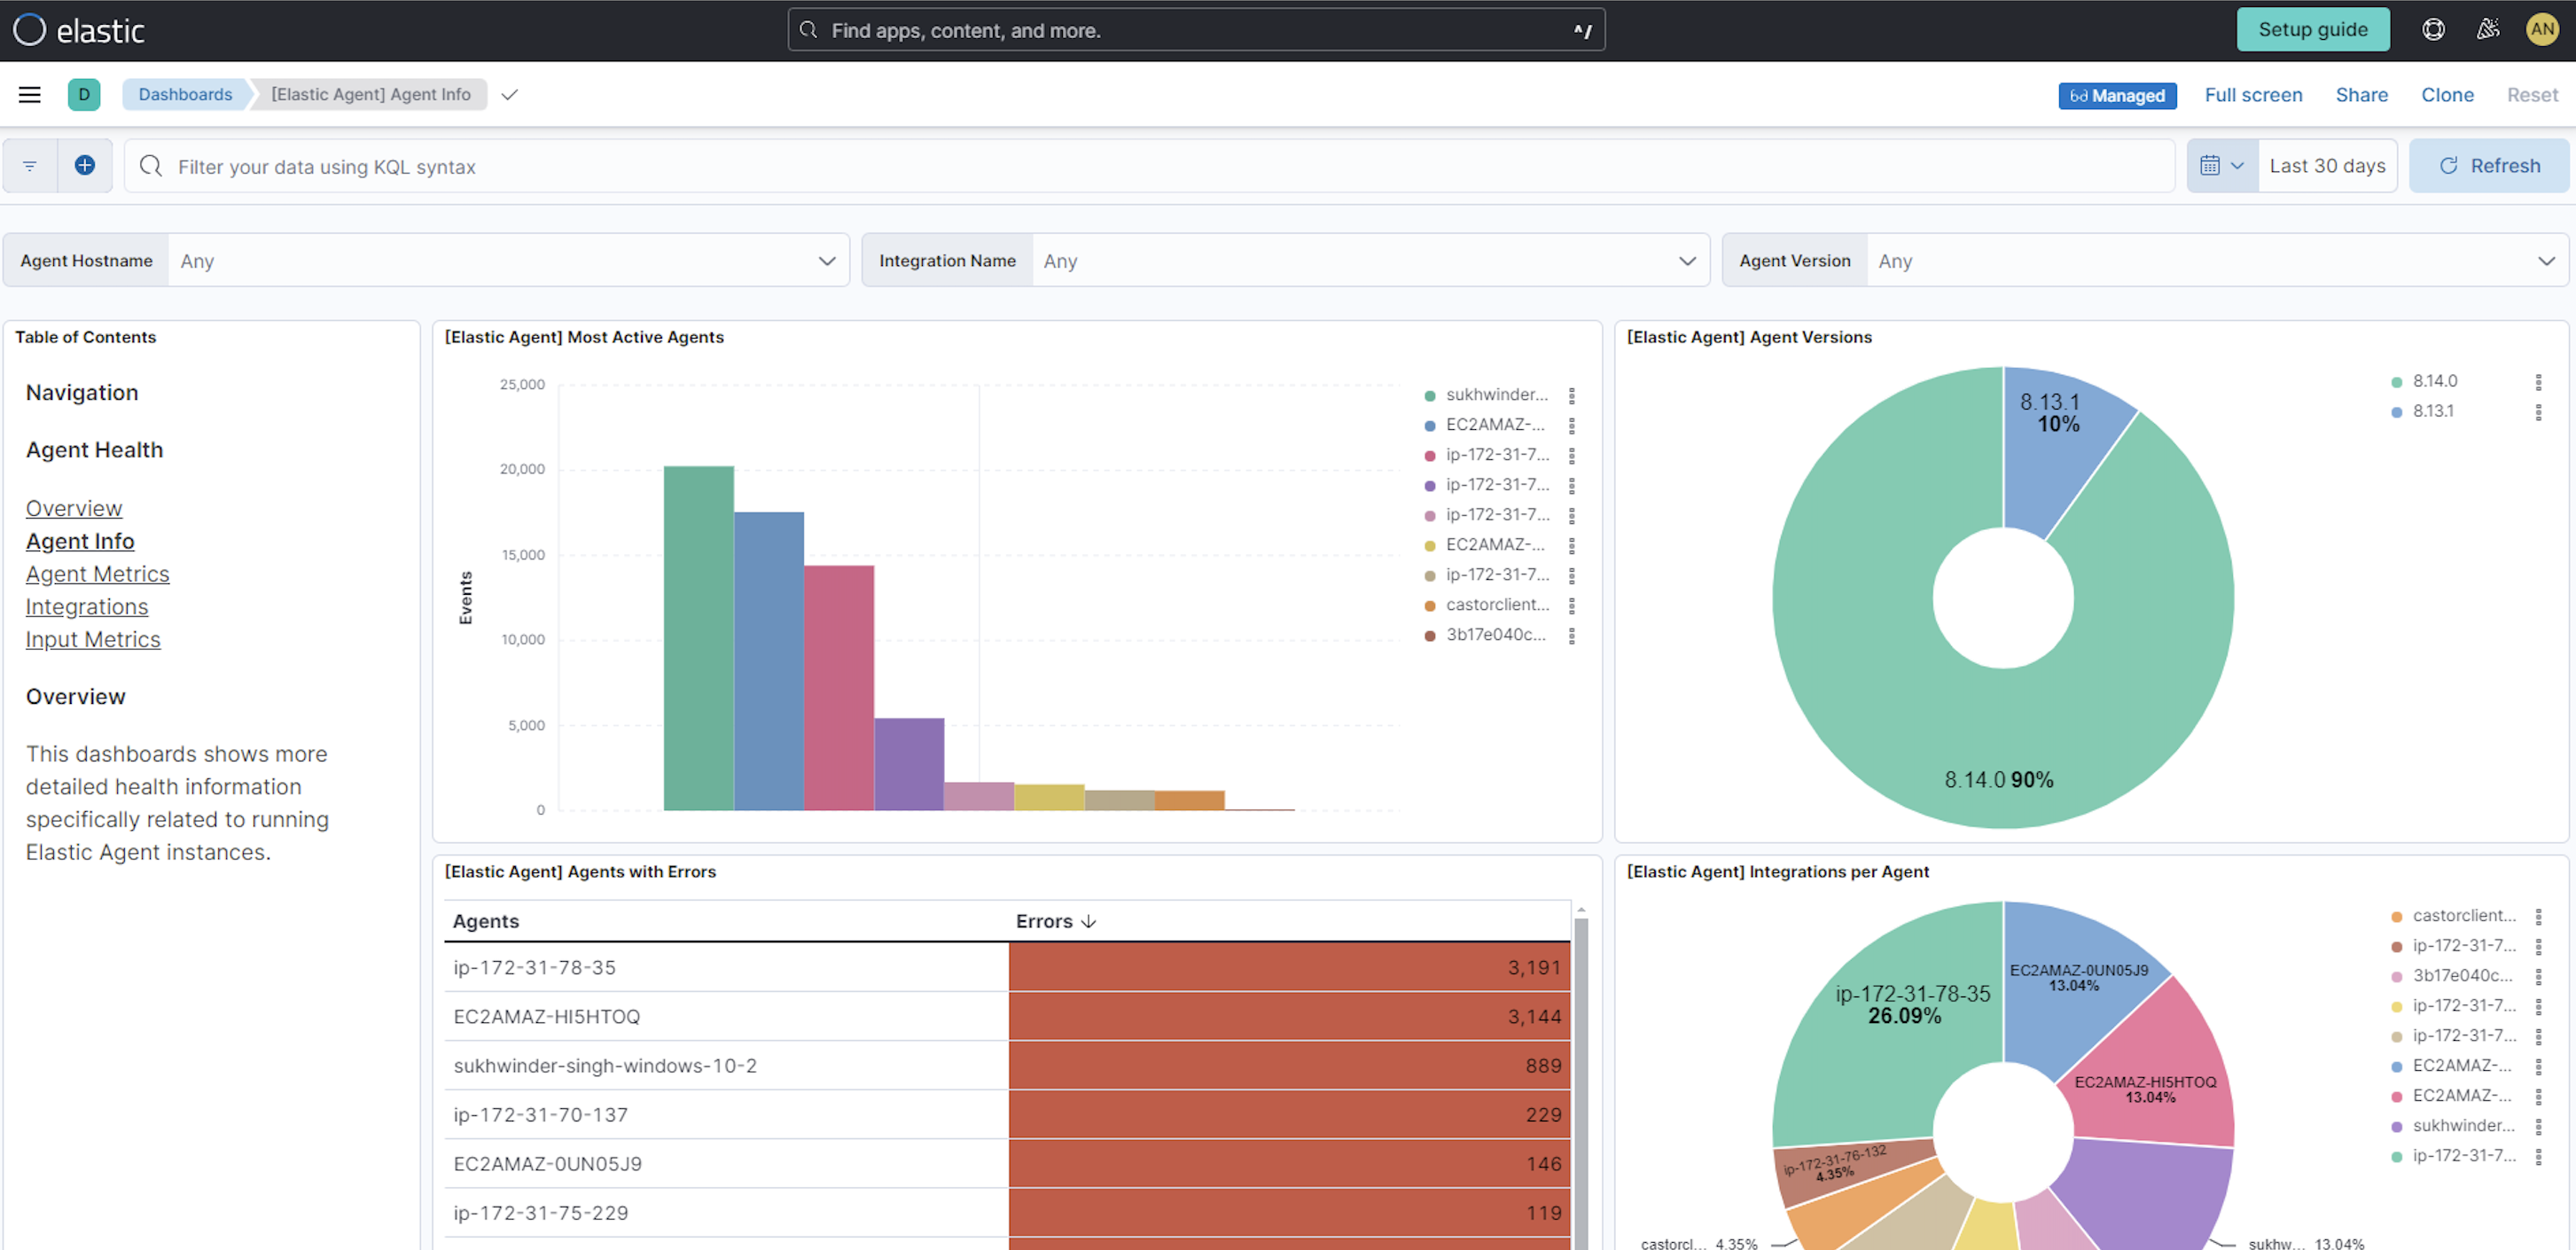
In the step to create an Elastic Agent policy you chose to collect system logs and metrics, so you can access those now.
View your system logs.
- Open the Kibana menu and go to Project settings → Integrations → Installed integrations.
- Select the System card and open the Assets tab. This is a quick way to access all of the dashboards, saved searches, and visualizations that come with each integration.
- Select
[Logs System] Syslog dashboard. - Select the calandar icon and change the time setting to
Today. The Kibana Dashboard shows visualizations of Syslog events, hostnames and processes, and more.
View your system metrics.
Return to Project settings → Integrations → Installed integrations.
Select the System card and open the Assets tab.
This time, select
[Metrics System] Host overview.Select the calandar icon and change the time setting to
Today. The Kibana Dashboard shows visualizations of host metrics including CPU usage, memory usage, running processes, and others.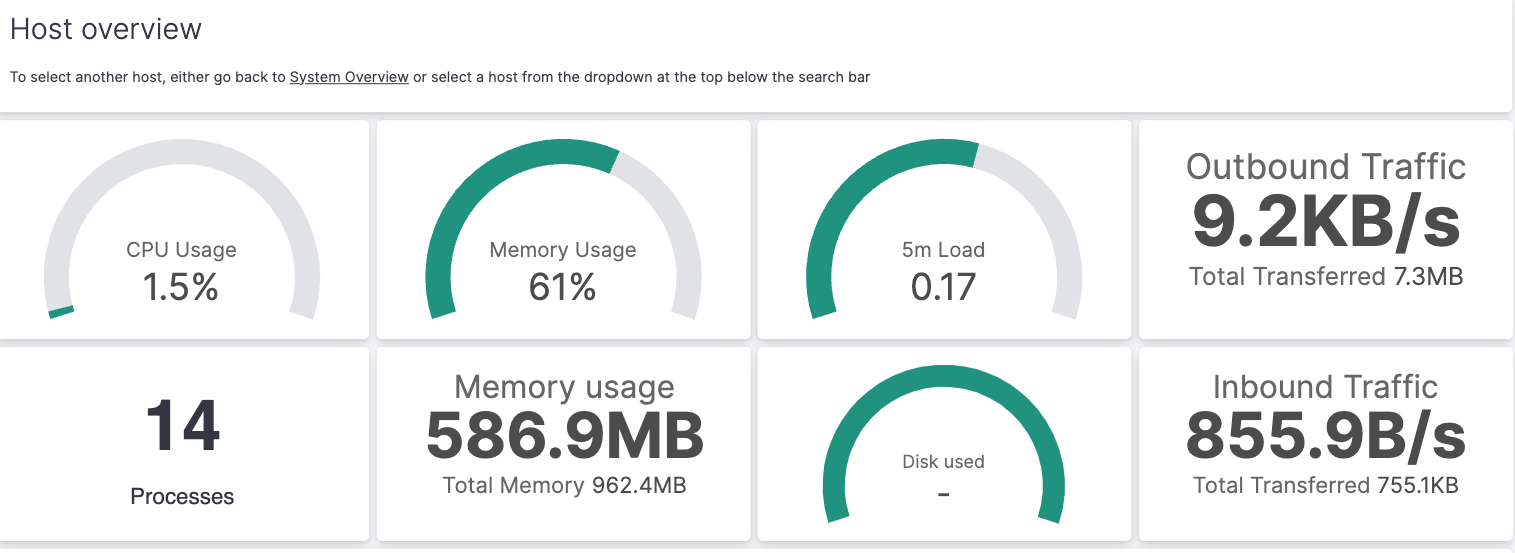
Now let’s view your nginx logging data.
Open the Kibana menu and go to Project settings → Integrations → Installed integrations.
Select the Nginx card and open the Assets tab.
Select
[Logs Nginx] Overview. The Kibana Dashboard opens with geographical log details, response codes and errors over time, top pages, and more.Refresh your nginx web page several times to update the logging data. You can also try accessing the nginx page from different web browsers. After a minute or so, the
Browsers breakdownvisualization shows the respective volume of requests from the different browser types.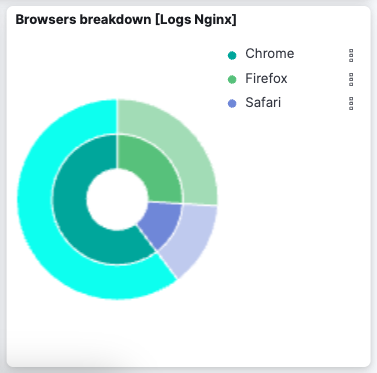
Congratulations! You have successfully set up monitoring for nginx using standalone Elastic Agent and an Elastic Cloud Serverless project.
- Learn more about Fleet and Elastic Agent.
- Learn more about Integrations.
- Learn how to manage your data lifecycle.