- Kibana Guide: other versions:
- What is Kibana?
- What’s new in 7.13
- Kibana concepts
- Quick start
- Set up
- Install Kibana
- Configure Kibana
- Alerting and action settings
- APM settings
- Banners settings
- Development tools settings
- Graph settings
- Fleet settings
- i18n settings
- Logging settings
- Logs settings
- Metrics settings
- Machine learning settings
- Monitoring settings
- Reporting settings
- Secure settings
- Search sessions settings
- Security settings
- Spaces settings
- Task Manager settings
- Telemetry settings
- URL drilldown settings
- Start and stop Kibana
- Access Kibana
- Securing access to Kibana
- Add data
- Upgrade Kibana
- Embed Kibana content in a web page
- Configure monitoring
- Configure security
- Production considerations
- Discover
- Dashboard
- Canvas
- Maps
- Machine learning
- Graph
- Alerting
- Observability
- APM
- Security
- Dev Tools
- Stack Monitoring
- Stack Management
- Fleet
- Reporting
- REST API
- Kibana plugins
- Accessibility
- Release notes
- Developer guide
IMPORTANT: No additional bug fixes or documentation updates
will be released for this version. For the latest information, see the
current release documentation.
Search geographic data
editSearch geographic data
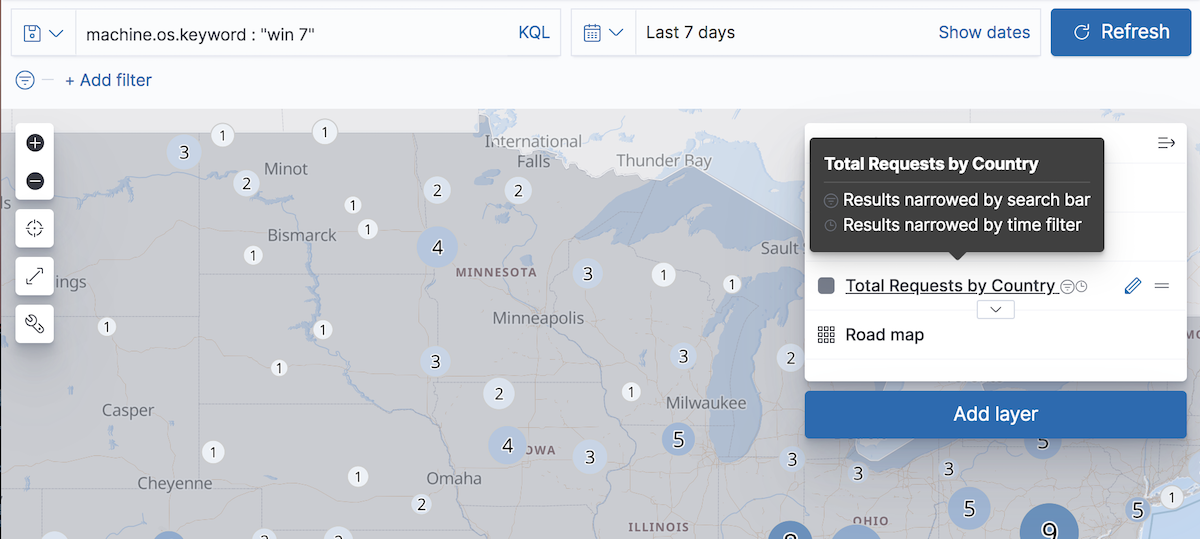
editSearch across the layers in your map to focus in on just the data you want.
Layers that request data from Elasticsearch are narrowed when you submit a search request.
Layers narrowed by semi-structured search and filters contain the filter icon ![]() next to the layer name in the legend.
next to the layer name in the legend.
Layers that request data from Elasticsearch using an index pattern with a configured time field are narrowed by the global time filter.
Layers narrowed by the time filter contain the clock icon ![]() next to the layer name in the legend.
next to the layer name in the legend.
You can create a layer that requests data from Elasticsearch from the following:
-
Vector layer with:
- Documents
- Clusters and grid
- Point to point
- Term join
- Top hits per entity
- Tracks
- Heat map layer
Was this helpful?
Thank you for your feedback.