Have you used the Kibana Dev Console? This is a fantastic prototyping tool that allows you to build and test your Elasticsearch requests interactively. But what do you do after you create and perfect a request in the Console?
In this article we'll take a look at the new code generation feature in the Kibana Dev Console, and how it can significantly reduce your development effort by generating ready to use code for you.
This feature is available in our Serverless platform and in Elastic Cloud and self-hosted releases 8.16 and up.
The Kibana Dev Console
This section provides a quick introduction to the Kibana Dev Console, in case you have never used it before. Skip to the next section if you are already familiar with it.
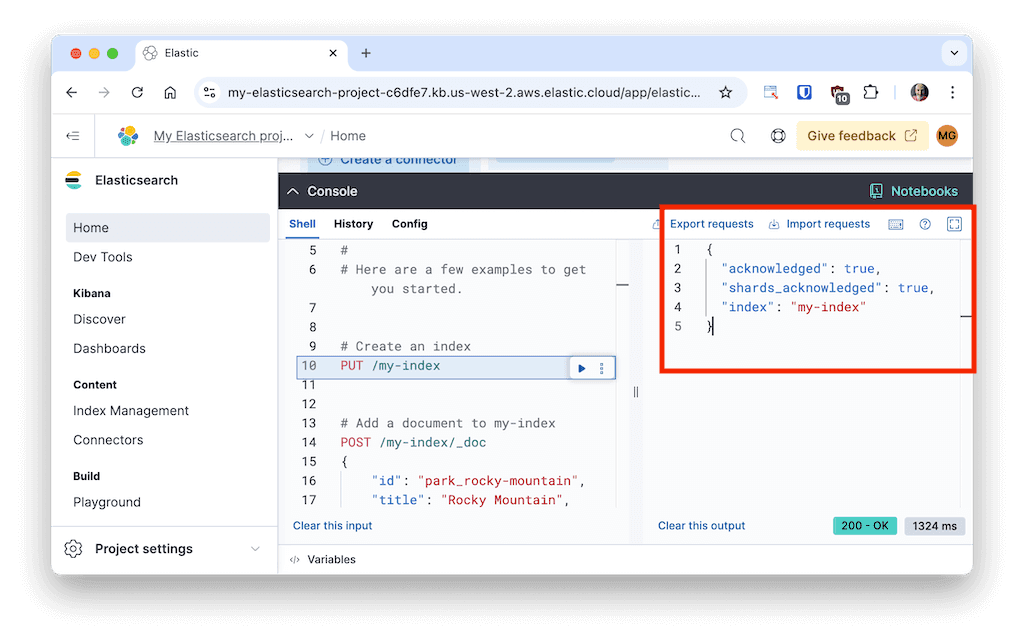
While you are in any part of the Search section in Kibana, you will notice a "Console" header at the bottom of your browser's page:

When you click this header, the Console expands to cover the page. Click it again to collapse it.
With the Dev Console open, you can enter Elasticsearch requests within an interactive editor in the left side panel. Some example requests are already pre-populated so that you have something to start experimenting with.
When a request is selected in the editor, a "play" button appears to its right. You can click this button to send the request to your Elasticsearch server.

After you execute a request, the response from the server appears in the panel on the right.

The interactive editor constantly checks the syntax of your requests and alerts you of any errors and provides autocompletion as you type. With these aids you can easily prototype your requests or queries until you get exactly what you want.
But what happens next? Read on to learn how to convert your requests to code that is ready to run or integrate with your application!
Code Export Feature
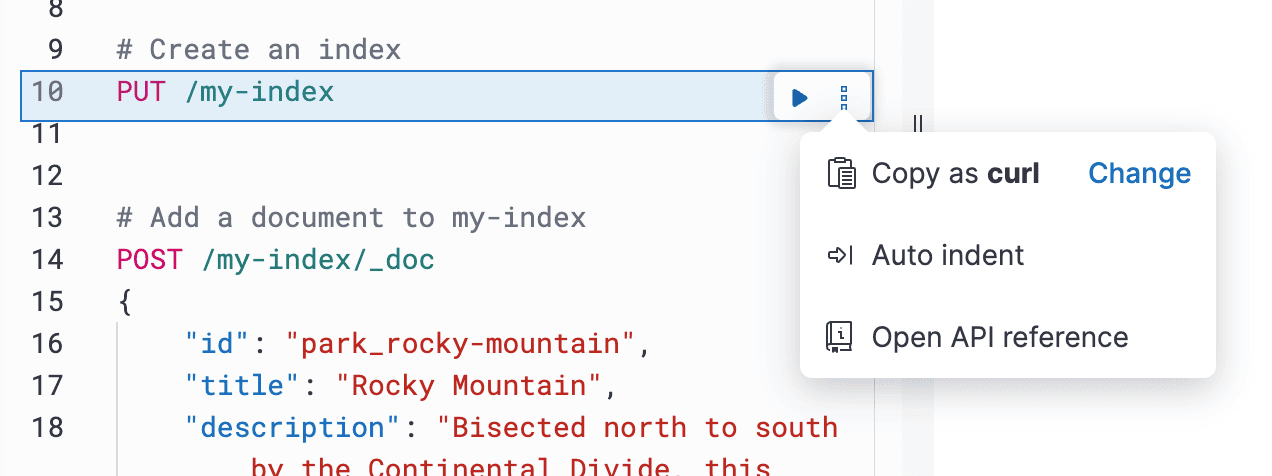
You can open a menu of options by clicking on the three dots (often called "kebab") button. The first option provides access to the code export feature. If you've never used this feature before, it will appear with a "Copy as curl" label.

If you select this option, your clipboard will be loaded with a curl command that is equivalent to the selected request.
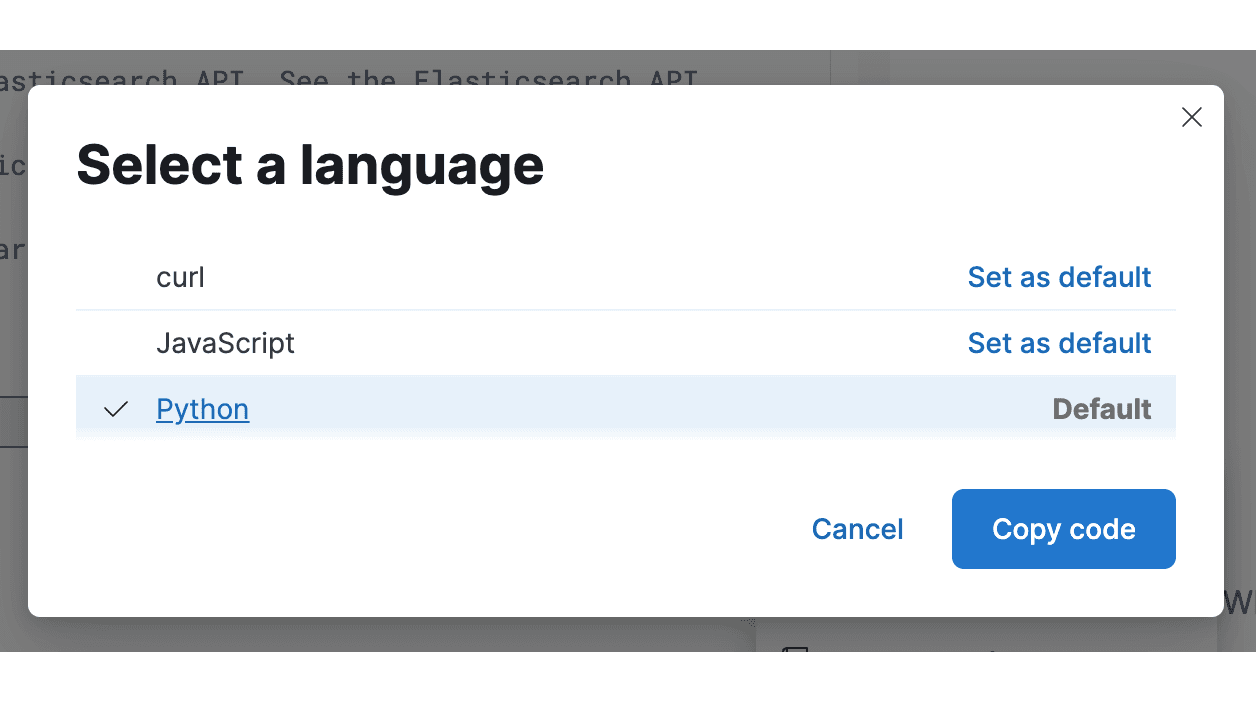
Now, things get more interesting when you click the "Change" button, which allows you to change the target language to generate code for. In this initial release, the code export supports Python and JavaScript. More languages are expected to be added in future releases.
You can now select your desired language and click "Copy code" to put the exported code in your clipboard. You can also change the default that is offered in the menu.

The exported code is a complete script in the selected language that is based on the official Elasticsearch client for that language. Here is an example of how the PUT /my-index request shown in a screenshot above looks when exported to the Python language:
import os
from elasticsearch import Elasticsearch

client = Elasticsearch(
    hosts=["<your-elasticsearch-endpoint-url-here"],
    api_key=os.getenv("ELASTIC_API_KEY"),
)

resp = client.indices.create(
    index="my-index",
)
print(resp)
To test the exported code you need three steps:
- Paste the code from the clipboard to a new file with the correct extension (
.pyfor Python, or.jsfor JavaScript). - In your terminal, add an environment variable called
ELASTIC_API_KEYwith a valid API Key. You can create an API key right in Kibana if you don't have one yet. - Execute the script with the
pythonornodecommands depending on your language.
Now you are ready to adapt the exported code as needed to integrate it into your application!
Ready to try this out on your own? Start a free trial.
Want to get Elastic certified? Find out when the next Elasticsearch Engineer training is running!


