Seamlessly connect with leading AI and machine learning platforms. Start a free cloud trial to explore Elastic’s gen AI capabilities or try it on your machine now.
This is the first in a series of blog posts discussing how to think about evaluating your own search systems in the context of better understanding the BEIR benchmark. We will introduce specific tips and techniques to improve your search evaluation processes in the context of better understanding BEIR. We will also introduce common gotchas which make evaluation less reliable. Finally, we note that LLMs provide a powerful new tool in the search engineers' arsenal and we will show by example how one can use them to help evaluate search.
Understanding the BEIR benchmark in search relevance evaluation
To improve any system you need to be able to measure how well it is doing. In the context of search BEIR (or equivalently the Retrieval section of the MTEB leaderboard) is considered the “holy grail” for the information retrieval community and there is no surprise in that. It’s a very well-structured benchmark with varied datasets across different tasks. More specifically, the following areas are covered:
- Argument retrieval (ArguAna, Touche2020)
- Open-domain QA (HotpotQA, Natural Questions, FiQA)
- Passage retrieval (MSMARCO)
- Duplicate question retrieval (Quora, CQADupstack)
- Fact-checking (FEVER, Climate-FEVER, Scifact)
- Biomedical information retrieval (TREC-COVID, NFCorpus, BioASQ)
- Entity retrieval (DBPedia)
- Citation prediction (SCIDOCS)
It provides a single statistic, nDCG@10, related to how well a system matches the most relevant documents for each task example in the top results it returns. For a search system that a human interacts with relevance of top results is critical. However, there are many nuances to evaluating search that a single summary statistic misses.
Structure of a BEIR dataset
Each benchmark has three artefacts:
- the corpus or documents to retrieve
- the queries
- the relevance judgements for the queries (aka
qrels).
Relevance judgments are provided as a score which is zero or greater. Non-zero scores indicate that the document is somewhat related to the query.
| Dataset | Corpus size | #Queries in the test set | #qrels positively labeled | #qrels equal to zero | #duplicates in the corpus |
|---|---|---|---|---|---|
| Arguana | 8,674 | 1,406 | 1,406 | 0 | 96 |
| Climate-FEVER | 5,416,593 | 1,535 | 4,681 | 0 | 0 |
| DBPedia | 4,635,922 | 400 | 15,286 | 28,229 | 0 |
| FEVER | 5,416,568 | 6,666 | 7,937 | 0 | 0 |
| FiQA-2018 | 57,638 | 648 | 1,706 | 0 | 0 |
| HotpotQA | 5,233,329 | 7,405 | 14,810 | 0 | 0 |
| Natural Questions | 2,681,468 | 3,452 | 4,021 | 0 | 16,781 |
| NFCorpus | 3,633 | 323 | 12,334 | 0 | 80 |
| Quora | 522,931 | 10,000 | 15,675 | 0 | 1,092 |
| SCIDOCS | 25,657 | 1,000 | 4,928 | 25,000 | 2 |
| Scifact | 5,183 | 300 | 339 | 0 | 0 |
| Touche2020 | 382,545 | 49 | 932 | 1,982 | 5,357 |
| TREC-COVID | 171,332 | 50 | 24,763 | 41,663 | 0 |
| MSMARCO | 8,841,823 | 6,980 | 7,437 | 0 | 324 |
| CQADupstack (sum) | 457,199 | 13,145 | 23,703 | 0 | 0 |
Table 1: Dataset statistics. The numbers were calculated on the test portion of the datasets (dev for MSMARCO).
Table 1 presents some statistics for the datasets that comprise the BEIR benchmark such as the number of documents in the corpus, the number of queries in the test dataset and the number of positive/negative (query, doc) pairs in the qrels file. From a quick a look in the data we can immediately infer the following:
- Most of the datasets do not contain any negative relationships in the
qrelsfile, i.e. zero scores, which would explicitly denote documents as irrelevant to the given query. - The average number of document relationships per query (
#qrels/#queries) varies from 1.0 in the case ofArguAnato 493.5 (TREC-COVID) but with a value<5 for the majority of the cases. - Some datasets suffer from duplicate documents in the corpus which in some cases may lead to incorrect evaluation i.e. when a document is considered relevant to a query but its duplicate is not. For example, in
ArguAnawe have identified 96 cases of duplicate doc pairs with only one doc per pair being marked as relevant to a query. By “expanding” the initial qrels list to also include the duplicates we have observed a relative increase of ~1% in thenDCG@10score on average.
Example of duplicate pairs in ArguAna. In the qrels file only the first appears to be relevant (as counter-argument) to query (“test-economy-epiasghbf-pro02a”)
When comparing models on the MTEB leaderboard it is tempting to focus on average retrieval quality. This is a good proxy to the overall quality of the model, but it doesn't necessarily tell you how it will perform for you. Since results are reported per data set, it is worth understanding how closely the different data sets relate to your search task and rescore models using only the most relevant ones. If you want to dig deeper, you can additionally check for topic overlap with the various data set corpuses. Stratifying quality measures by topic gives a much finer-grained assessment of their specific strengths and weaknesses.
One important note here is that when a document is not marked in the qrels file then by default it is considered irrelevant to the query. We dive a little further into this area and collect some evidence to shed more light on the following question: “How often is an evaluator presented with (query, document) pairs for which there is no ground truth information?". The reason that this is important is that when only shallow markup is available (and thus not every relevant document is labeled as such) one Information Retrieval system can be judged worse than another just because it “chooses” to surface different relevant (but unmarked) documents. This is a common gotcha in creating high quality evaluation sets, particularly for large datasets. To be feasible manual labelling usually focuses on top results returned by the current system, so potentially misses relevant documents in its blind spots. Therefore, it is usually preferable to focus more resources on fuller mark up of fewer queries than broad shallow markup.
Leveraging the BEIR benchmark for search relevance evaluation
To initiate our analysis we implement the following scenario (see the notebook):
- First, we load the corpus of each dataset into an Elasticsearch index.
- For each query in the test set we retrieve the top-100 documents with BM25.
- We rerank, the retrieved documents using a variety of SOTA reranking models.
- Finally, we report the “judge rate” for the top-10 documents coming from steps 2 (after retrieval) and 3 (after reranking). In other words, we calculate the average percentage of the top-10 documents that have a score in the
qrelsfile.
The list of reranking of models we used is the following:
- Cohere's
rerank-english-v2.0andrerank-english-v3.0 - BGE-base
- mxbai-rerank-xsmall-v1
- MiniLM-L-6-v2
| Retrieval | Reranking | |||||
|---|---|---|---|---|---|---|
| Dataset | BM25 (%) | Cohere Rerank v2 (%) | Cohere Rerank v3 (%) | BGE-base (%) | mxbai-rerank-xsmall-v1 (%) | MiniLM-L-6-v2 (%) |
| Arguana | 7.54 | 4.87 | 7.87 | 4.52 | 4.53 | 6.84 |
| Climate-FEVER | 5.75 | 6.24 | 8.15 | 9.36 | 7.79 | 7.58 |
| DBPedia | 61.18 | 60.78 | 64.15 | 63.9 | 63.5 | 67.62 |
| FEVER | 8.89 | 9.97 | 10.08 | 10.19 | 9.88 | 9.88 |
| FiQa-2018 | 7.02 | 11.02 | 10.77 | 8.43 | 9.1 | 9.44 |
| HotpotQA | 12.59 | 14.5 | 14.76 | 15.1 | 14.02 | 14.42 |
| Natural Questions | 5.94 | 8.84 | 8.71 | 8.37 | 8.14 | 8.34 |
| NFCorpus | 31.67 | 32.9 | 33.91 | 30.63 | 32.77 | 32.45 |
| Quora | 12.2 | 10.46 | 13.04 | 11.26 | 12.58 | 12.78 |
| SCIDOCS | 8.62 | 9.41 | 9.71 | 8.04 | 8.79 | 8.52 |
| Scifact | 9.07 | 9.57 | 9.77 | 9.3 | 9.1 | 9.17 |
| Touche2020 | 38.78 | 30.41 | 32.24 | 33.06 | 37.96 | 33.67 |
| TREC-COVID | 92.4 | 98.4 | 98.2 | 93.8 | 99.6 | 97.4 |
| MSMARCO | 3.97 | 6.00 | 6.03 | 6.07 | 5.47 | 6.11 |
| CQADupstack (avg.) | 5.47 | 6.32 | 6.87 | 5.89 | 6.22 | 6.16 |
Table 2: Judge rate per (dataset, reranker) pairs calculated on the top-10 retrieved/reranked documents
From Table 2, with the exception of TREC-COVID (>90% coverage), DBPedia (~65%), Touche2020 and nfcorpus (~35%), we see that the majority of the datasets have a labeling rate between 5% and a little more than 10% after retrieval or reranking. This doesn’t mean that all these unmarked documents are relevant but there might be a subset of them -especially those placed in the top positions- that could be positive.
With the arrival of general purpose instruction tuned language models, we have a new powerful tool which can potentially automate judging relevance. These methods are typically far too computationally expensive to be used online for search, but here we are concerned with offline evaluation. In the following we use them to explore the evidence that some of the BEIR datasets suffer from shallow markup.
In order to further investigate this hypothesis we decided to focus on MSMARCO and select a subset of 100 queries along with the top-5 reranked (with Cohere v2) documents which are currently not marked as relevant. We followed two different paths of evaluation: First, we used a carefully tuned prompt (more on this in a later post) to prime the recently released Phi-3-mini-4k model to predict the relevance (or not) of a document to the query. In parallel, these cases were also manually labeled in order to also assess the agreement rate between the LLM output and human judgment. Overall, we can draw the following two conclusions:
- The agreement rate between the LLM responses and human judgments was close to 80% which seems good enough as a starting point in that direction.
- In 57.6% of the cases (based on human judgment) the returned documents were found to be actually relevant to the query. To state this in a different way: For 100 queries we have 107 documents judged to be relevant, but at least 0.576 x 5 x 100 = 288 extra documents which are actually relevant!
Here, some examples drawn from the MSMARCO/dev dataset which contain the query, the annotated positive document (from qrels) and a false negative document due to incomplete markup:
Example 1:
Example 2:
Manually evaluating specific queries like this is a generally useful technique for understanding search quality that complements quantitive measures like nDCG@10. If you have a representative set of queries you always run when you make changes to search, it gives you important qualitative information about how performance changes, which is invisible in the statistics. For example, it gives you much more insight into the false results your search returns: it can help you spot obvious howlers in retrieved results, classes of related mistakes, such as misinterpreting domain-specific terminology, and so on.
Our result is in agreement with relevant research around MSMARCO evaluation. For example, Arabzadeh et al. follow a similar procedure where they employ crowdsourced workers to make preference judgments: among other things, they show that in many cases the documents returned by the reranking modules are preferred compared to the documents in the MSMARCO qrels file. Another piece of evidence comes from the authors of the RocketQA reranker who report that more than 70% of the reranked documents were found relevant after manual inspection.
Update - September 9th: After a careful re-evaluation of the dataset we identified 15 more cases of relevant documents, increasing their total number from 273 to 288
Main takeaways & next steps
- The pursuit for better ground truth is never-ending as it is very crucial for benchmarking and model comparison. LLMs can assist in some evaluation areas if used with caution and tuned with proper instructions
- More generally, given that benchmarks will never be perfect, it might be preferable to switch from a pure score comparison to more robust techniques capturing statistically significant differences. The work of Arabzadeh et al. provides a nice of example of this where based on their findings they build 95% confidence intervals indicating significant (or not) differences between the various runs. In the accompanying notebook we provide an implementation of confidence intervals using bootstrapping.
- From the end-user perspective it’s useful to think about task alignment when reading benchmark results. For example, for an AI engineer who builds a RAG pipeline and knows that the most typical use case involves assembling multiple pieces of information from different sources, then it would be more meaningful to assess the performance of their retrieval model on multi-hop QA datasets like HotpotQA instead of the global average across the whole BEIR benchmark
In the next blog post we will dive deeper into the use of Phi-3 as LLM judge and the journey of tuning it to predict relevance.
Frequently Asked Questions
What is the BEIR benchmark?
BEIR is a well-structured benchmark with varied datasets across different tasks. It covers these areas: open-domain QA, passage retrieval, fact-checking, biomedical retrieval, and more. It provides a standard for evaluating search relevance.
What is nDCG and what is it used for?
NDCG (Normalized Discounted Cumulative Gain) is a metric that evaluates the quality of search engine rankings by measuring how well the order of results reflects their relevance.
Related Content

56% faster, up to 50% better retrieval performance: What's inside Jina's new 600 million parameter listwise reranker
Jina Reranker 3.5 beats v3 by 50%+ on case law, closes the gap with models 7x its size on legal, medical, and financial benchmarks, and beats them outright on structured data. It's a drop-in replacement for v3, with no API changes.

How to instrument your search API with OpenTelemetry and query it with ES|QL
Add custom attributes to OpenTelemetry spans and run six ES|QL queries that reveal your top searches, zero-result rate and slowest queries.
July 10, 2026
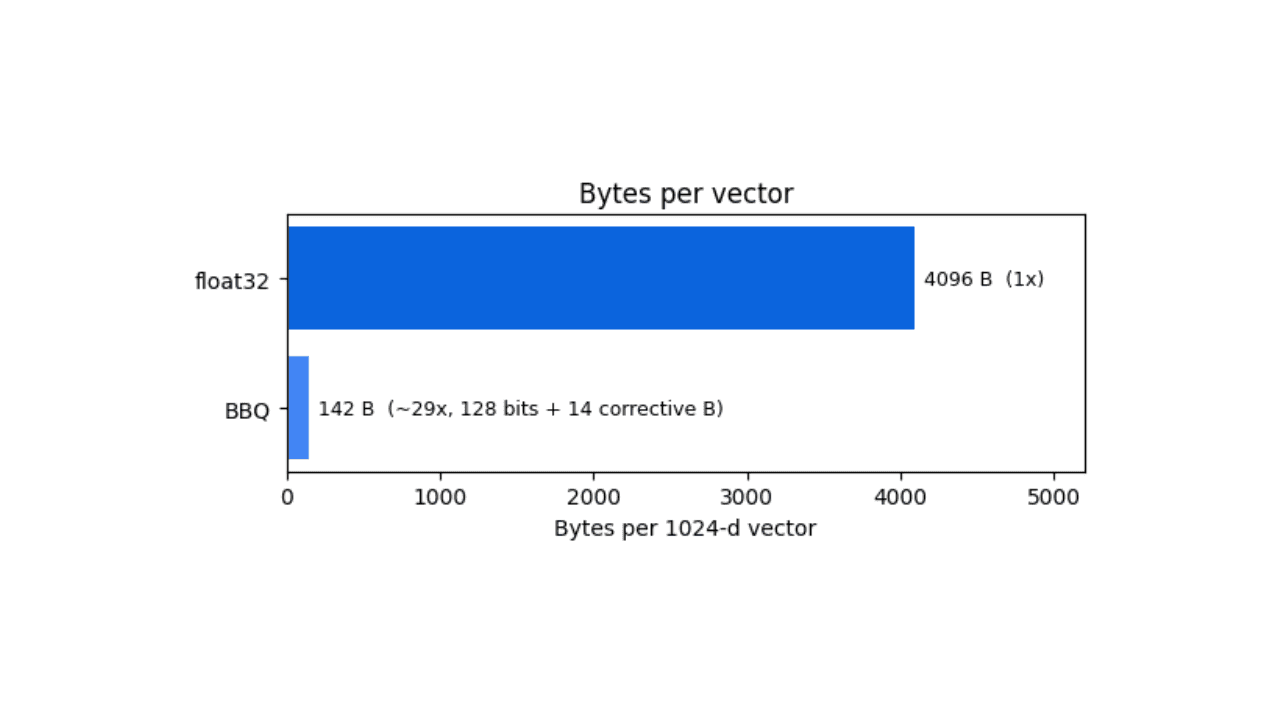
How BBQ shrinks Jina v5 embeddings by 29x without losing recall in Elasticsearch
A hands-on test comparing BBQ and float32 vector indices in Elasticsearch, measuring memory, disk and recall@10 across five languages.
July 21, 2026
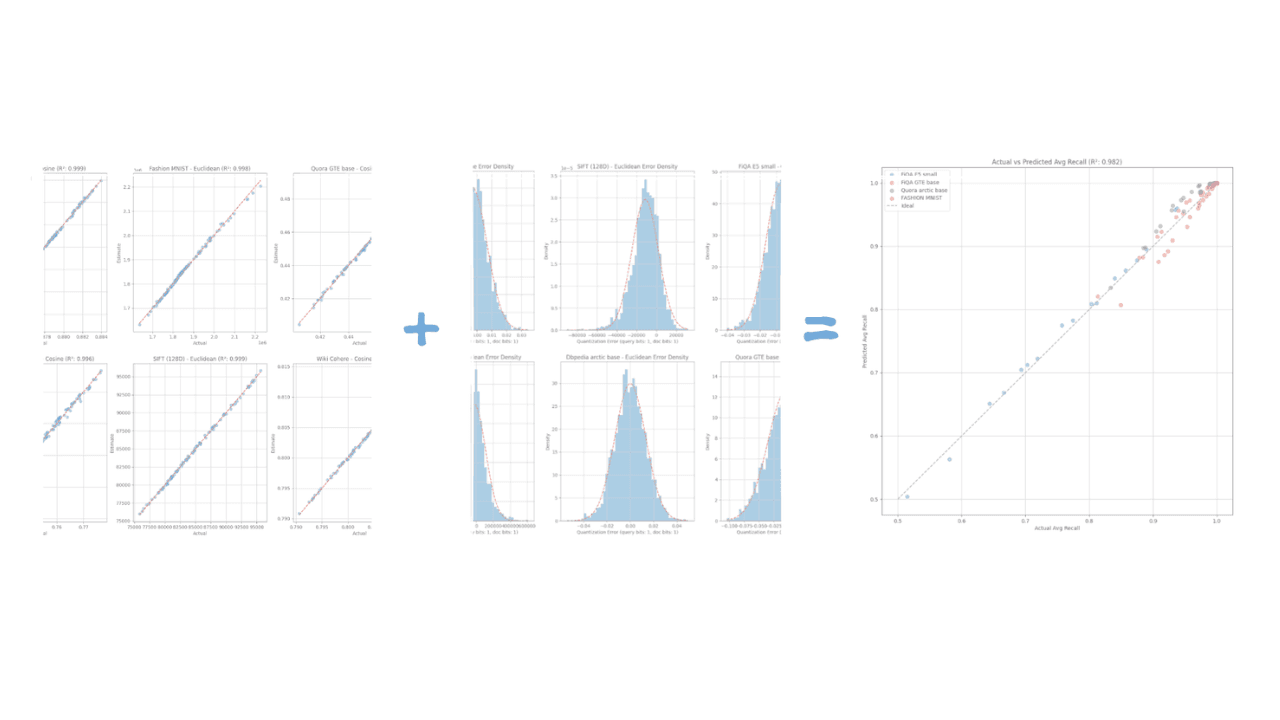
How Elasticsearch auto-tunes vector quantization to hit your recall target
Learn the geometric model that lets Elasticsearch predict recall with R² > 0.98 accuracy and auto-select vector quantization parameters from a small data sample.
June 24, 2026
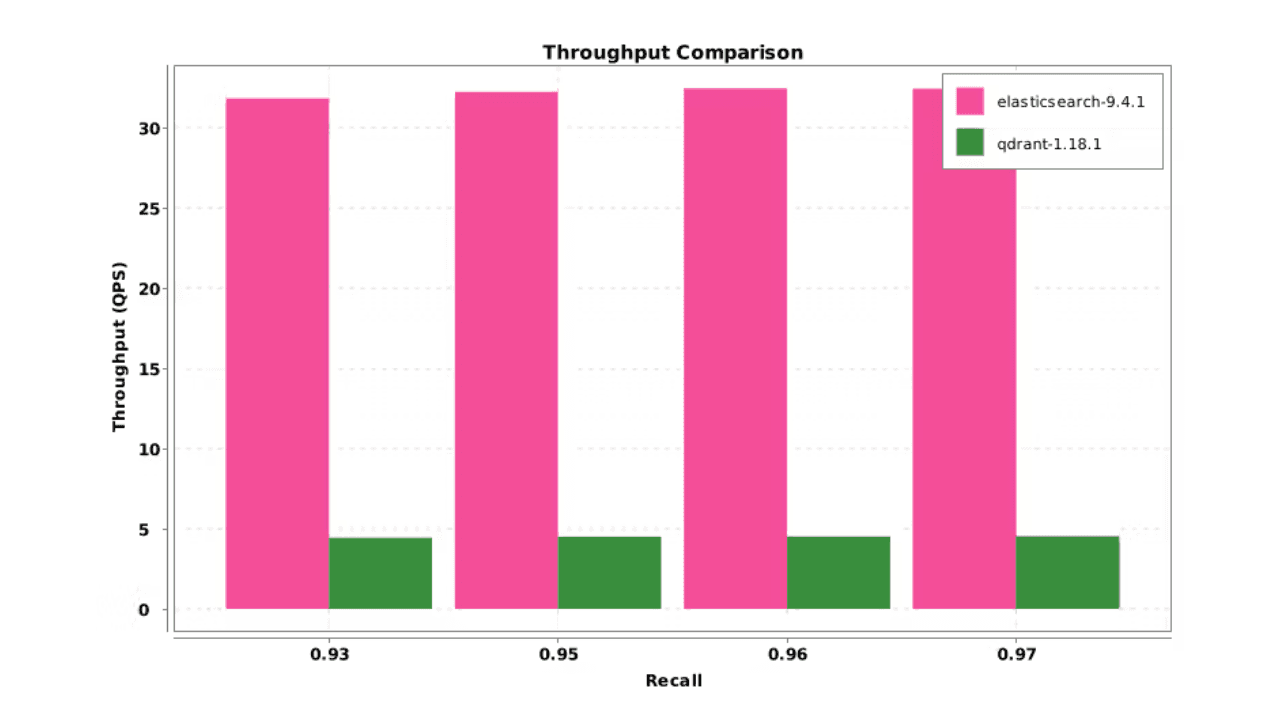
Elasticsearch DiskBBQ delivers 7x faster vector search than Qdrant on network-attached storage
Elasticsearch DiskBBQ achieves up to 7x higher vector search throughput than Qdrant at comparable recall on network-attached storage. Explore the benchmark methodology and full results.