
Metricbeat
Lightweight shipper for metrics
Collect metrics from your systems and services. From CPU to memory, Redis to NGINX, and much more, Metricbeat is a lightweight way to send system and service statistics.
System-level monitoring, simplified
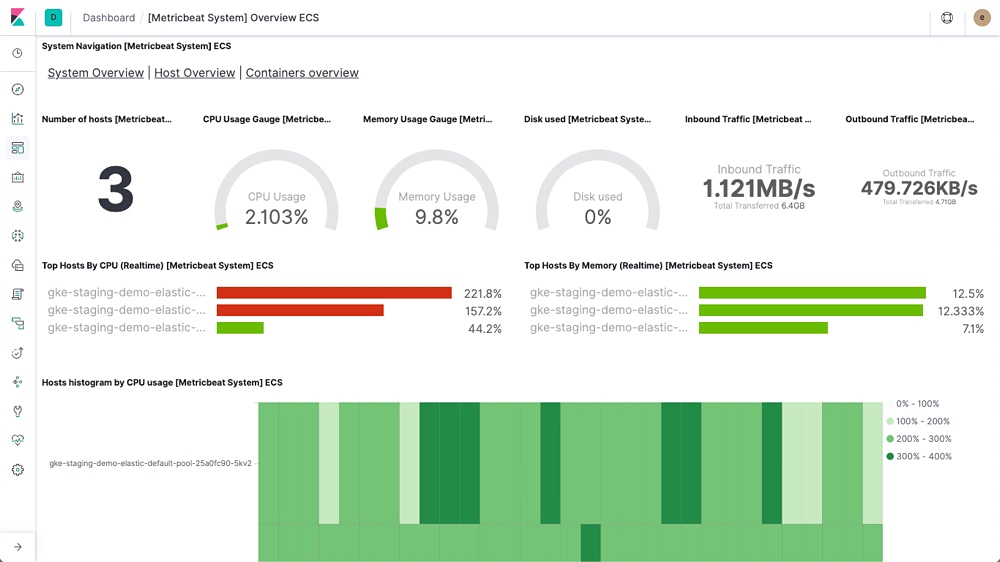
Deploy Metricbeat on all your Linux, Windows, and Mac hosts, connect it to Elasticsearch and voila: you get system-level CPU usage, memory, file system, disk IO, and network IO statistics, as well as top-like statistics for every process running on your systems. Explore the live demo.

One binary, lots of modules
Metricbeat comes with internal modules that collect metrics from services like Apache, Jolokia, NGINX, MongoDB, MySQL, PostgreSQL, Prometheus, and more. Installation is easy, requiring absolutely zero dependencies. Just enable the modules you want in the configuration file.
And if you don't see the module you're looking for, build your own. Written in Go, creating a new Metricbeat module is simple.

It’s container-ready
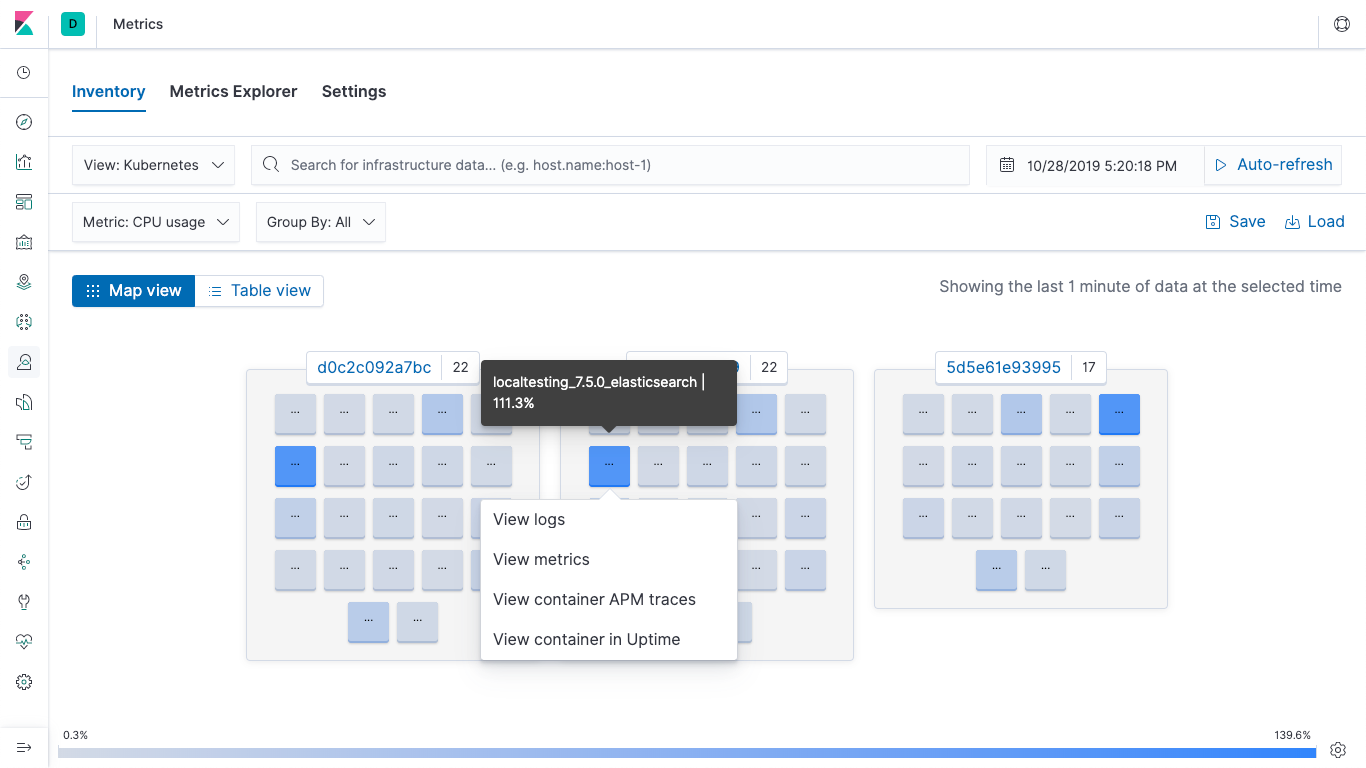
Are you moving everything inside Docker these days? Container monitoring is simple with the Elastic Stack. Deploy Metricbeat in a separate container on the same host and it will gather statistics about every other container running on the host. It does this by directly reading the cgroups information from the proc file system, which means that it doesn’t need privileged access to the Docker API and works for other runtimes as well. Autodiscovery for Docker simplifies things further, letting you specify a condition for turning on Metricbeat modules.
It doesn't miss a beat
Spool your metrics to disk so your pipeline doesn't skip a data point — even when interruptions such as network issues occur. Metricbeat holds onto incoming data and then ships those metrics to Elasticsearch or Logstash when things are back online.
Ship to Elasticsearch or Logstash. Visualize in Kibana.
Metricbeat is part of the Elastic Stack, meaning it works seamlessly with Logstash, Elasticsearch, and Kibana. Whether you want to transform or enrich your metrics with Logstash, fiddle with some analytics in Elasticsearch, or build and share dashboards in Kibana, Metricbeat makes it easy to ship your data to where it matters most.


