Unleash the power of Elastic and Amazon Kinesis Data Firehose to enhance observability and data analytics

As more organizations leverage the Amazon Web Services (AWS) cloud platform and services to drive operational efficiency and bring products to market, managing logs becomes a critical component of maintaining visibility and safeguarding multi-account AWS environments. Traditionally, logs are stored in Amazon Simple Storage Service (Amazon S3) and then shipped to an external monitoring and analysis solution for further processing.
To simplify this process and reduce management overhead, AWS users can now leverage the new Amazon Kinesis Firehose Delivery Stream to ingest logs into Elastic Cloud in AWS in real time and view them in the Elastic Stack alongside other logs for centralized analytics. This eliminates the necessity for time-consuming and expensive procedures such as VM provisioning or data shipper operations.
Elastic Observability unifies logs, metrics, and application performance monitoring (APM) traces for a full contextual view across your hybrid AWS environments alongside their on-premises data sets. Elastic Observability enables you to track and monitor performance across a broad range of AWS services, including AWS Lambda, Amazon Elastic Compute Cloud (EC2), Amazon Elastic Container Service (ECS), Amazon Elastic Kubernetes Service (EKS), Amazon Simple Storage Service (S3), Amazon Cloudtrail, Amazon Network Firewall, and more.
In this blog, we will walk you through how to use the Amazon Kinesis Data Firehose integration — Elastic is listed in the Amazon Kinesis Firehose drop-down list — to simplify your architecture and send logs to Elastic, so you can monitor and safeguard your multi-account AWS environments.
Announcing the Kinesis Firehose method
Elastic currently provides both agent-based and serverless mechanisms, and we are pleased to announce the addition of the Kinesis Firehose method. This new method enables customers to directly ingest logs from AWS into Elastic, supplementing our existing options.
- Elastic Agent pulls metrics and logs from CloudWatch and S3 where logs are generally pushed from a service (for example, EC2, ELB, WAF, Route53) and ingests them into Elastic Cloud.
- Elastic’s Serverless Forwarder (runs Lambda and available in AWS SAR) sends logs from Kinesis Data Stream, Amazon S3, and AWS Cloudwatch log groups into Elastic. To learn more about this topic, please see this blog post.
- Amazon Kinesis Firehose directly ingests logs from AWS into Elastic (specifically, if you are running the Elastic Cloud on AWS).
In this blog, we will cover the last option since we have recently released the Amazon Kinesis Data Firehose integration. Specifically, we'll review:
- A general overview of the Amazon Kinesis Data Firehose integration and how it works with AWS
- Step-by-step instructions to set up the Amazon Kinesis Data Firehose integration on AWS and on Elastic Cloud
By the end of this blog, you'll be equipped with the knowledge and tools to simplify your AWS log management with Elastic Observability and Amazon Kinesis Data Firehose.
Prerequisites and configurations
If you intend to follow the steps outlined in this blog post, there are a few prerequisites and configurations that you should have in place beforehand.
- You will need an account on Elastic Cloud and a deployed stack on AWS. Instructions for deploying a stack on AWS can be found here. This is necessary for AWS Firehose Log ingestion.
- You will also need an AWS account with the necessary permissions to pull data from AWS. Details on the required permissions can be found in our documentation.
- Finally, be sure to turn on VPC Flow Logs for the VPC where your application is deployed and send them to AWS Firehose.
Elastic’s Amazon Kinesis Data Firehose integration
Elastic has collaborated with AWS to offer a seamless integration of Amazon Kinesis Data Firehose with Elastic, enabling direct ingestion of data from Amazon Kinesis Data Firehose into Elastic without the need for Agents or Beats. All you need to do is configure the Amazon Kinesis Data Firehose delivery stream to send its data to Elastic's endpoint. In this configuration, we will demonstrate how to ingest VPC Flow logs and Firewall logs into Elastic. You can follow a similar process to ingest other logs from your AWS environment into Elastic.
There are three distinct configurations available for ingesting VPC Flow and Network firewall logs into Elastic. One configuration involves sending logs through CloudWatch, and another uses S3 and Kinesis Firehose; each has its own unique setup. With Cloudwatch and S3 you can store and forward but with Kinesis Firehose you will have to ingest immediately. However, in this blog post, we will focus on this new configuration that involves sending VPC Flow logs and Network Firewall logs directly to Elastic.
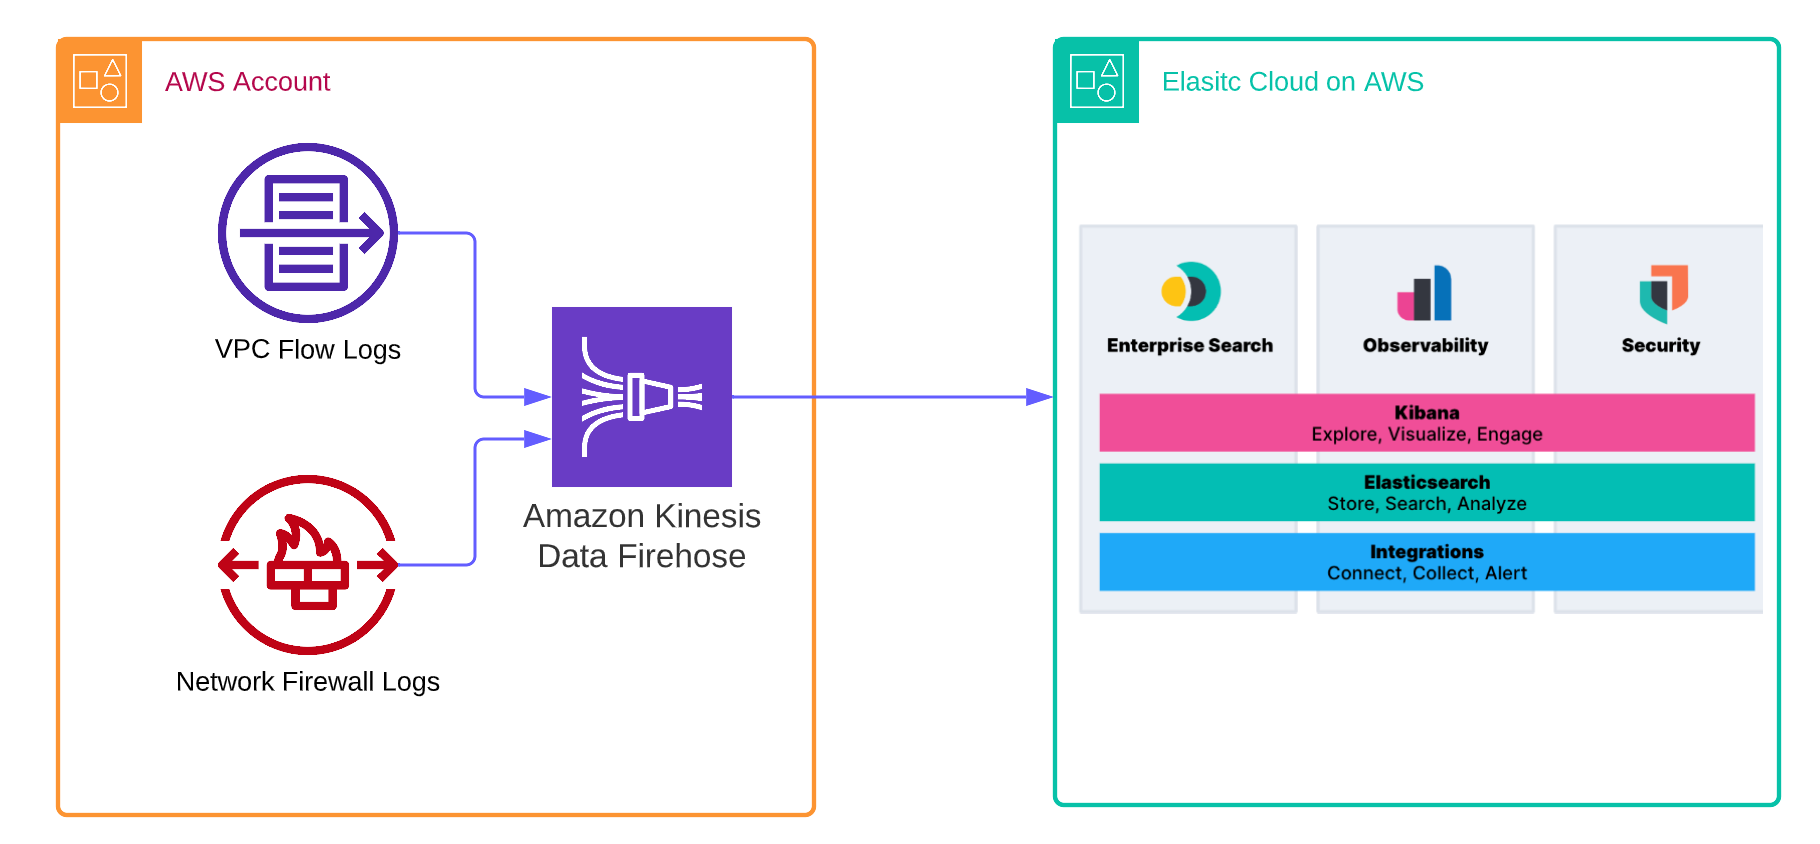
We will guide you through the configuration of the easiest setup, which involves directly sending VPC Flow logs and Firewalls logs to Amazon Kinesis Data Firehose and then into Elastic Cloud.
Note: It's important to note that this setup is only compatible with Elastic Cloud on AWS and cannot be used with self-managed or on-premise or other cloud provider Elastic deployments.
Setting it all up
To begin setting up the integration between Amazon Kinesis Data Firehose and Elastic, let's go through the necessary steps.
Step 0: Get an account on Elastic Cloud
Create an account on Elastic Cloud by following the instructions provided to get started on Elastic Cloud.
Step 1: Deploy Elastic on AWS
You can deploy Elastic on AWS via two different approaches: through the UI or through Terraform. We’ll start first with the UI option.
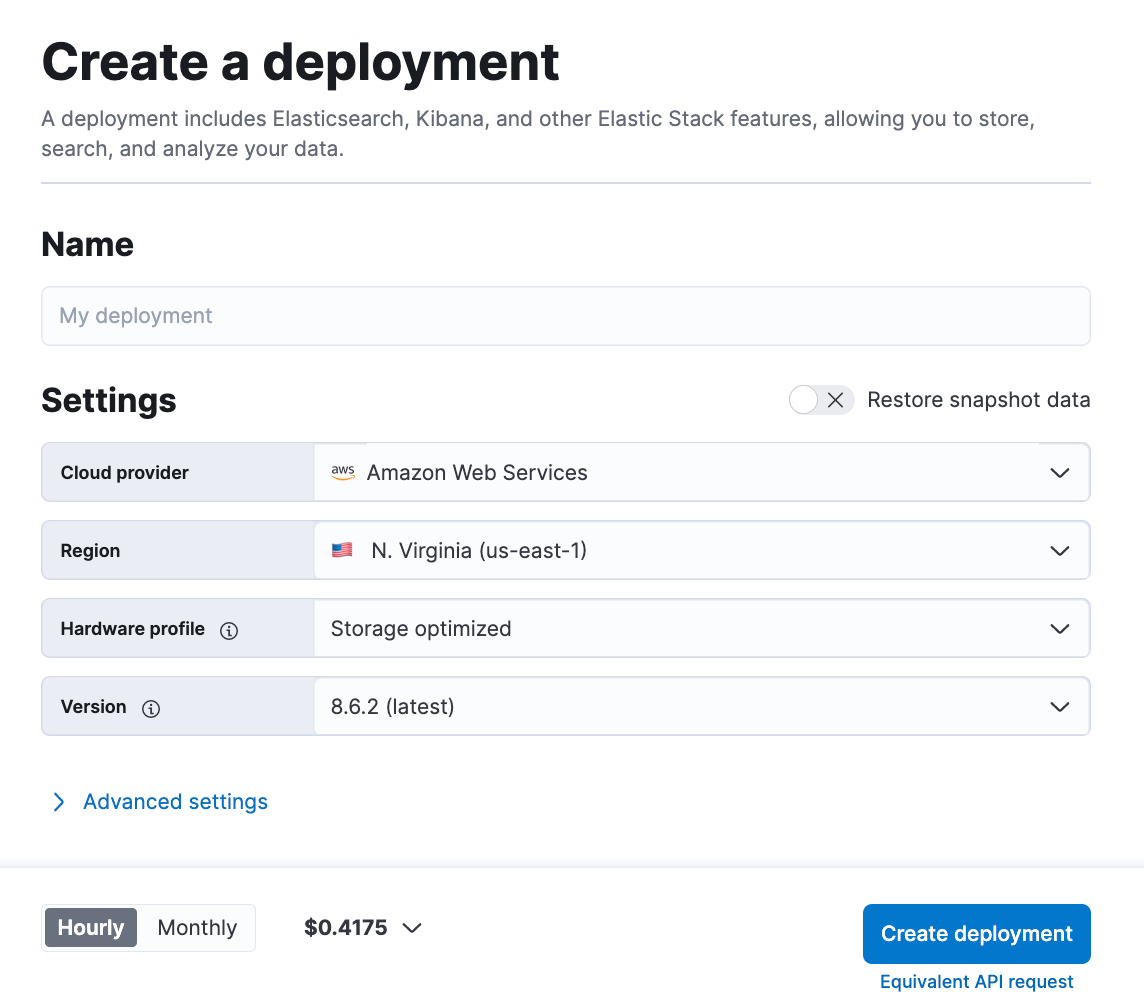
After logging into Elastic Cloud, create a deployment on Elastic. It's crucial to make sure that the deployment is on Elastic Cloud on AWS since the Amazon Kinesis Data Firehose connects to a specific endpoint that must be on AWS.
After your deployment is created, it's essential to copy the Elasticsearch endpoint to ensure a seamless configuration process.
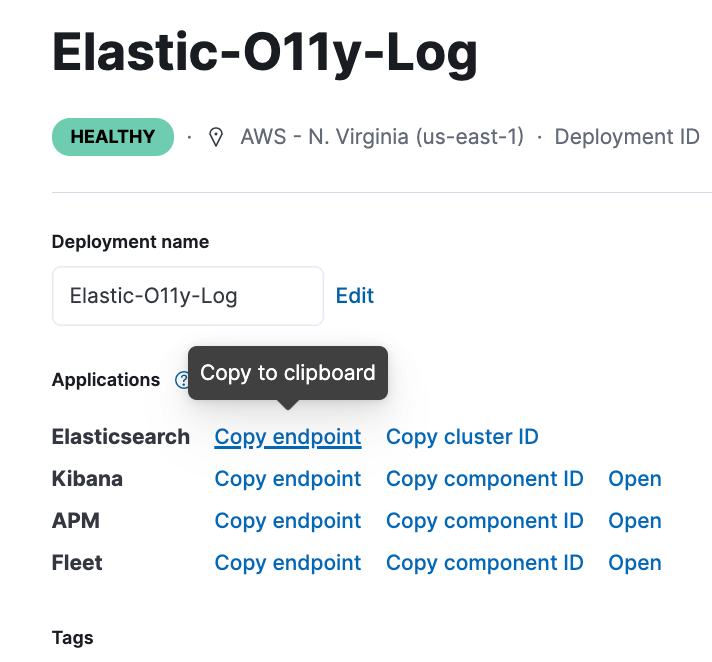
The Elasticsearch HTTP endpoint should be copied and used for Amazon Firehose destination configuration purposes, as it will be required. Here's an example of what the endpoint should look like:
https://elastic-O11y-log.es.us-east-1.aws.found.ioAlternative approach using Terraform
An alternative approach to deploying Elastic Cloud on AWS is by using Terraform. It's also an effective way to automate and streamline the deployment process.
To begin, simply create a Terraform configuration file that outlines the necessary infrastructure. This file should include resources for your Elastic Cloud deployment and any required IAM roles and policies. By using this approach, you can simplify the deployment process and ensure consistency across environments.
One easy way to create your Elastic Cloud deployment with Terraform is to use this Github repo. This resource lets you specify the region, version, and deployment template for your Elastic Cloud deployment, as well as any additional settings you require.
Step 2: To turn on Elastic's AWS integrations, navigate to the Elastic Integration section in your deployment
To install AWS assets in your deployment's Elastic Integration section, follow these steps:
- Log in to your Elastic Cloud deployment and open Kibana.
- To get started, go to the management section of Kibana and click on "Integrations."
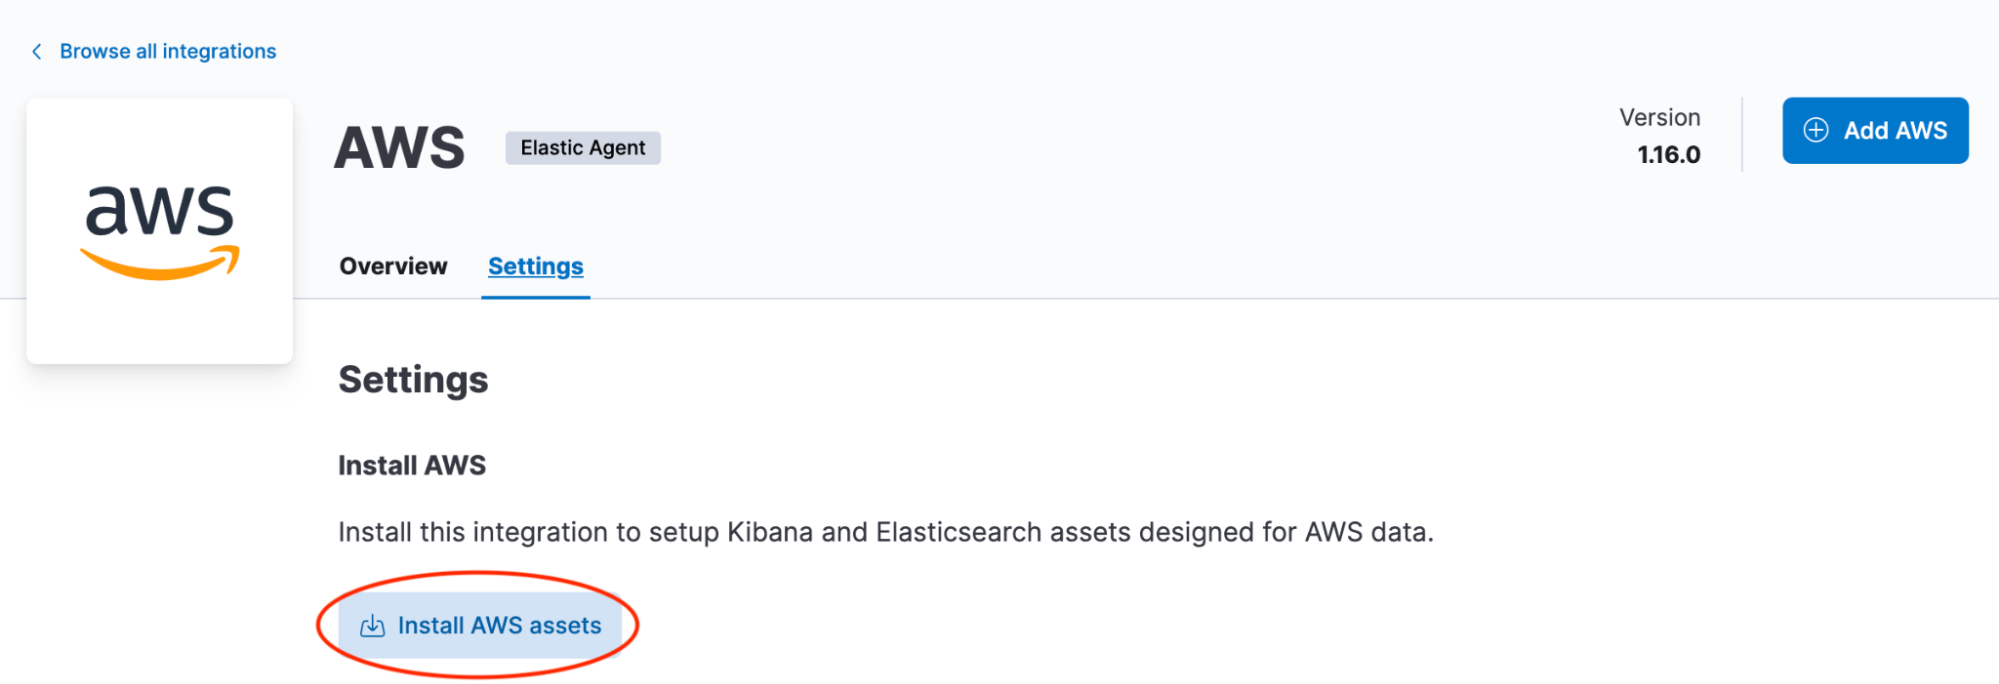
- Navigate to the AWS integration and click on the "Install AWS Assets" button in the settings.This step is important as it installs the necessary assets such as dashboards and ingest pipelines to enable data ingestion from AWS services into Elastic.
Step 3: Set up the Amazon Kinesis Data Firehose delivery stream on the AWS Console
You can set up the Kinesis Data Firehose delivery stream via two different approaches: through the AWS Management Console or through Terraform. We’ll start first with the console option.
To set up the Kinesis Data Firehose delivery stream on AWS, follow these steps:
1. Go to the AWS Management Console and select Amazon Kinesis Data Firehose.
2. Click on Create delivery stream.
3. Choose a delivery stream name and select Direct PUT or other sources as the source.
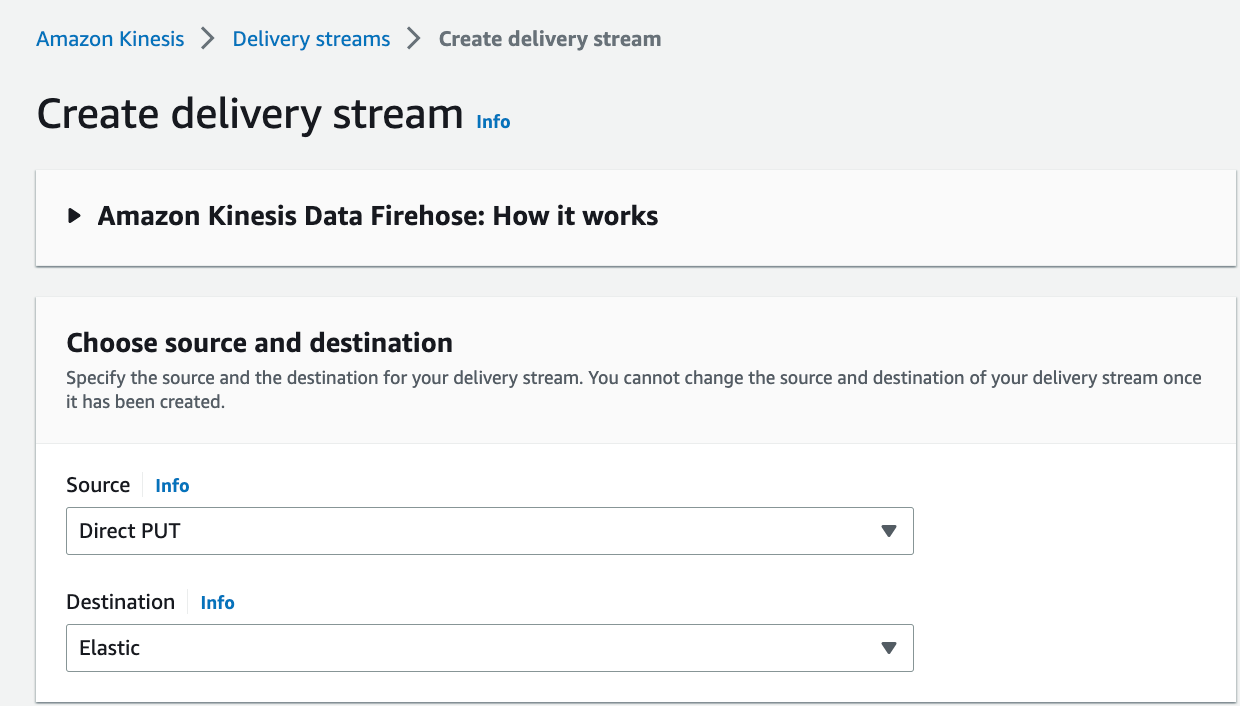
4. Choose Elastic as the destination.
5. In the Elastic destination section, enter the Elastic endpoint URL that you copied from your Elastic Cloud deployment.
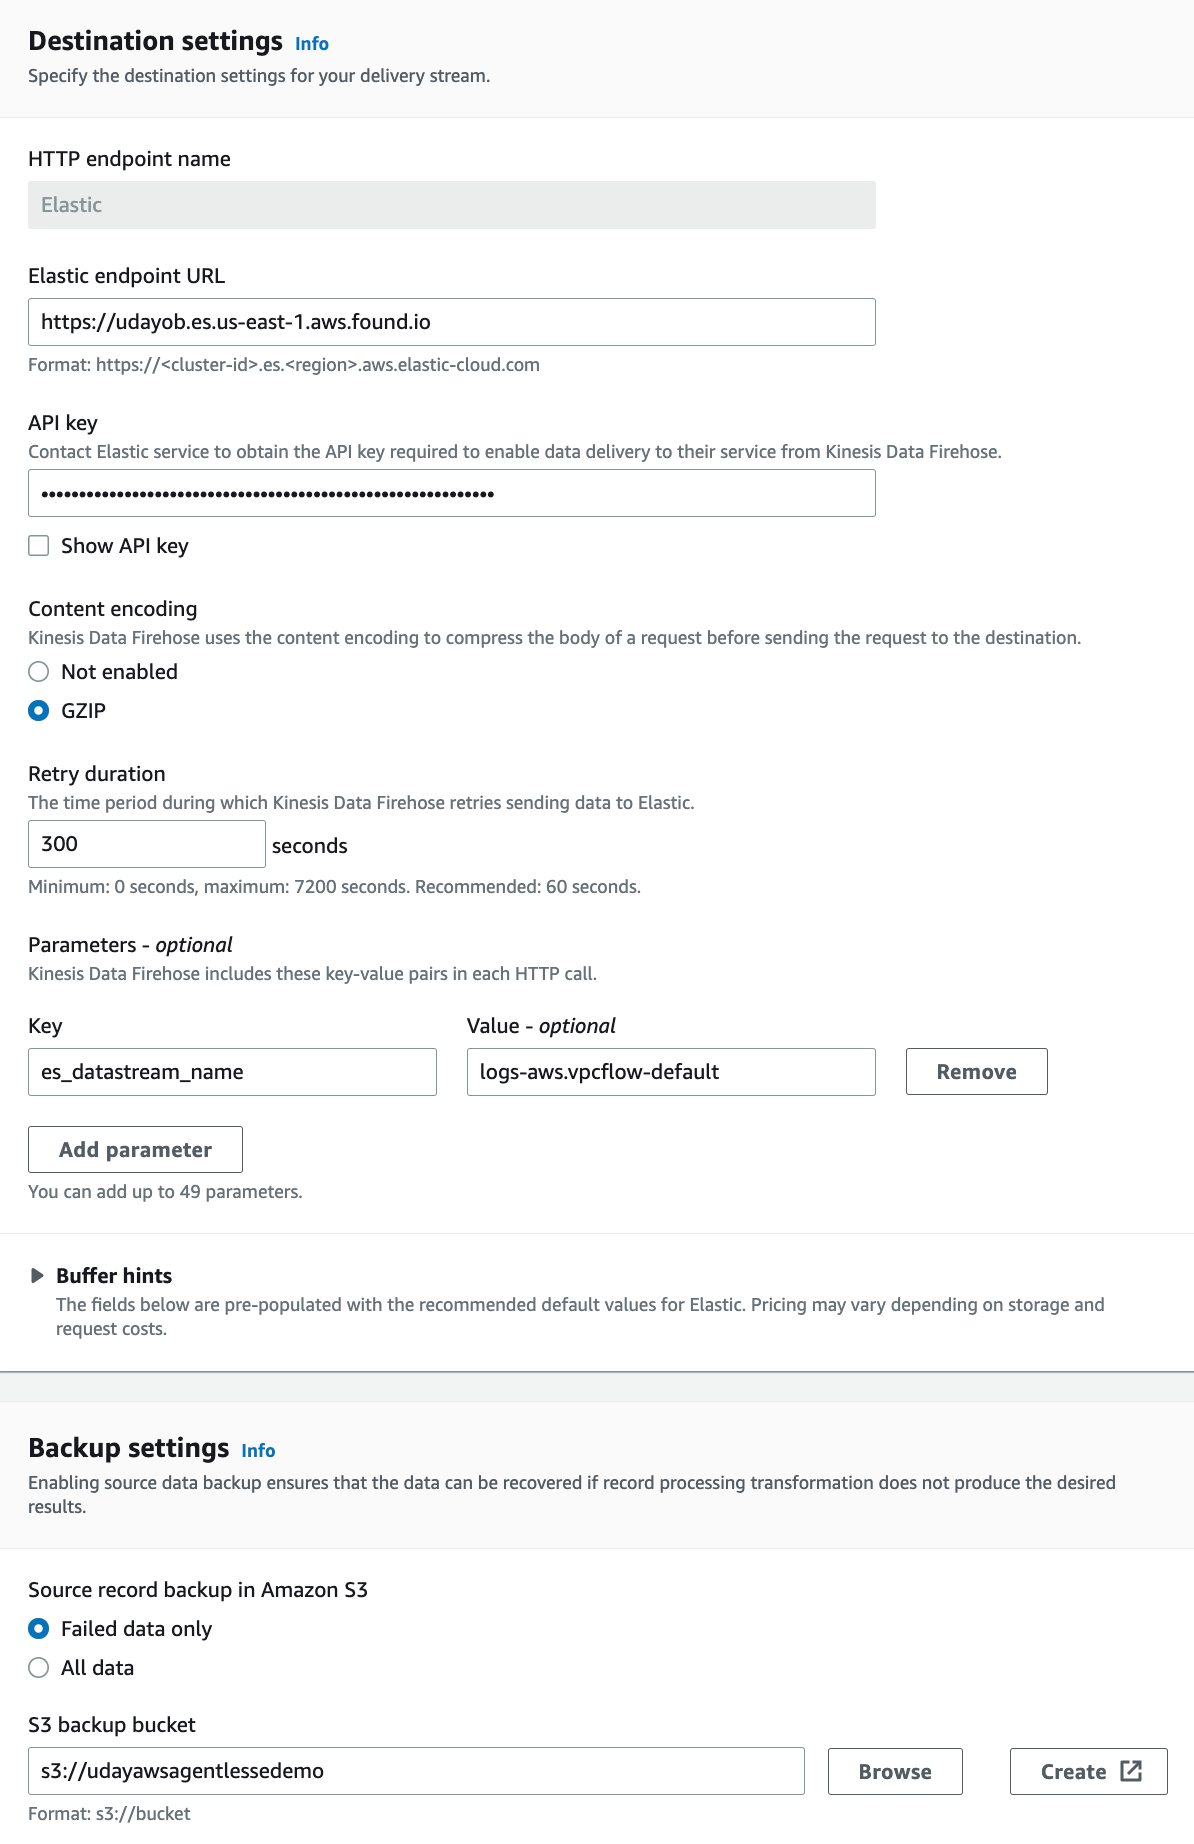
6. Choose the content encoding and retry duration as shown above.
7. Enter the appropriate parameter values for your AWS log type. For example, for VPC Flow logs, you would need to specify the es_datastream_name and logs-aws.vpc flow-default.
8. Configure the Amazon S3 bucket as the source backup for the Amazon Kinesis Data Firehose delivery stream failed data or all data, and configure any required tags for the delivery stream.
9. Review the settings and click on Create delivery stream.
In the example above, we are using the es_datastream_name parameter to pull in VPC Flow logs through the logs-aws.vpcflow-default datastream. Depending on your use case, this parameter can be configured with one of the following types of logs:
- logs-aws.cloudfront_logs-default (AWS CloudFront logs)
- logs-aws.ec2_logs-default (EC2 logs in AWS CloudWatch)
- logs-aws.elb_logs-default (Amazon Elastic Load Balancing logs)
- logs-aws.firewall_logs-default (AWS Network Firewall logs)
- logs-aws.route53_public_logs-default (Amazon Route 53 public DNS queries logs)
- logs-aws.route53_resolver_logs-default (Amazon Route 53 DNS queries & responses logs)
- logs-aws.s3access-default (Amazon S3 server access log)
- logs-aws.vpcflow-default (AWS VPC flow logs)
- logs-aws.waf-default (AWS WAF Logs)
Alternative approach using Terraform
Using the "aws_kinesis_firehose_delivery_stream" resource in Terraform is another way to create a Kinesis Firehose delivery stream, allowing you to specify the delivery stream name, data source, and destination - in this case, an Elasticsearch HTTP endpoint. To authenticate, you'll need to provide the endpoint URL and an API key. Leveraging this Terraform resource is a fantastic way to automate and streamline your deployment process, resulting in greater consistency and efficiency.
Here's an example code that shows you how to create a Kinesis Firehose delivery stream with Terraform that sends data to an Elasticsearch HTTP endpoint:
resource "aws_kinesis_firehose_delivery_stream" “Elasticcloud_stream" {
  name        = "terraform-kinesis-firehose-ElasticCloud-stream"
  destination = "http_endpoint”
  s3_configuration {
    role_arn           = aws_iam_role.firehose.arn
    bucket_arn         = aws_s3_bucket.bucket.arn
    buffer_size        = 5
    buffer_interval    = 300
    compression_format = "GZIP"
  }
  http_endpoint_configuration {
    url        = "https://cloud.elastic.co/"
    name       = “ElasticCloudEndpoint"
    access_key = “ElasticApi-key"
    buffering_hints {
      size_in_mb = 5
      interval_in_seconds = 300
    }

   role_arn       = "arn:Elastic_role"
   s3_backup_mode = "FailedDataOnly"
  }
}
Step 4: Configure VPC Flow Logs to send to Amazon Kinesis Data Firehose
To complete the setup, you'll need to configure VPC Flow logs in the VPC where your application is deployed and send them to the Amazon Kinesis Data Firehose delivery stream you set up in Step 3.
Enabling VPC flow logs in AWS is a straightforward process that involves several steps. Here's a step-by-step details to enable VPC flow logs in your AWS account:
1. Select the VPC for which you want to enable flow logs.
2. In the VPC dashboard, click on "Flow Logs" under the "Logs" section.
3. Click on the "Create Flow Log" button to create a new flow log.
4. In the "Create Flow Log" wizard, provide the following information:
Choose the target for your flow logs: In this case, Amazon Kinesis Data Firehose in the same AWS account.
- Provide a name for your flow log.
- Choose the VPC and the network interface(s) for which you want to enable flow logs.
- Choose the flow log format: either AWS default or Custom format.
5. Configure the IAM role for the flow logs. If you have an existing IAM role, select it. Otherwise, create a new IAM role that grants the necessary permissions for the flow logs.
6. Review the flow log configuration and click "Create."
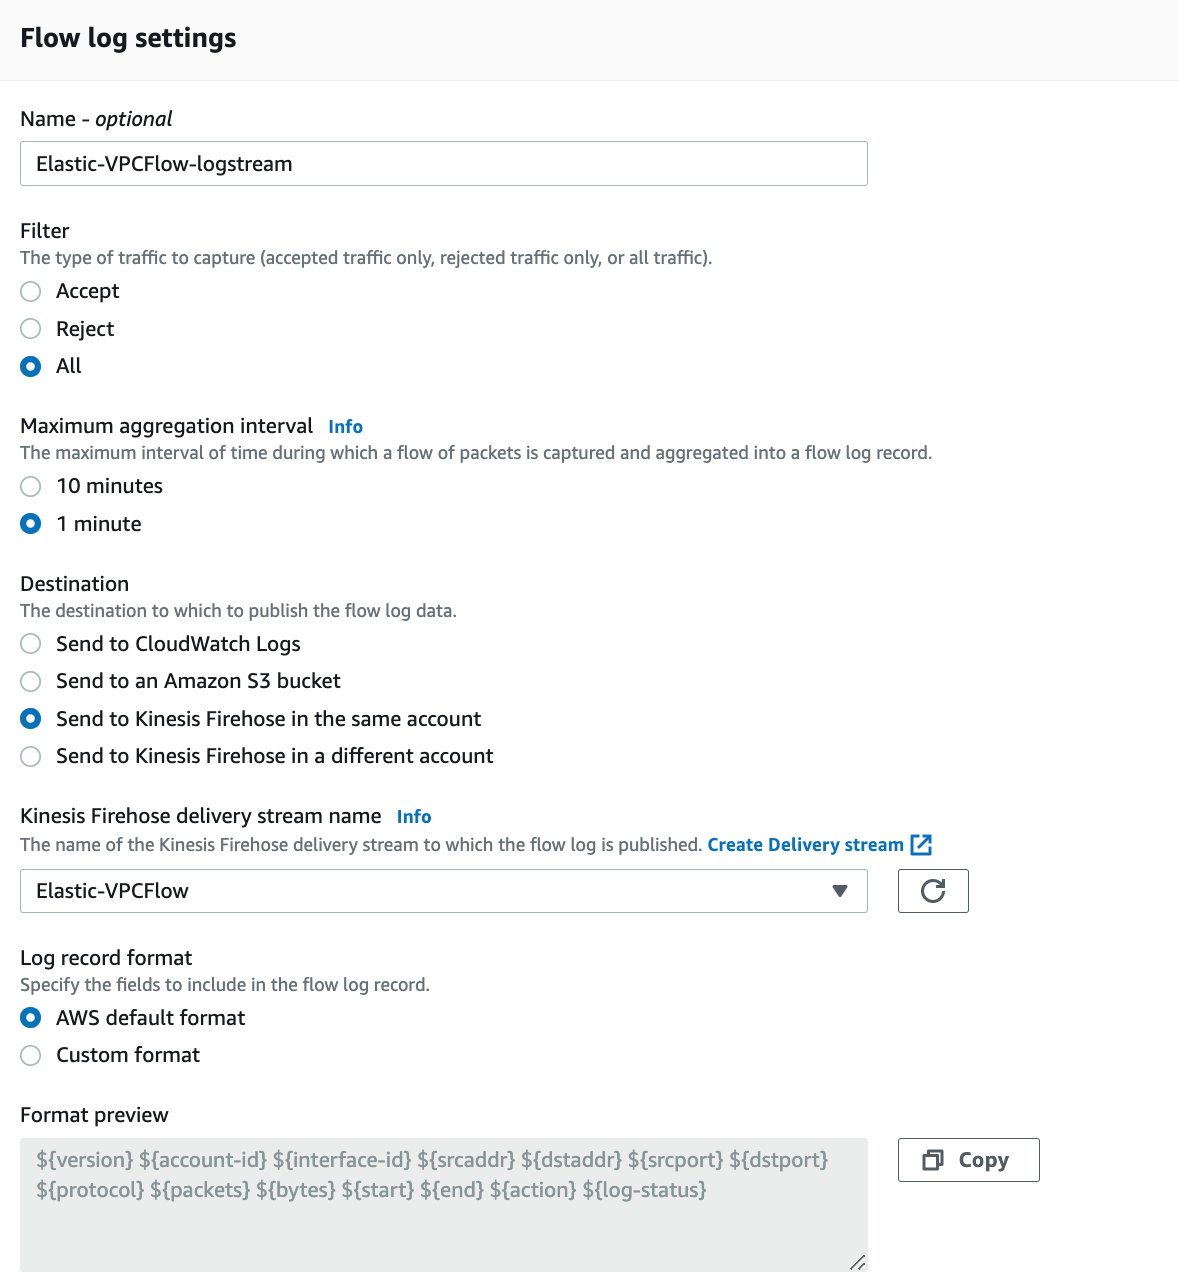
Create the VPC Flow log.
Step 5: After a few minutes, check if flows are coming into Elastic
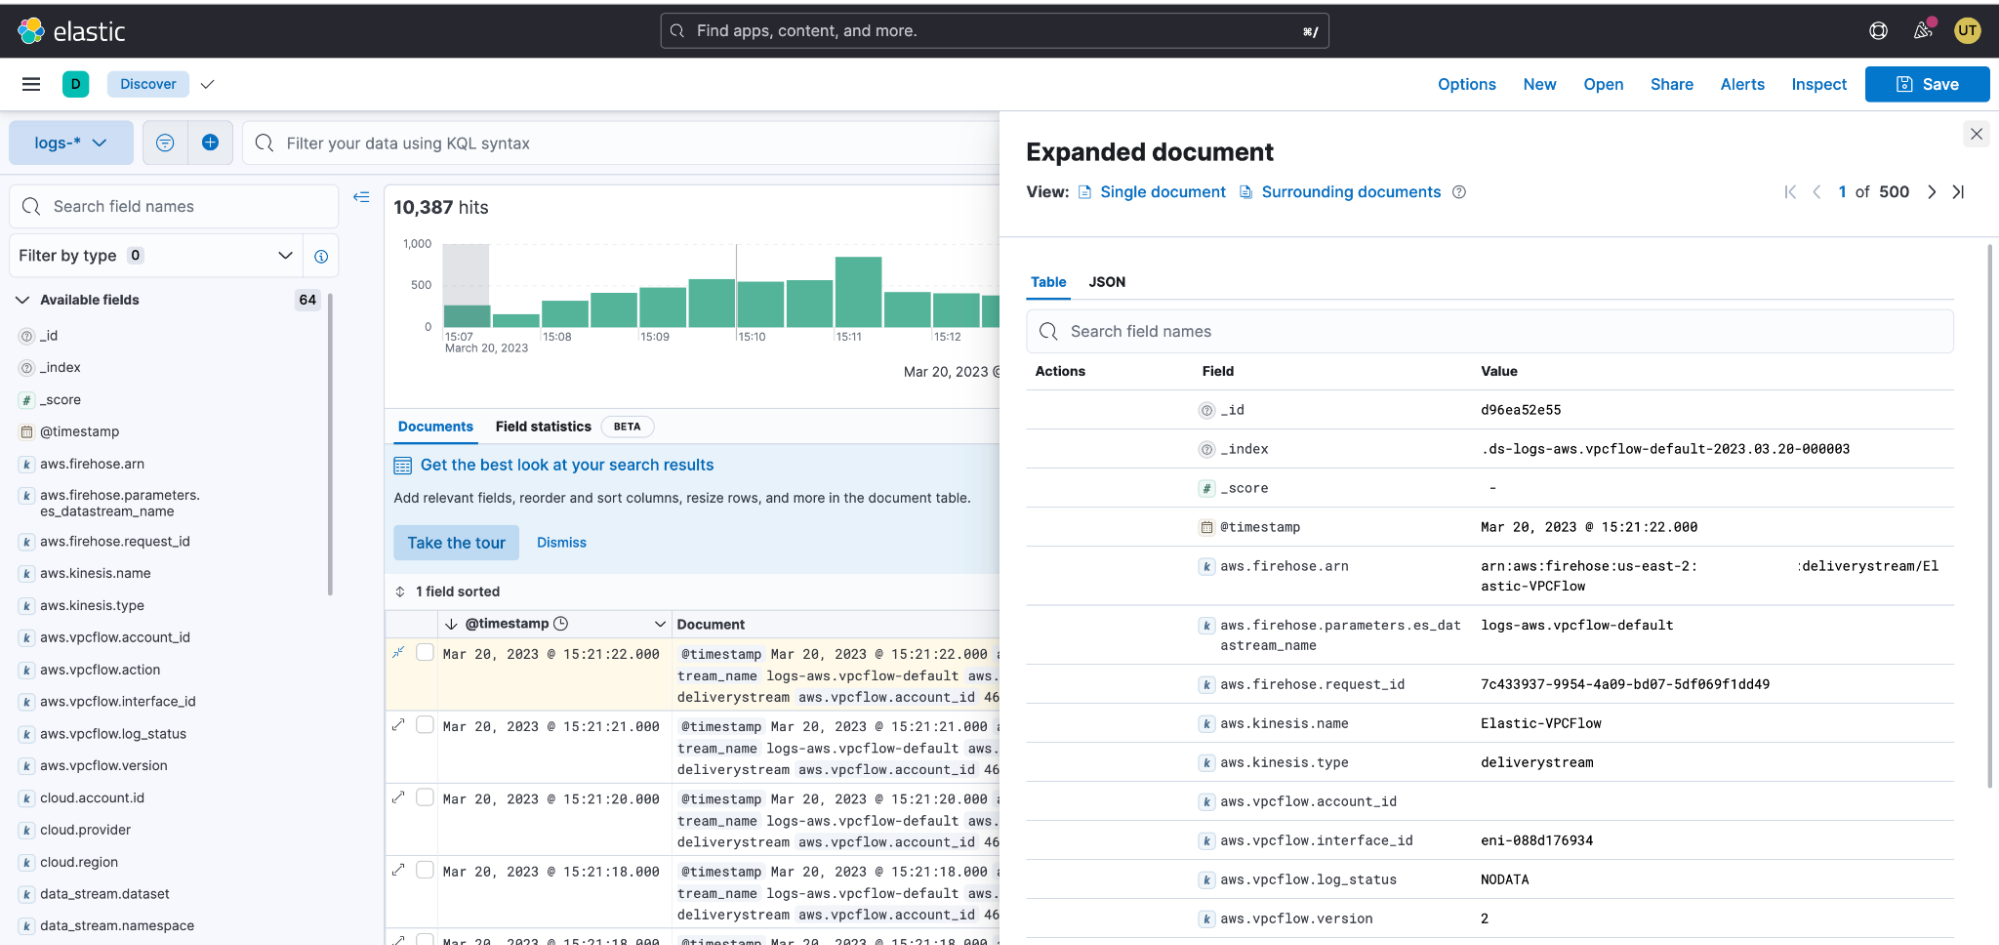
To confirm that the VPC Flow logs are ingesting into Elastic, you can check the logs in Kibana. You can do this by searching for the index in the Kibana Discover tab and filtering the results by the appropriate index and time range. If VPC Flow logs are flowing in, you should see a list of documents representing the VPC Flow logs.
Step 6: Navigate to Kibana to see your logs parsed and visualized in the [Logs AWS] VPC Flow Log Overview dashboard
Finally, there is an Elastic out-of-the-box (OOTB) VPC Flow logs dashboard that displays the top IP addresses that are hitting your VPC, their geographic location, time series of the flows, and a summary of VPC flow log rejects within the selected time frame. This dashboard can provide valuable insights into your network traffic and potential security threats.
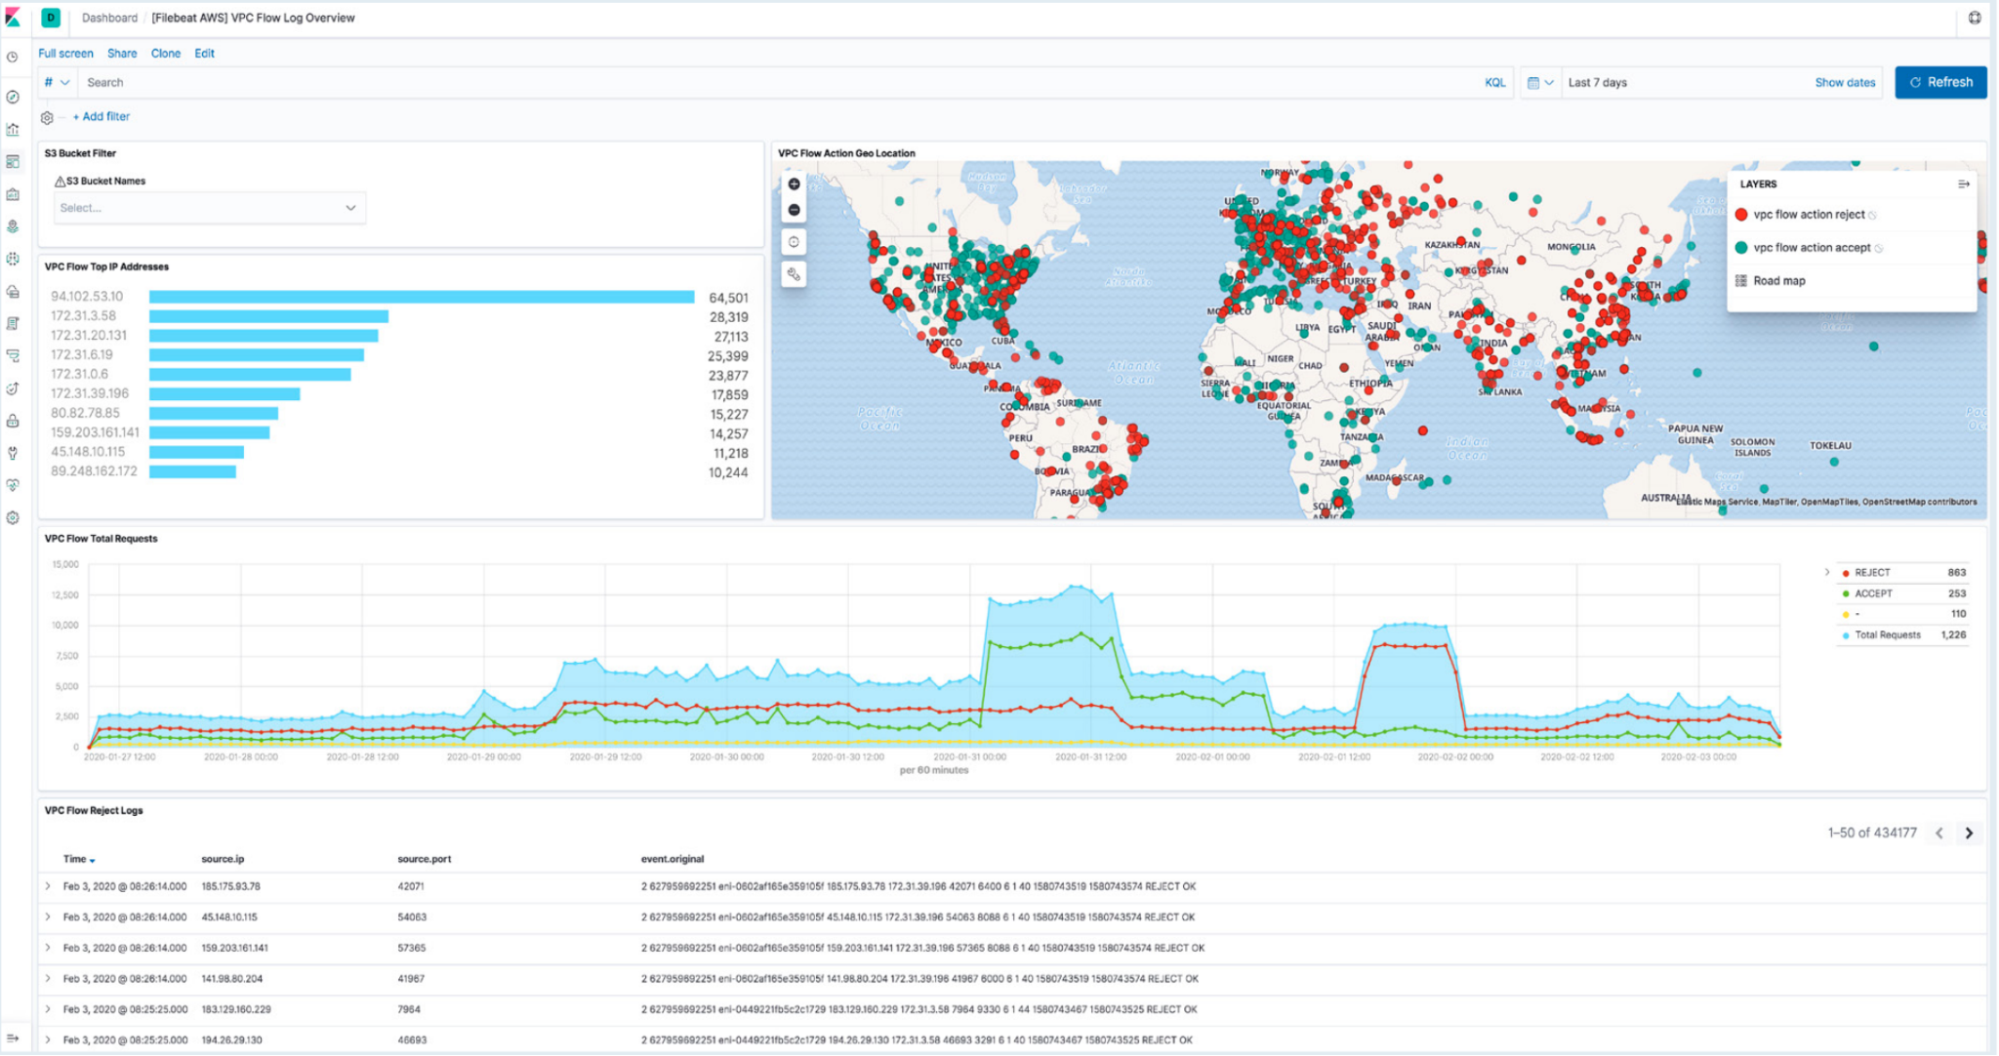
Note: For additional VPC flow log analysis capabilities, please refer to this blog.
Step 7: Configure AWS Network Firewall Logs to send to Kinesis Firehose
To create a Kinesis Data Firehose delivery stream for AWS Network firewall logs, first log in to the AWS Management Console, navigate to the Kinesis service, select "Data Firehose", and follow the step-by-step instructions as shown in Step 3. Specify the Elasticsearch endpoint, API key, add a parameter (es_datastream_name=logs-aws.firewall_logs-default), and create the delivery stream.
Second, to set up a Network Firewall rule group to send logs to the Kinesis Firehose, go to the Network Firewall section of the console, create a rule group, add a rule to allow traffic to the Kinesis endpoint, and attach the rule group to your Network Firewall configuration. Finally, test the configuration by sending traffic through the Network Firewall to the Kinesis Firehose endpoint and verify that logs are being delivered to your S3 bucket.
Kindly follow the instructions below to set up a firewall rule and logging.
1. Set up a Network Firewall rule group to send logs to Amazon Kinesis Data Firehose:
- Go to the AWS Management Console and select Network Firewall.
- Click on "Rule groups" in the left menu and then click "Create rule group."
- Choose "Stateless" or "Stateful" depending on your requirements, and give your rule group a name. Click "Create rule group."
- Add a rule to the rule group to allow traffic to the Kinesis Firehose endpoint. For example, if you are using the us-east-1 region, you would add a rule like this:json
{
   "RuleDefinition":{
      "Actions":[
         {
            "Type":"AWS::KinesisFirehose::DeliveryStream",
            "Options":{
               "DeliveryStreamArn":"arn:aws:firehose:us-east-1:12387389012:deliverystream/my-delivery-stream"
            }
         }
      ],
      "MatchAttributes":{
         "Destination":{
            "Addresses":[
               "api.firehose.us-east-1.amazonaws.com"
            ]
         },
         "Protocol":{
            "Numeric":6,
            "Type":"TCP"
         },
         "PortRanges":[
            {
               "From":443,
               "To":443
            }
         ]
      }
   },
   "RuleOptions":{
      "CustomTCPStarter":{
         "Enabled":true,
         "PortNumber":443
      }
   }
}- Save the rule group.
2. Attach the rule group to your Network Firewall configuration:
- Go to the AWS Management Console and select Network Firewall.
- Click on "Firewall configurations" in the left menu and select the configuration you want to attach the rule group to.
- Scroll down to "Associations" and click "Edit."
- Select the rule group you created in Step 2 and click "Save."
3. Test the configuration:
- Send traffic through the Network Firewall to the Kinesis Firehose endpoint and verify that logs are being delivered to your S3 bucket.
Step 8: Navigate to Kibana to see your logs parsed and visualized in the [Logs AWS] Firewall Log dashboard
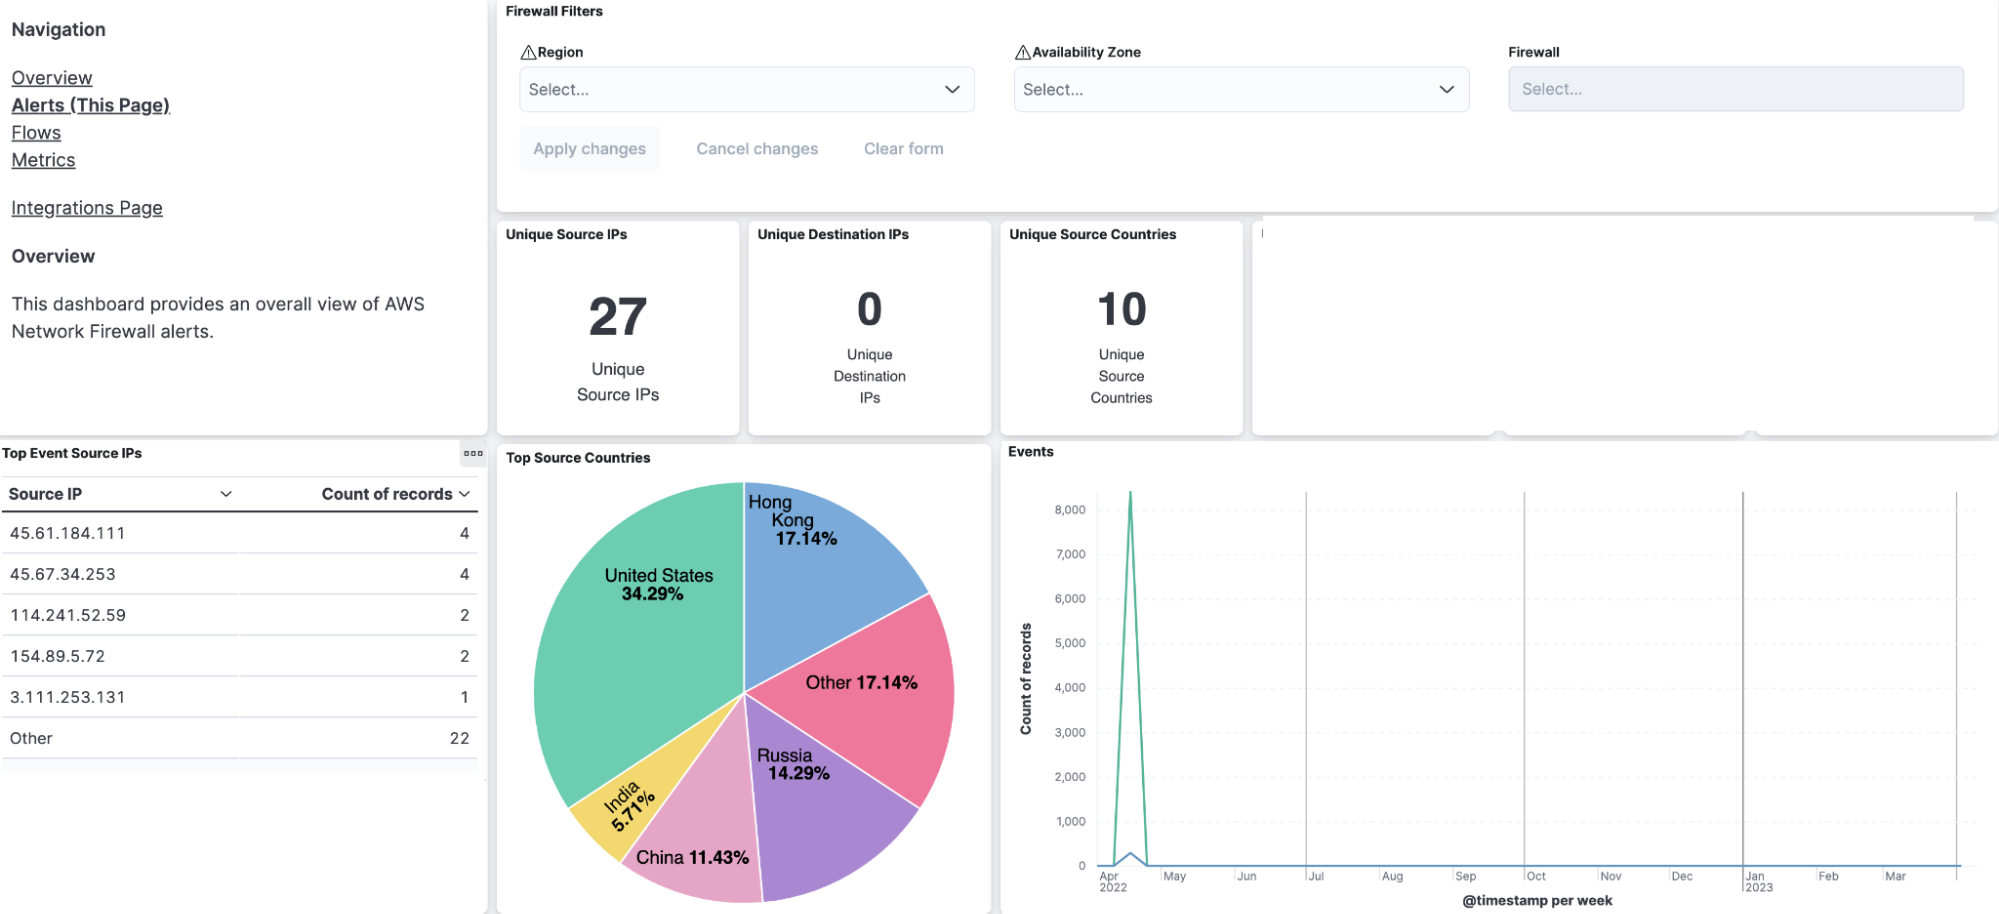
Wrapping up
We’re excited to bring you this latest integration for AWS Cloud and Kinesis Data Firehose into production. The ability to consolidate logs and metrics to gain visibility across your cloud and on-premises environment is crucial for today’s distributed environments and applications.
From EC2, Cloudwatch, Lambda, ECS and SAR, Elastic Integrations allow you to quickly and easily get started with ingesting your telemetry data for monitoring, analytics, and observability. Elastic is constantly delivering frictionless customer experiences, allowing anytime, anywhere access to all of your telemetry data — this streamlined, native integration with AWS is the latest example of our commitment.
Start a free trial today
You can begin with a 7-day free trial of Elastic Cloud within the AWS Marketplace to start monitoring and improving your users' experience today!
The release and timing of any features or functionality described in this post remain at Elastic's sole discretion. Any features or functionality not currently available may not be delivered on time or at all.

