Wait… Elastic Observability monitors metrics for AWS services in just minutes?

The transition to distributed applications is in full swing, driven mainly by our need to be “always-on” as consumers and fast-paced businesses. That need is driving deployments to have more complex requirements along with the ability to be globally diverse and rapidly innovate.
Cloud is becoming the de facto deployment option for today’s applications. Many cloud deployments choose to host their applications on AWS for the globally diverse set of regions it covers and the myriad of services (for faster development and innovation) available, as well as to drive operational and capital costs down. On AWS, development teams are finding additional value in migrating to Kubernetes on Amazon EKS, testing out the latest serverless options, and improving traditional, tiered applications with better services.
Elastic Observability offers 30 out-of-the-box integrations for AWS services with more to come.
A quick review highlighting some of the integrations and capabilities can be found in a previous post:
Some additional posts on key AWS service integrations on Elastic are:
- APM (metrics, traces and logs) for serverless functions on AWS Lambda with Elastic
- Log ingestion from AWS Services into Elastic via serverless forwarder on Lambda
- Elastic’s Amazon S3 Storage Lens Integration: Simplify management, control costs, and reduce risk
- Ingest your container logs into Elastic Cloud with AWS FireLens
A full list of AWS integrations can be found in Elastic’s online documentation:
In addition to our native AWS integrations, Elastic Observability aggregates not only logs but also metrics for AWS services and the applications running on AWS compute services (EC2, Lambda, EKS/ECS/Fargate). All this data can be analyzed visually and more intuitively using Elastic’s advanced machine learning capabilities, which help detect performance issues and surface root causes before end users are affected.
For more details on how Elastic Observability provides application performance monitoring (APM) capabilities such as service maps, tracing, dependencies, and ML based metrics correlations:
- APM correlations in Elastic Observability: Automatically identifying probable causes of slow or failed transactions
- Elastic and AWS: Get the most value from your data sets
That’s right, Elastic offers metrics ingest, aggregation, and analysis for AWS services and applications on AWS compute services (EC2, Lambda, EKS/ECS/Fargate). Elastic is more than logs — it offers a unified observability solution for AWS environments.
In this blog, I’ll review how Elastic Observability can monitor metrics for a simple AWS application running on AWS services which include:
- AWS EC2
- AWS ELB
- AWS RDS (AuroraDB)
- AWS NAT Gateways
As you will see, once the integration is installed, metrics will arrive instantly and you can immediately start reviewing metrics.
Prerequisites and config
If you plan on following this blog, here are some of the components and details we used to set up this demonstration:
- Ensure you have an account on Elastic Cloud and a deployed stack (see instructions here).
- Ensure you have an AWS account with permissions to pull the necessary data from AWS. See details in our documentation.
- We used AWS’s three tier app and installed it as instructed in git.
- We’ll walk through installing the general Elastic AWS Integration, which covers the four services we want to collect metrics for.
(Full list of services supported by the Elastic AWS Integration) - We will not cover application monitoring given other blogs cover application AWS monitoring (metrics, logs, and tracing). Instead we will focus on how AWS services can be easily monitored.
- In order to see metrics, you will need to load the application. We’ve also created a playwright script to drive traffic to the application.
Three tier application overview
Before we dive into the Elastic configuration, let's review what we are monitoring. If you follow the instructions for aws-three-tier-web-architecture-workshop, you will have the following deployed.
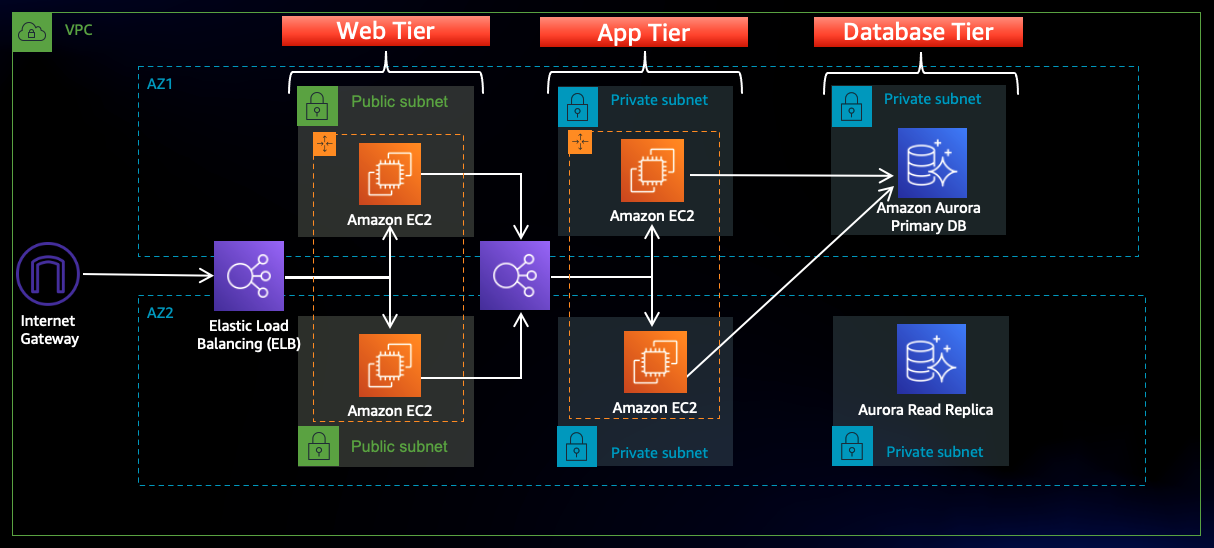
What’s deployed:
- 1 VPC with 6 subnets
- 2 AZs
- 2 web servers per AZ
- 2 application servers per AZ
- 1 External facing application load balancer
- 1 Internal facing application load balancer
- 2 NAT gateways to manage traffic to the application layer
- 1 Internet gateway
- 1 RDS Aurora DB with a read replica
At the end of the blog, we will also provide a Playwright script to implement to load this app. This will help drive metrics to “light up” the dashboards.
Setting it all up
Let’s walk through the details of how to get the application, AWS integration on Elastic, and what gets ingested.
Step 0: Load up the AWS Three Tier application and get your credentials
Follow the instructions listed out in AWS’s Three Tier app and instructions in the workshop link on git. The workshop is listed here.
Once you’ve installed the app, get credentials from AWS. This will be needed for Elastic’s AWS integration.
There are several options for credentials:
- Use access keys directly
- Use temporary security credentials
- Use a shared credentials file
- Use an IAM role Amazon Resource Name (ARN)
For more details on specifics around necessary credentials and permissions.
Step 1: Get an account on Elastic Cloud
Follow the instructions to get started on Elastic Cloud.
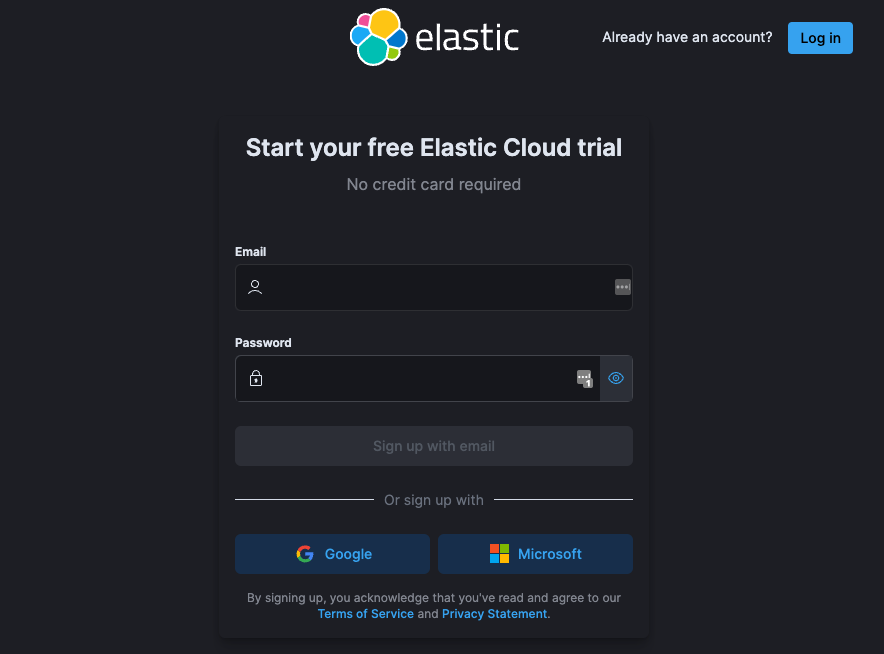
Step 2: Install the Elastic AWS integration
Navigate to the AWS integration on Elastic.
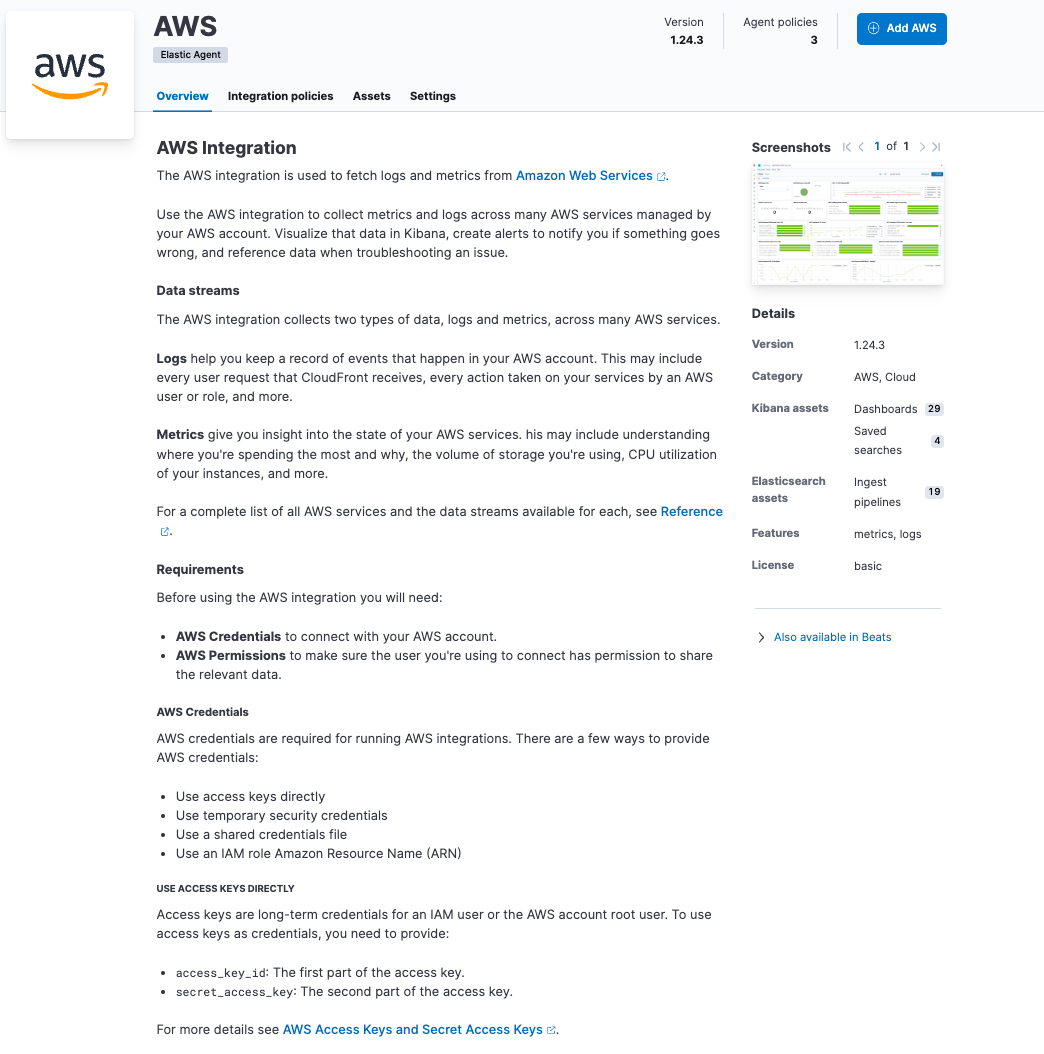
Select Add AWS integration.
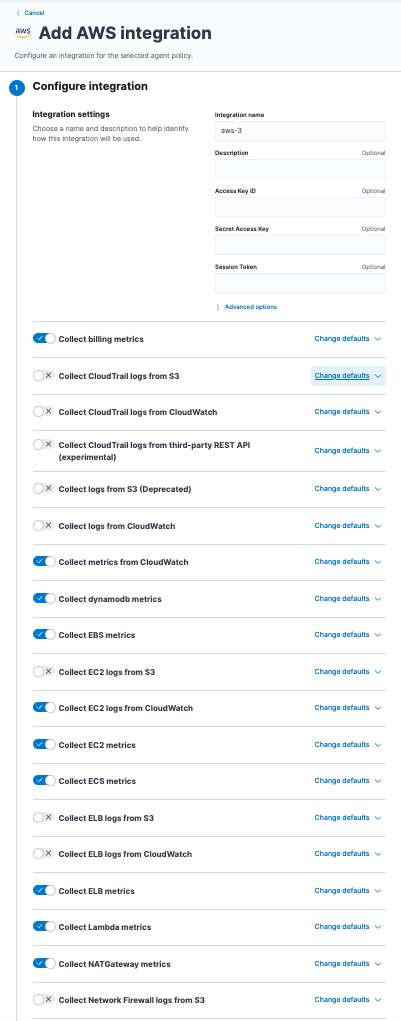
This is where you will add your credentials and it will be stored as a policy in Elastic. This policy will be used as part of the install for the agent in the next step.
As you can see, the general Elastic AWS Integration will collect a significant amount of data from 30 AWS services. If you don’t want to install this general Elastic AWS Integration, you can select individual integrations to install.
Step 3: Install the Elastic Agent with AWS integration
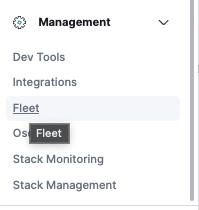
Now that you have created an integration policy, navigate to the Fleet section under Management in Elastic.
Select the name of the policy you created in the last step.
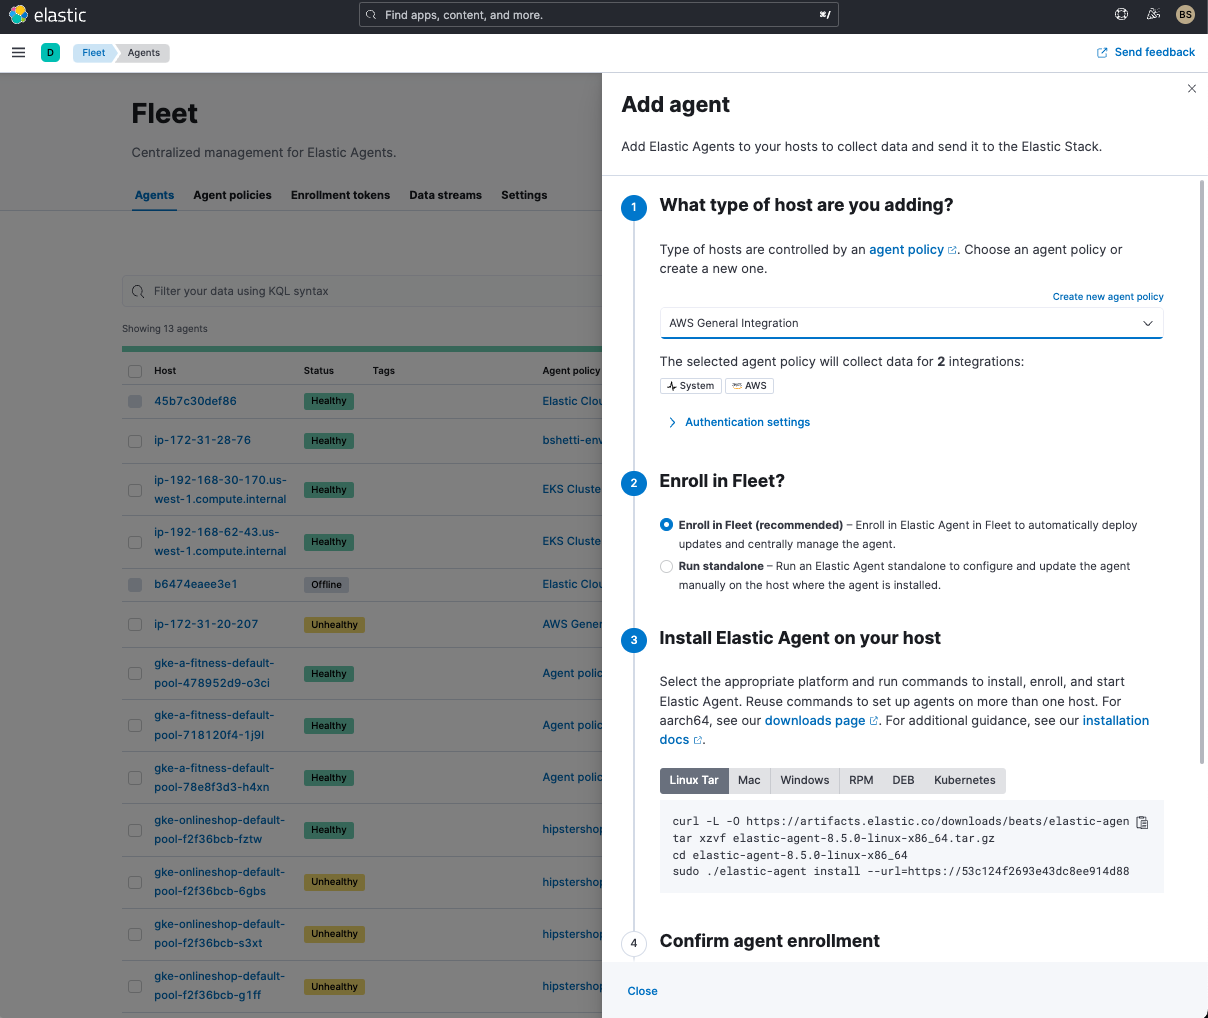
Follow step 3 in the instructions in the Add agent window. This will require you to:
1: Bring up an EC2 instance
- t2.medium is minimum
- Linux - your choice of which
- Ensure you allow for Open reservation on the EC2 instance when you Launch it
2: Log in to the instance and run the commands under Linux Tar tab (below is an example)
curl -L -O https://artifacts.elastic.co/downloads/beats/elastic-agent/elastic-agent-8.5.0-linux-x86_64.tar.gz
tar xzvf elastic-agent-8.5.0-linux-x86_64.tar.gz
cd elastic-agent-8.5.0-linux-x86_64
sudo ./elastic-agent install --url=https://37845638732625692c8ee914d88951dd96.fleet.us-central1.gcp.cloud.es.io:443 --enrollment-token=jkhfglkuwyvrquevuytqoeiyriStep 4: Run traffic against the application
Here is a simple script you can also run using Playwright to add traffic to the website for the AWS three tier application:
import { test, expect } from '@playwright/test';

test('homepage for AWS Threetierapp', async ({ page }) => {
  await page.goto('http://web-tier-external-lb-1897463036.us-west-1.elb.amazonaws.com/#/db');

   await page.fill('#transactions > tbody > tr > td:nth-child(2) > input', (Math.random()*100).toString())
  await page.fill('#transactions > tbody > tr > td:nth-child(3) > input', (Math.random()*100).toString())
  await page.waitForTimeout(1000)
  await page.click('#transactions > tbody > tr:nth-child(2) > td:nth-child(1) > input[type=button]')
  await page.waitForTimeout(4000)

});This script will launch three browsers, but you can limit this load to one browser in playwright.config.ts file.
For this exercise, we ran this traffic for approximately five hours with an interval of five minutes while testing the website.
Step 5: Go to AWS dashboards
Now that your Elastic Agent is running, you can go to the related AWS dashboards to view what’s being ingested.
To search for the AWS Integration dashboards, simply search for them in the Elastic search bar. The relevant ones for this blog are:
- [Metrics AWS] EC2 Overview
- [Metrics AWS] ELB Overview
- [Metrics AWS] RDS Overview
- [Metrics AWS] NAT Gateway

Let's see what comes up!
All of these dashboards are out-of-the-box and for all the following images, we’ve narrowed the views to only the relevant items from our app.
Across all dashboards, we’ve limited the timeframe to when we ran the traffic generator.
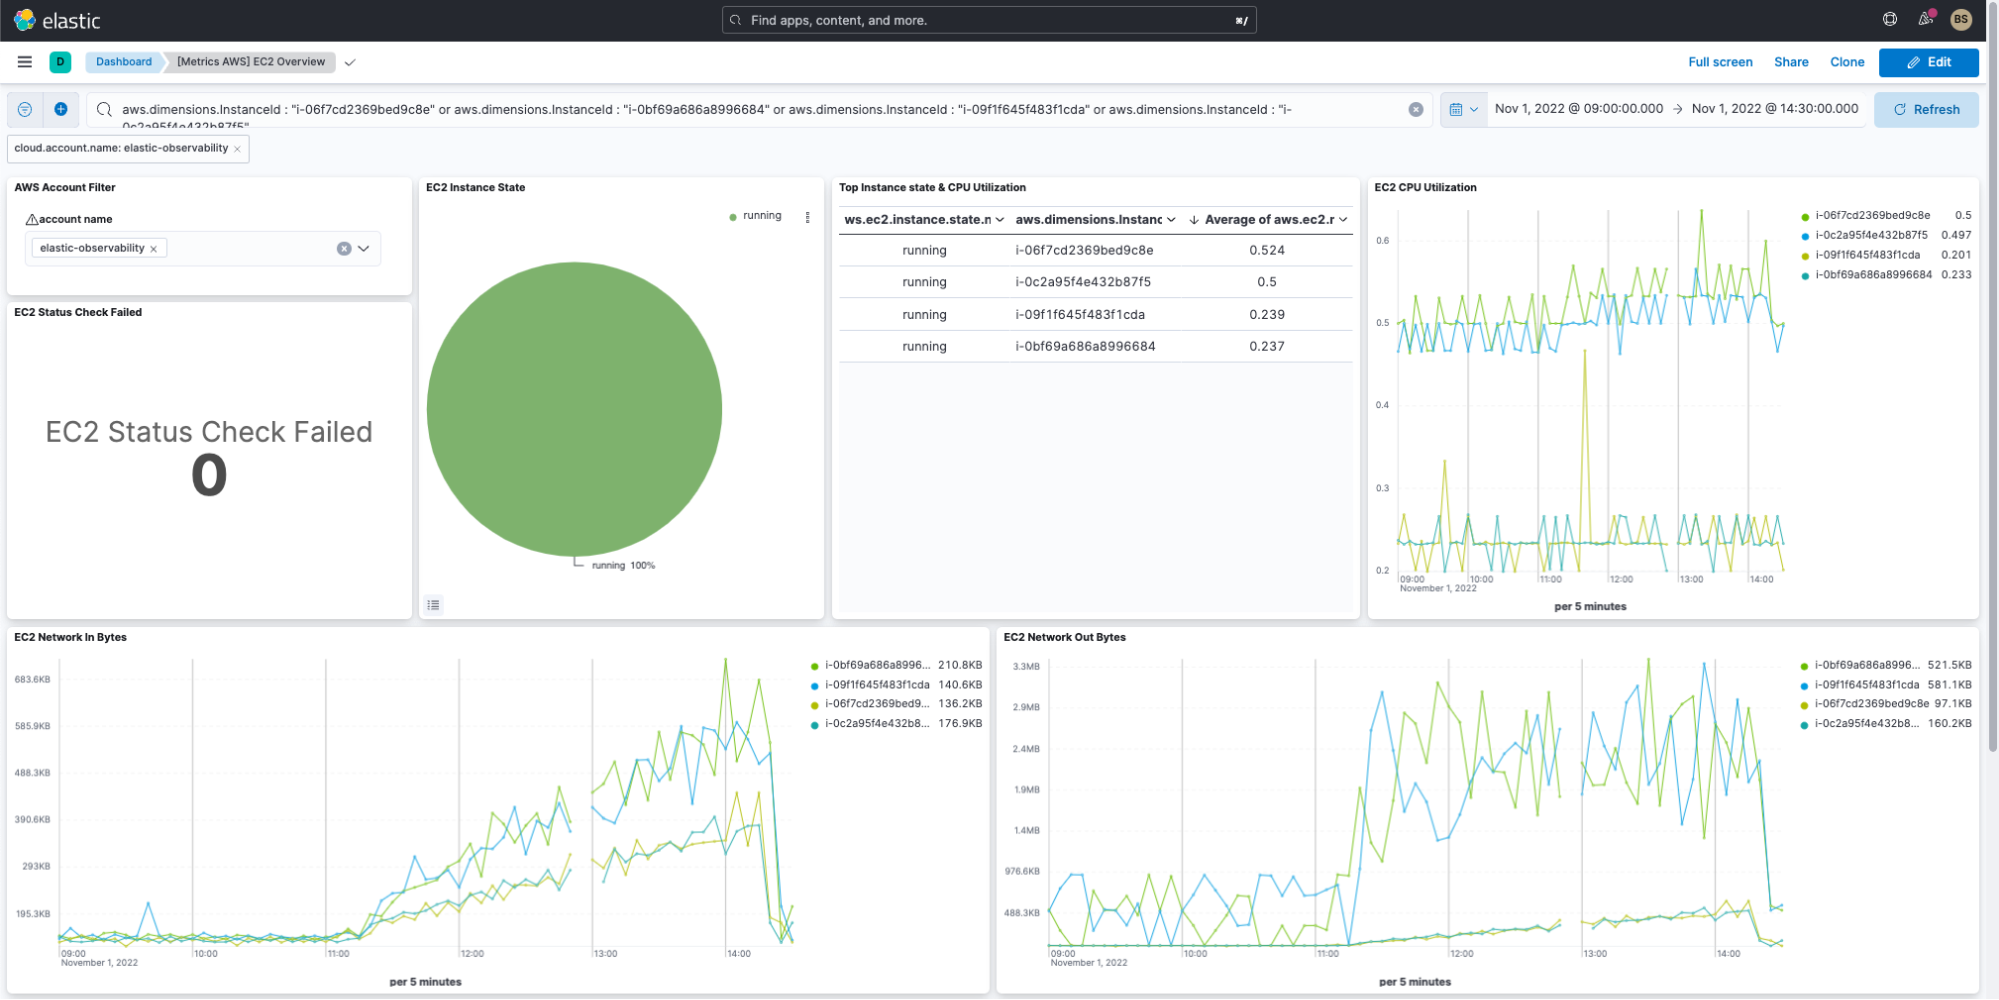
Once we filtered for our 4 EC2 instances (2 web servers and 2 application servers), we can see the following:
1: All 4 instances are up and running with no failures in status checks.
2: We see the average CPU utilization across the timeframe and nothing looks abnormal.
3: We see the network bytes flow in and out, aggregating over time as the database is loaded with rows.
While this exercise shows a small portion of the metrics that can be viewed, more are available from AWS EC2. The metrics listed on AWS documentation are all available, including the dimensions to help narrow the search for specific instances, etc.
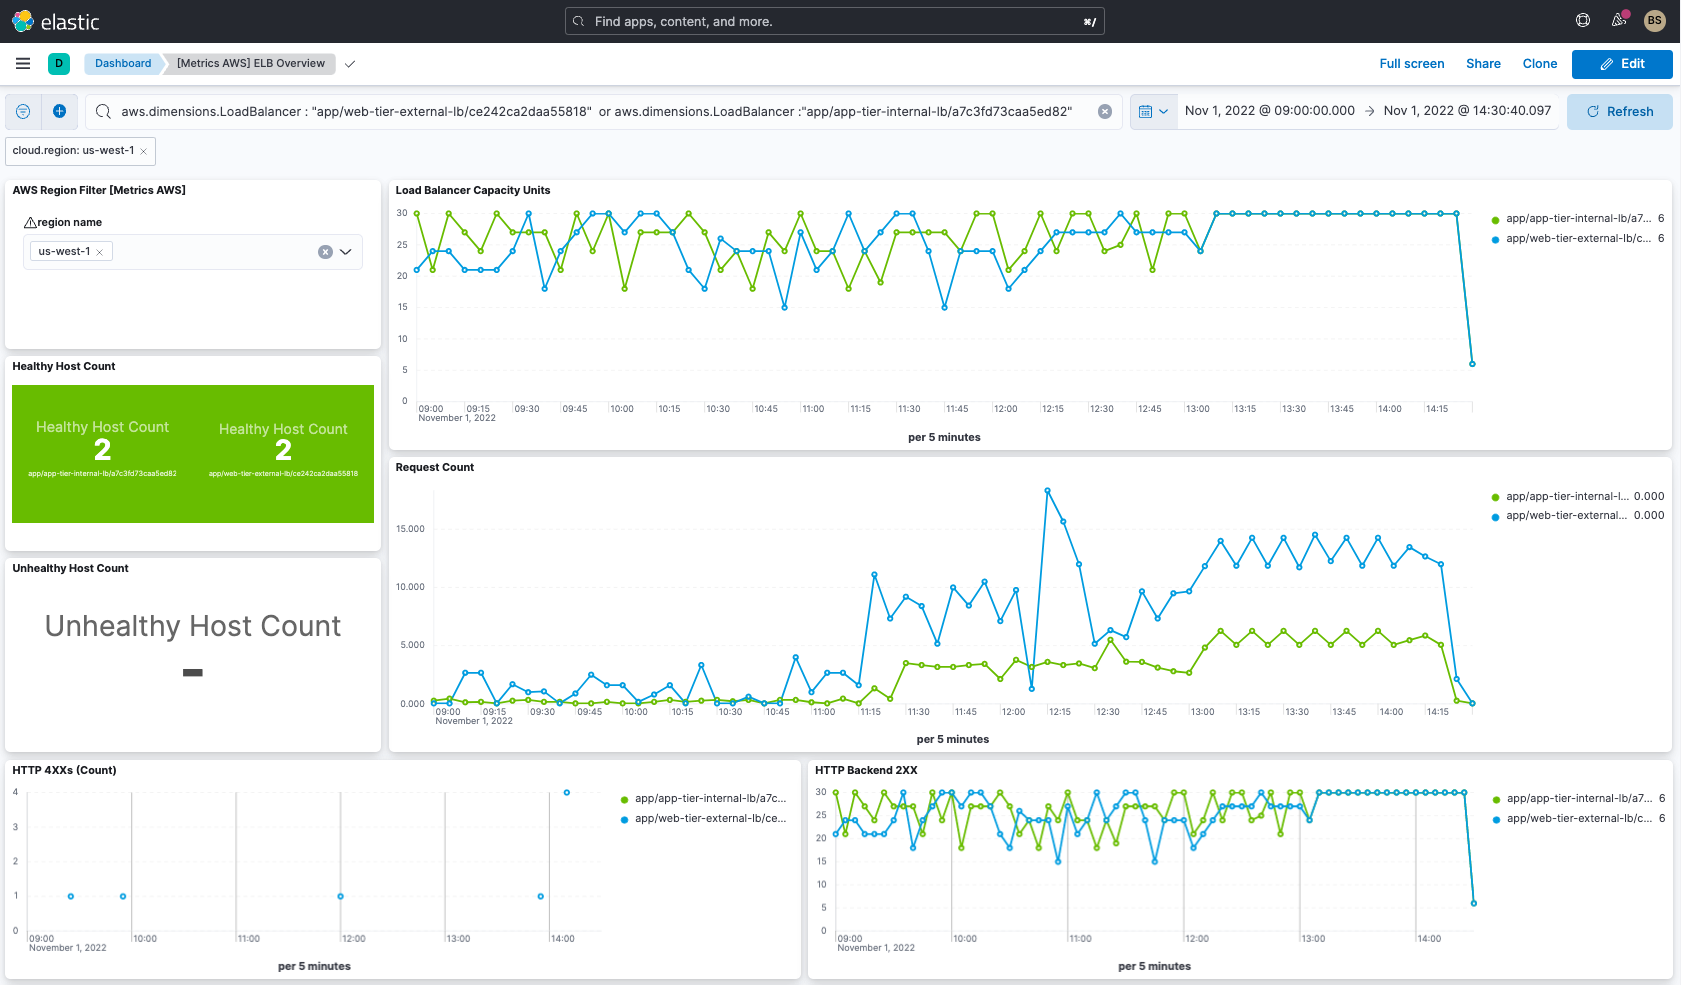
For the ELB dashboard, we filter for our 2 load balancers (external web load balancer and internal application load balancer).
With the out-of-the-box dashboard, you can see application ELB-specific metrics. A good portion of the application ELB specific metrics listed in AWS Docs are available to add graphs for.
For our two load balancers, we can see:
1: Both the hosts (EC2 instances connected to the ELBs) are healthy.
2: Load Balancer Capacity Units (how much you are using) and request counts both went up as expected during the traffic generation time frame.
3: We picked to show 4XX and 2XX counts. 4XX will help identify issues with the application or connectivity with the application servers.
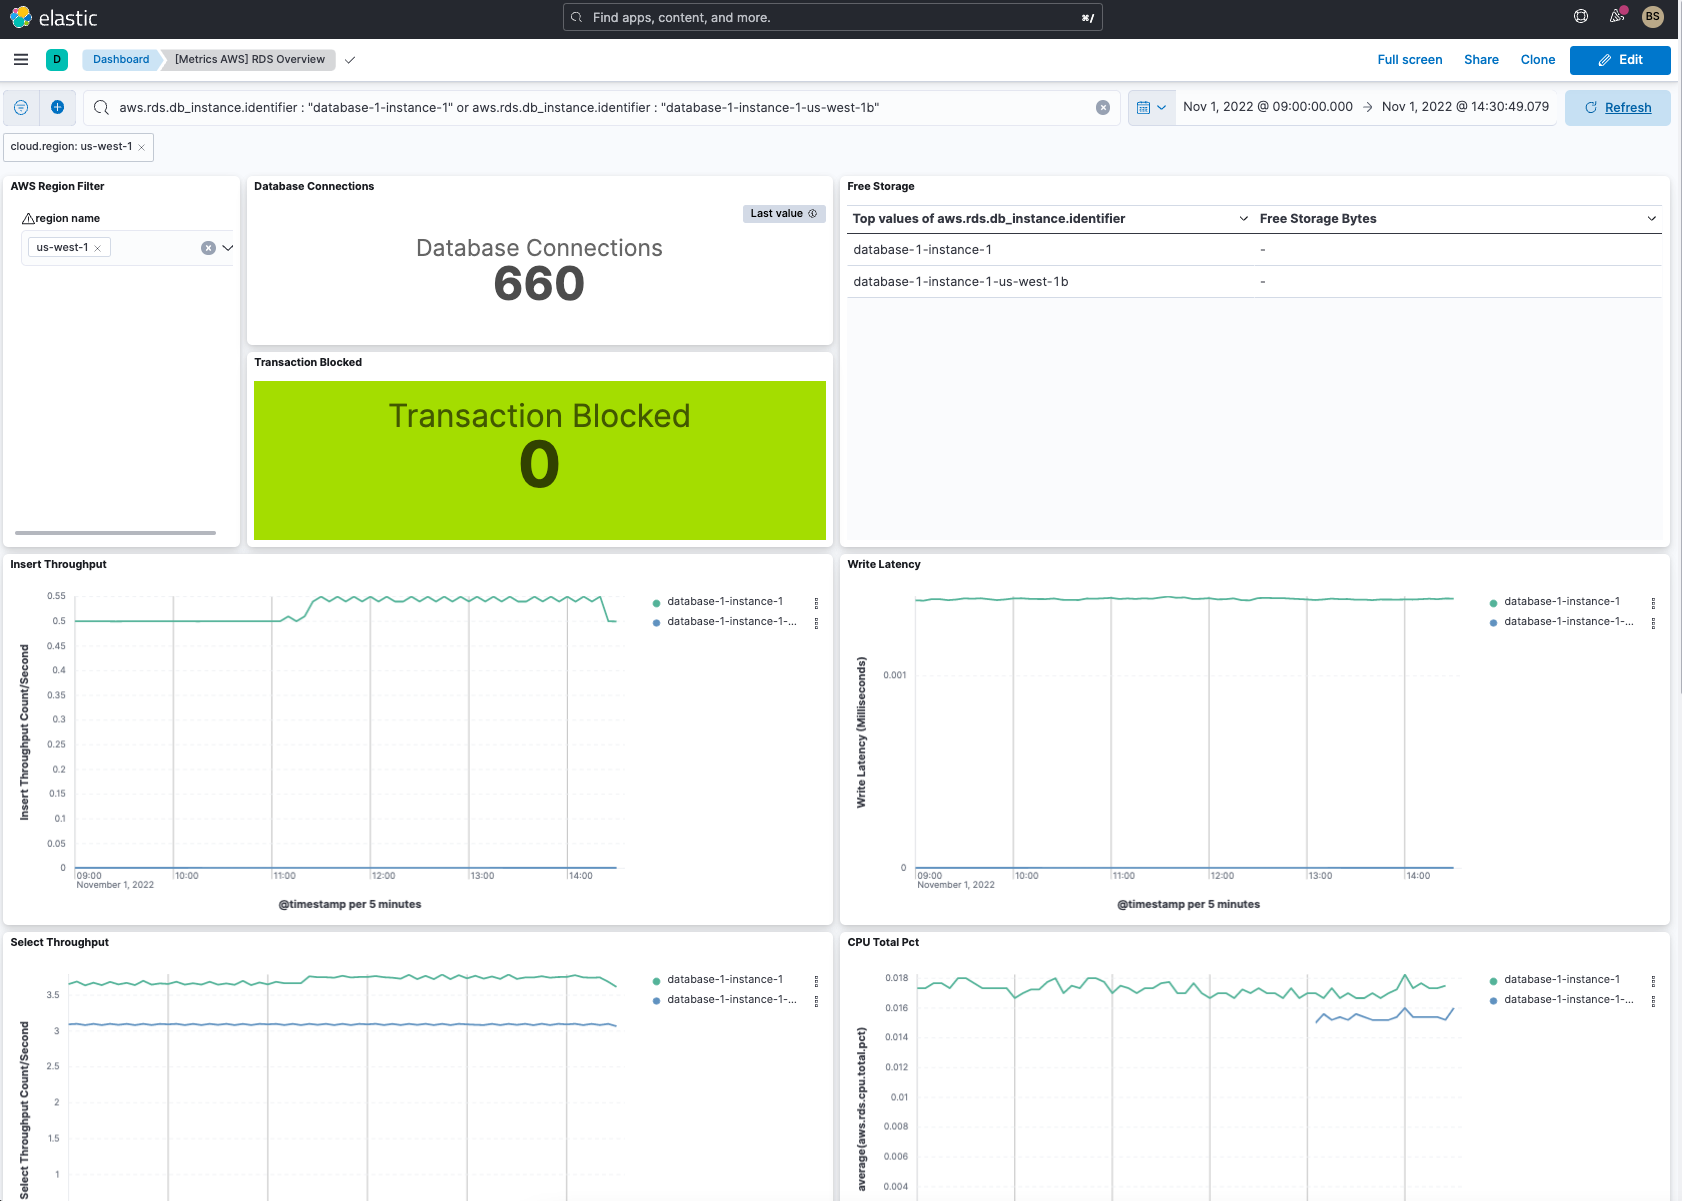
For AuroraDB, which is deployed in RDS, we’ve filtered for just the primary and secondary instances of Aurora on the dashboard.
Just as with EC2, ELB, most RDS metrics from Cloudwatch are also available to create new charts and graphs. In this dashboard, we’ve narrowed it down to showing:
1: Insert throughput & Select throughput
2: Write latency
3: CPU usage
4: General number of connections during the timeframe
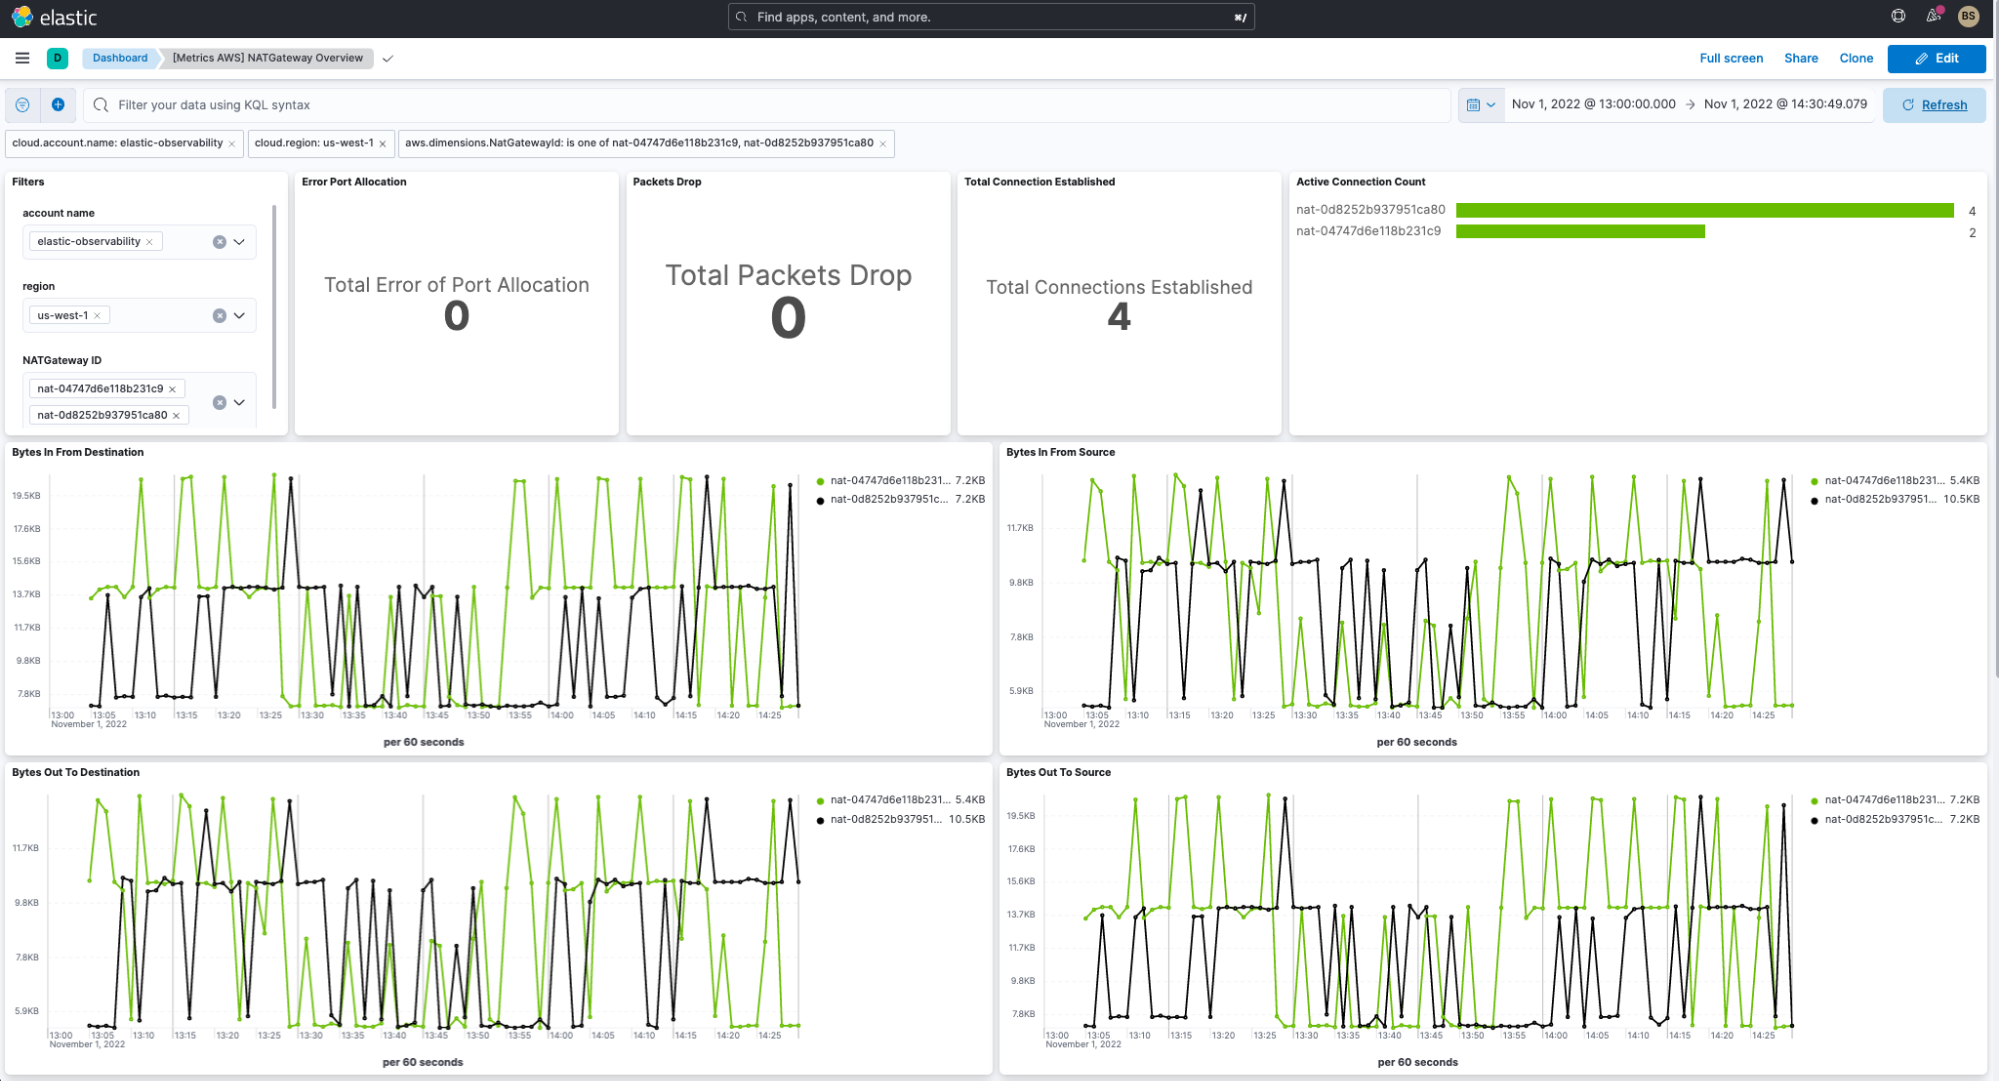
We filtered to look only at our 2 NAT instances which are fronting the application servers. As with the other dashboards, other metrics are available to build graphs and /charts as needed.
For the NAT dashboard we can see the following:
1: The NAT Gateways are doing well due to no packet drops
2: An expected number of active connections from the web server
3: Fairly normal set of metrics for bytes in and out
Congratulations, you have now started monitoring metrics from key AWS services for your application!
What to monitor on AWS next?
Add logs from AWS Services
Now that metrics are being monitored, you can also now add logging. There are several options for ingesting logs.
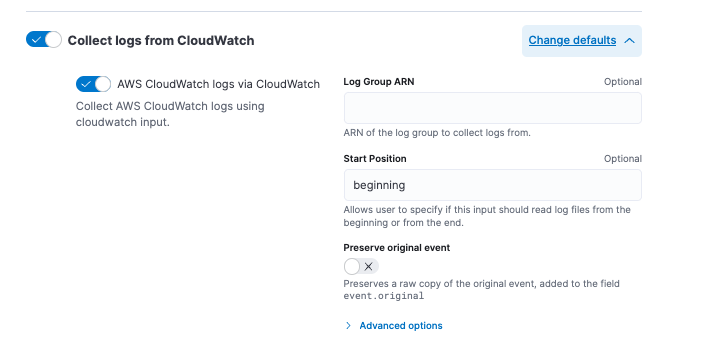
1. The AWS Integration in the Elastic Agent has logs setting. Just ensure you turn on what you wish to receive. Let’s ingest the Aurora Logs from RDS. In the Elastic agent policy, we simply turn on Collect logs from CloudWatch (see below). Next, update the agent through the Fleet management UI.
2. You can install the Lambda logs forwarder. This option will pull logs from multiple locations. See the architecture diagram below.
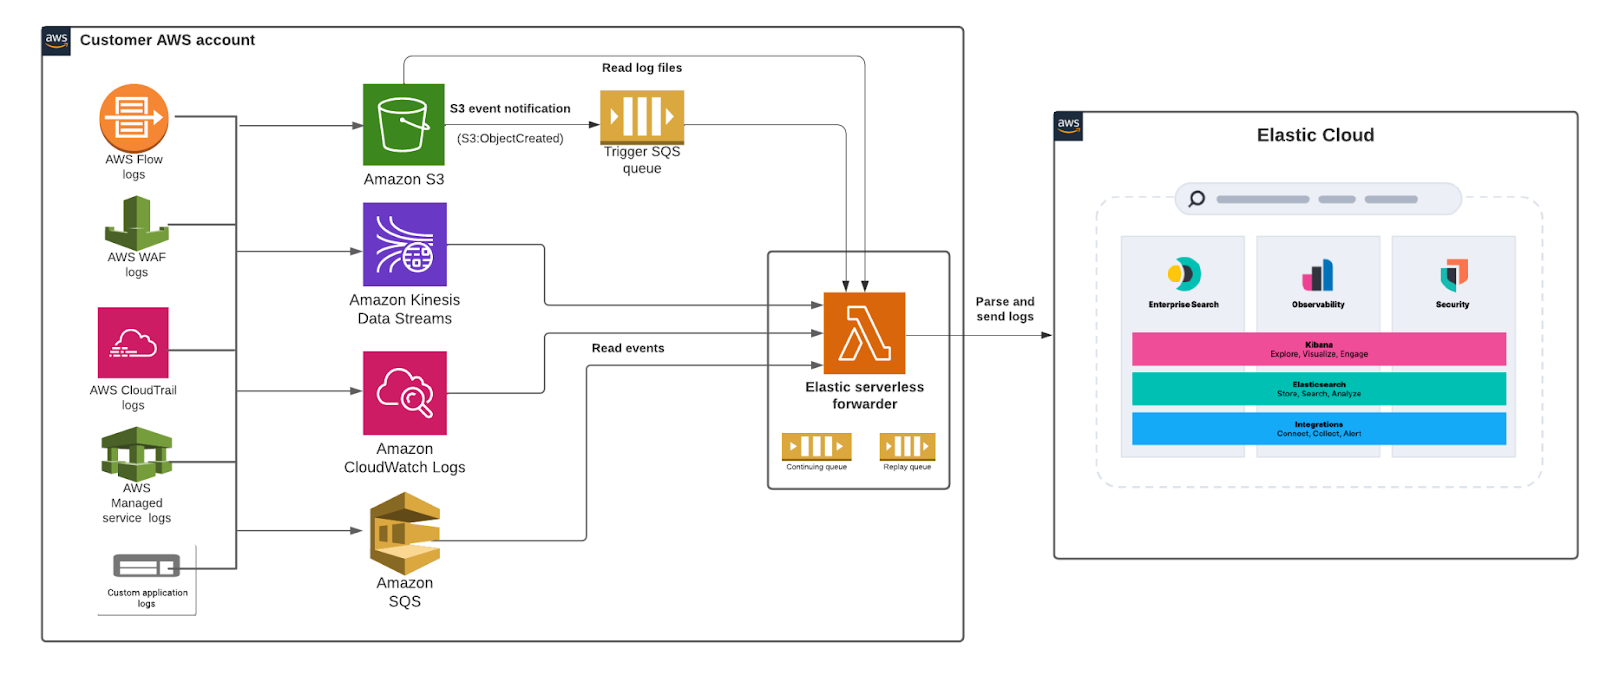
A review of this option is also found in the following blog.
Analyze your data with Elastic Machine Learning
Once metrics and logs (or either one) are in Elastic, start analyzing your data through Elastic’s ML capabilities. A great review of these features can be found here:
- Correlating APM Telemetry to determine root causes in transactions
- Introduction to Elastic Machine Learning
And there are many more videos and blogs on Elastic’s Blog.
Conclusion: Monitoring AWS service metrics with Elastic Observability is easy!
I hope you’ve gotten an appreciation for how Elastic Observability can help you monitor AWS service metrics, here’s a quick recap of lessons and what you learned:
- Elastic Observability supports ingest and analysis of AWS service metrics
- It’s easy to set up ingest from AWS Services via the Elastic Agent
- Elastic Observability has multiple out-of-the-box (OOTB) AWS service dashboards you can use to preliminarily review information, then modify for your needs
- 30+ AWS services are supported as part of AWS Integration on Elastic Observability, with more services being added regularly
- As noted in related blogs, you can analyze your AWS service metrics with Elastic’s machine learning capabilities
Start your own 7-day free trial by signing up via AWS Marketplace and quickly spin up a deployment in minutes on any of the Elastic Cloud regions on AWS around the world. Your AWS Marketplace purchase of Elastic will be included in your monthly consolidated billing statement and will draw against your committed spend with AWS.
The release and timing of any features or functionality described in this post remain at Elastic's sole discretion. Any features or functionality not currently available may not be delivered on time or at all.

