Using Elastic to observe GKE Autopilot clusters
Elastic Agent provides a new observability option for fully managed GKE clusters

Elastic has formally supported Google Kubernetes Engine (GKE) since January 2020, when Elastic Cloud on Kubernetes was announced. Since then, Google has expanded GKE, with new service offerings and delivery mechanisms. One of those new offerings is GKE Autopilot. Where GKE is a managed Kubernetes environment, GKE Autopilot is a mode of Kubernetes operation where Google manages your cluster configuration, scaling, security, and more. It is production ready and removes many of the challenges associated with tasks like workload management, deployment automation, and scalability rules. Autopilot lets you focus on building and deploying your application while Google manages everything else.
Elastic is committed to supporting Google Kubernetes Engine (GKE) in all of its delivery modes. In October, during the Google Cloud Next ‘22 event, we announced our intention to integrate and certify Elastic Agent on Anthos, Autopilot, Google Distributed Cloud, and more.
Since that event, we have worked together with Google to get the Elastic Agent certified for use on Anthos, but we didn’t stop there.
Today we are happy to announce that we have been certified for operation on GKE Autopilot.
Hands on with Elastic and GKE Autopilot
Kubernetes observability has never been easier
To show how easy it is to get started with Autopilot and Elastic, let's walk through deploying the Elastic Agent on an Autopilot cluster. I’ll show how easy it is to set up and monitor an Autopilot cluster with the Elastic Agent and observe the cluster’s behavior with Kibana integrations.
One of the main differences between GKE and GKE Autopilot is that Autopilot protects the system namespace “kube-system.” To increase the stability and security of a cluster, Autopilot prevents user space workloads from adding or modifying system pods. The default configuration for Elastic Agent is to install itself into the system namespace. The majority of the changes we will make here are to convince the Elastic Agent to run in a different namespace.
Let’s get started with Elastic Stack!
While writing this article, I used the latest version of Elastic. The best way for you to get started with Elastic Observability is to:
- Get an account on Elastic Cloud and look at this tutorial to help launch your first stack, or
- Launch Elastic Cloud on your Google Account
Provisioning an Autopilot cluster and an Elastic stack
To test the agent, I first deployed the recommended, default GKE Autopilot cluster. Elastic’s GKE integration supports kube-state-metrics (KSM), which will increase the number of reported metrics available for reporting and dashboards. Like the Elastic Agent, KSM defaults to running in the system namespace, so I modified its manifest to work with Autopilot. For my testing, I also deployed a basic Elastic stack on Elastic Cloud in the same Google region as my Autopilot cluster. I used a fresh cluster deployed on Elastic’s managed service (ESS), but the process is the same if you are using an Elastic Cloud subscription purchased through the Google marketplace.
Adding Elastic Observability to GKE Autopilot
Because this is a brand new deployment, Elastic suggests adding integrations to it. Let’s add the Kubernetes integration into the new deployment:

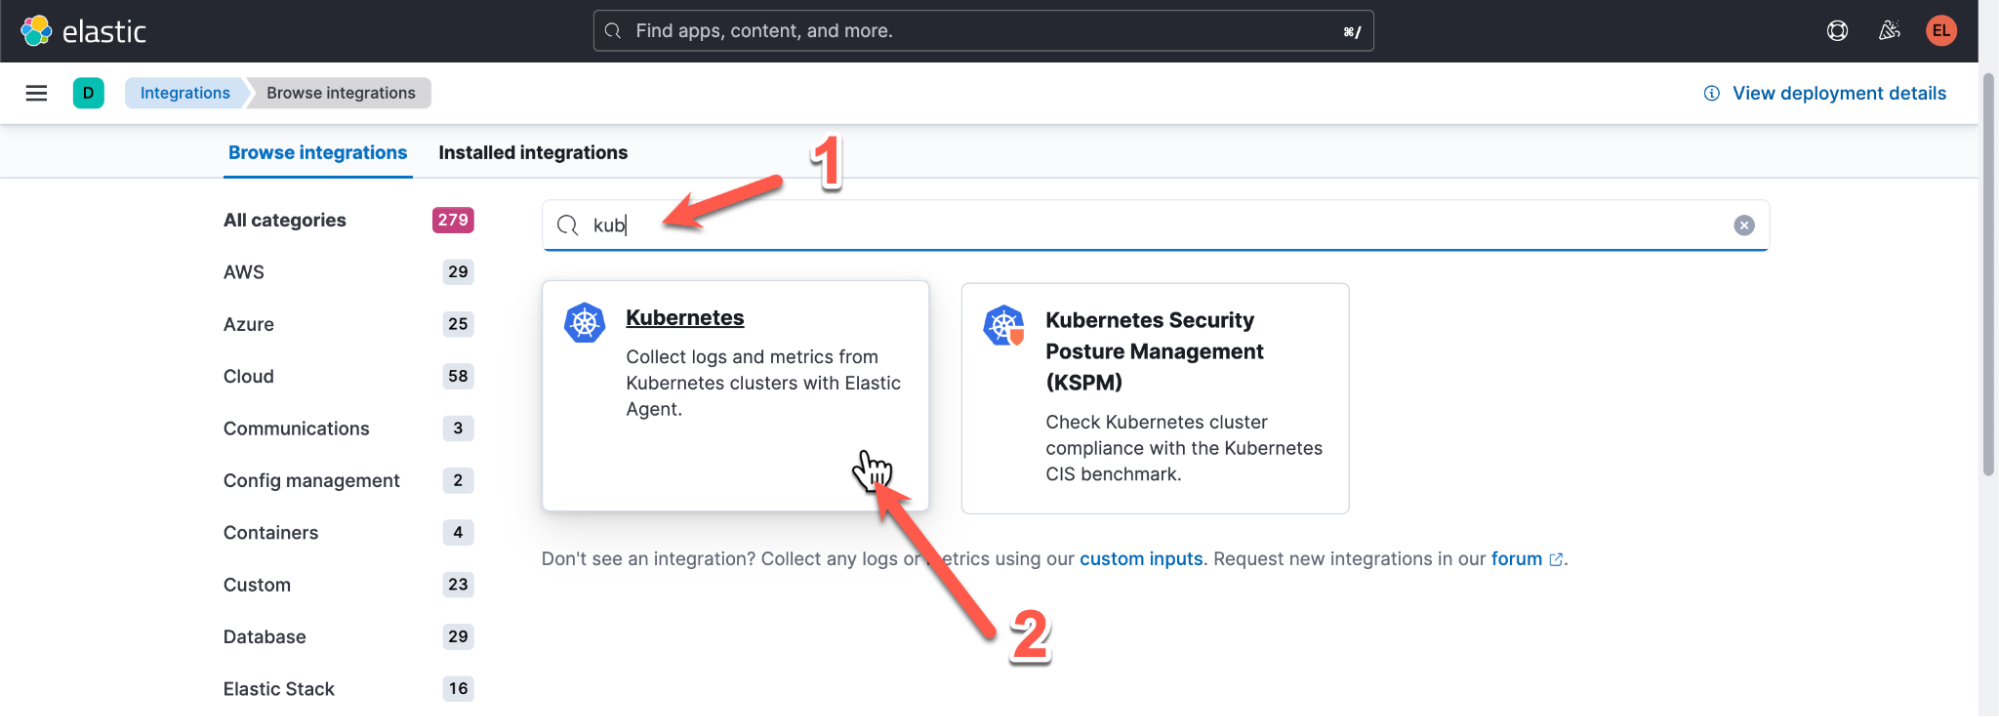
Elastic offers hundreds of integrations; filter the list by typing “kub” into the search bar (1) and then click the Kubernetes integration (2).
The Kubernetes integration page gives you an overview of the integration and lets you manage the Kubernetes clusters you want to observe. We haven’t added a cluster yet, so I clicked “Add Kubernetes” to add the first integration.

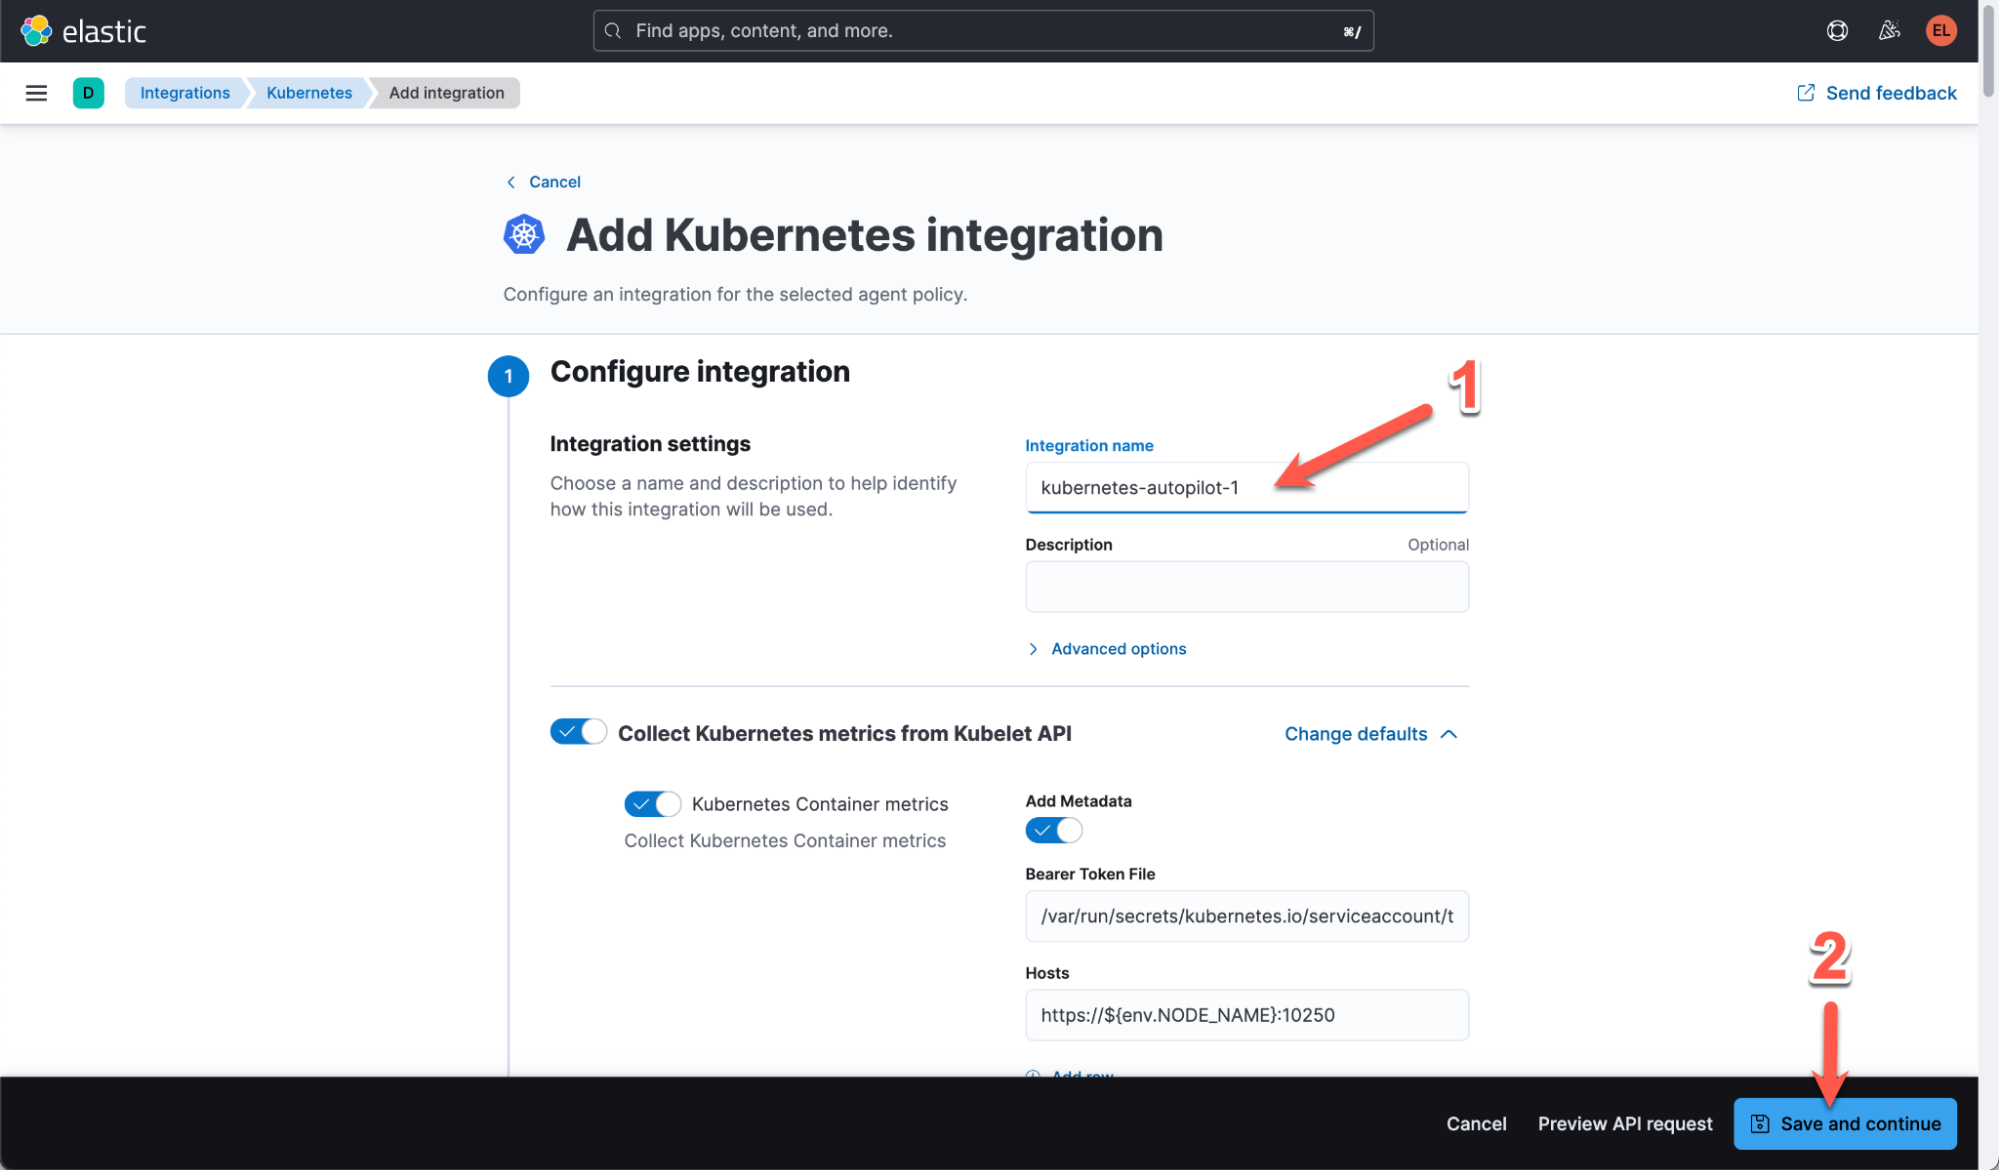
I changed the integration name to reflect the Kubernetes offering type and then clicked “Save and continue” to accept the integration defaults.
At this point, an Agent policy has been created. Now it’s time to install the agent. I clicked on the “Kubernetes” integration.

Then I selected the “integration policies” tab (1) and clicked “Add agent” (2).

Finally, I downloaded the full manifest for a standard GKE environment.
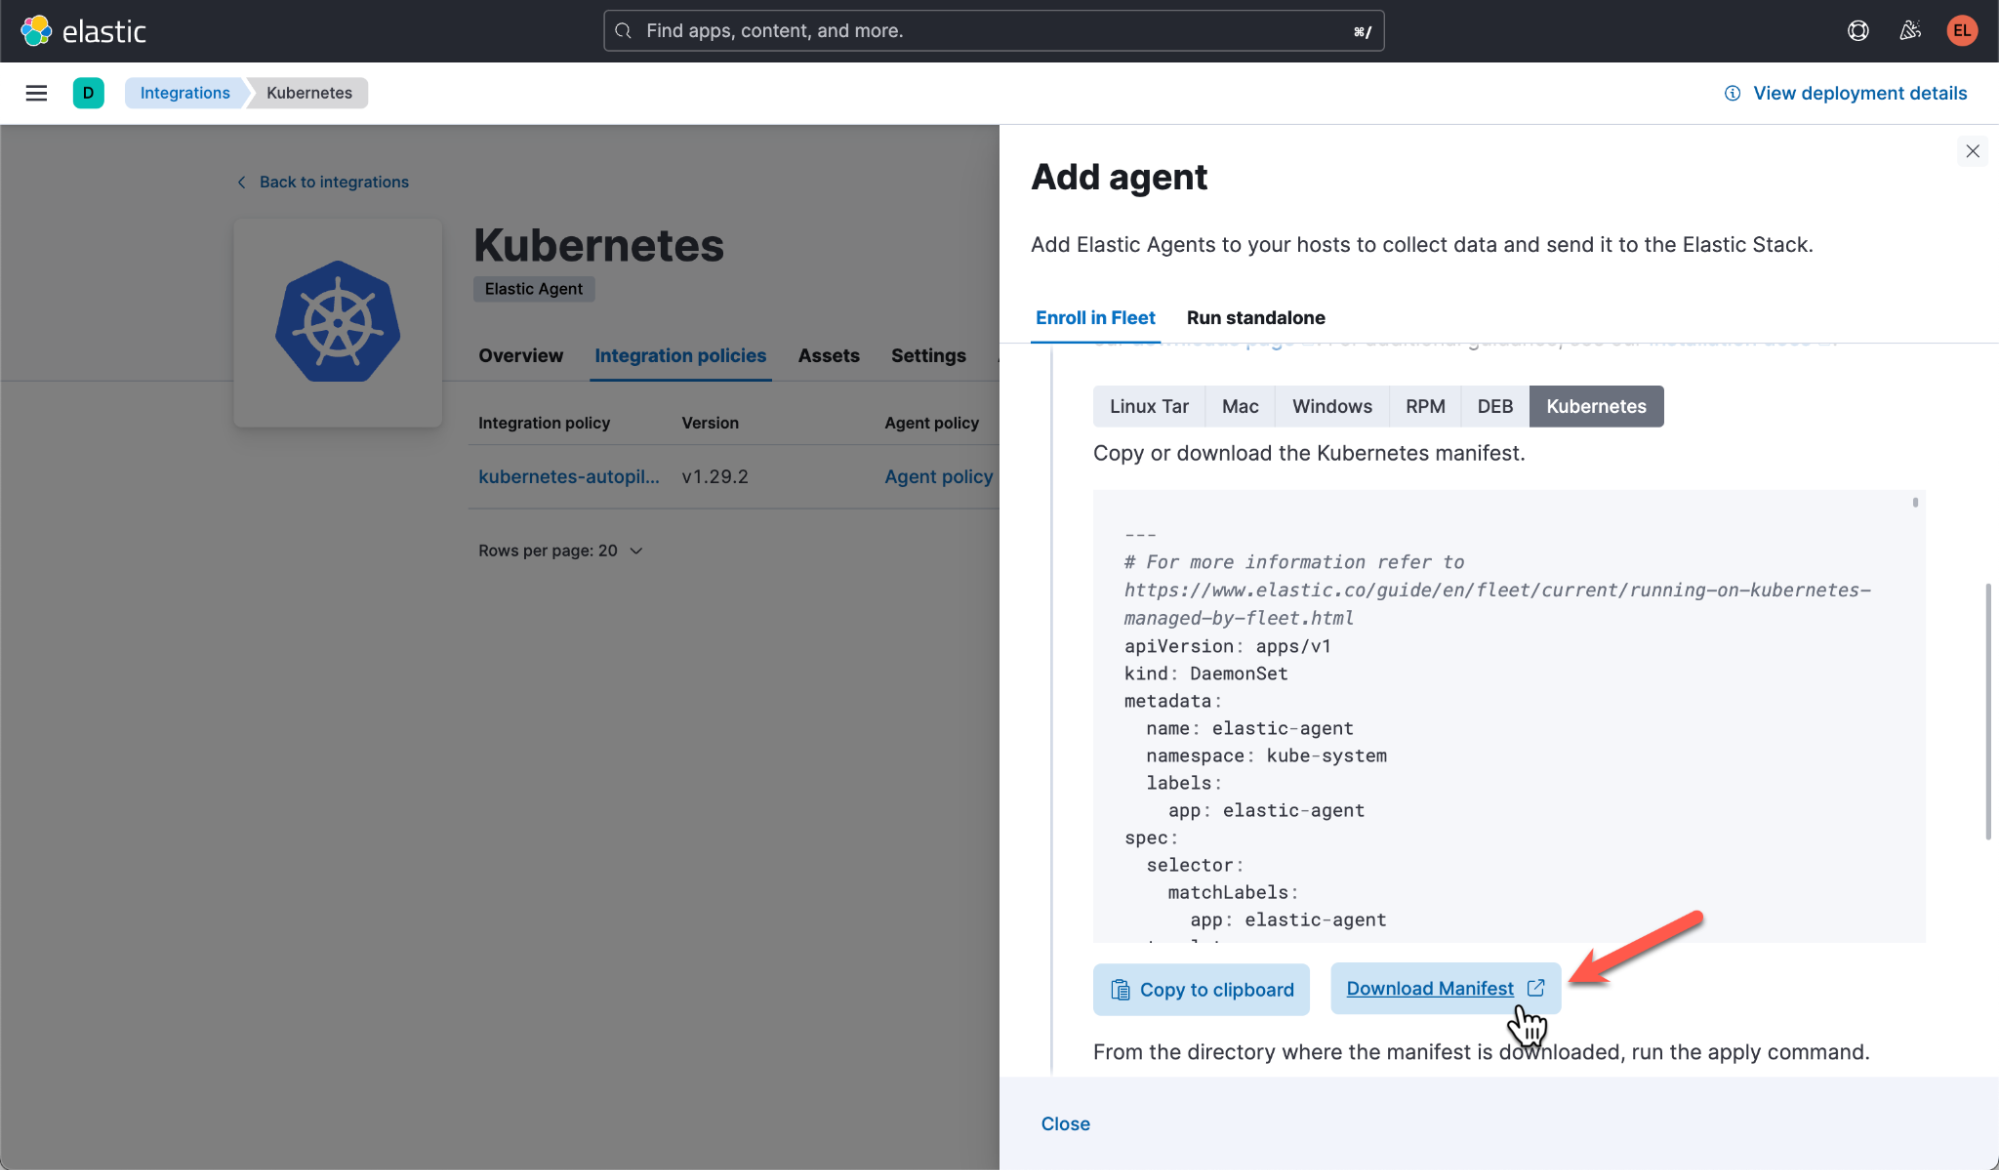
We won’t be using this manifest directly, but it contains many of the values that we will need to deploy the agent on Autopilot in the next section.
The Elastic stack is ready and waiting for the Autopilot logs, metrics, and events. It’s time to connect Autopilot to this deployment using the Elastic Agent for GKE.
Connect Autopilot to Elastic
From the Google cloud terminal, I downloaded and edited the Elastic Agent manifest for GKE Autopilot.
$ curl -o elastic-agent-managed-gke-autopilot.yaml \
https://github.com/elastic/elastic-agent/blob/autopilotdocumentaton/docs/manifests/elastic-agent-managed-gke-autopilot.yaml
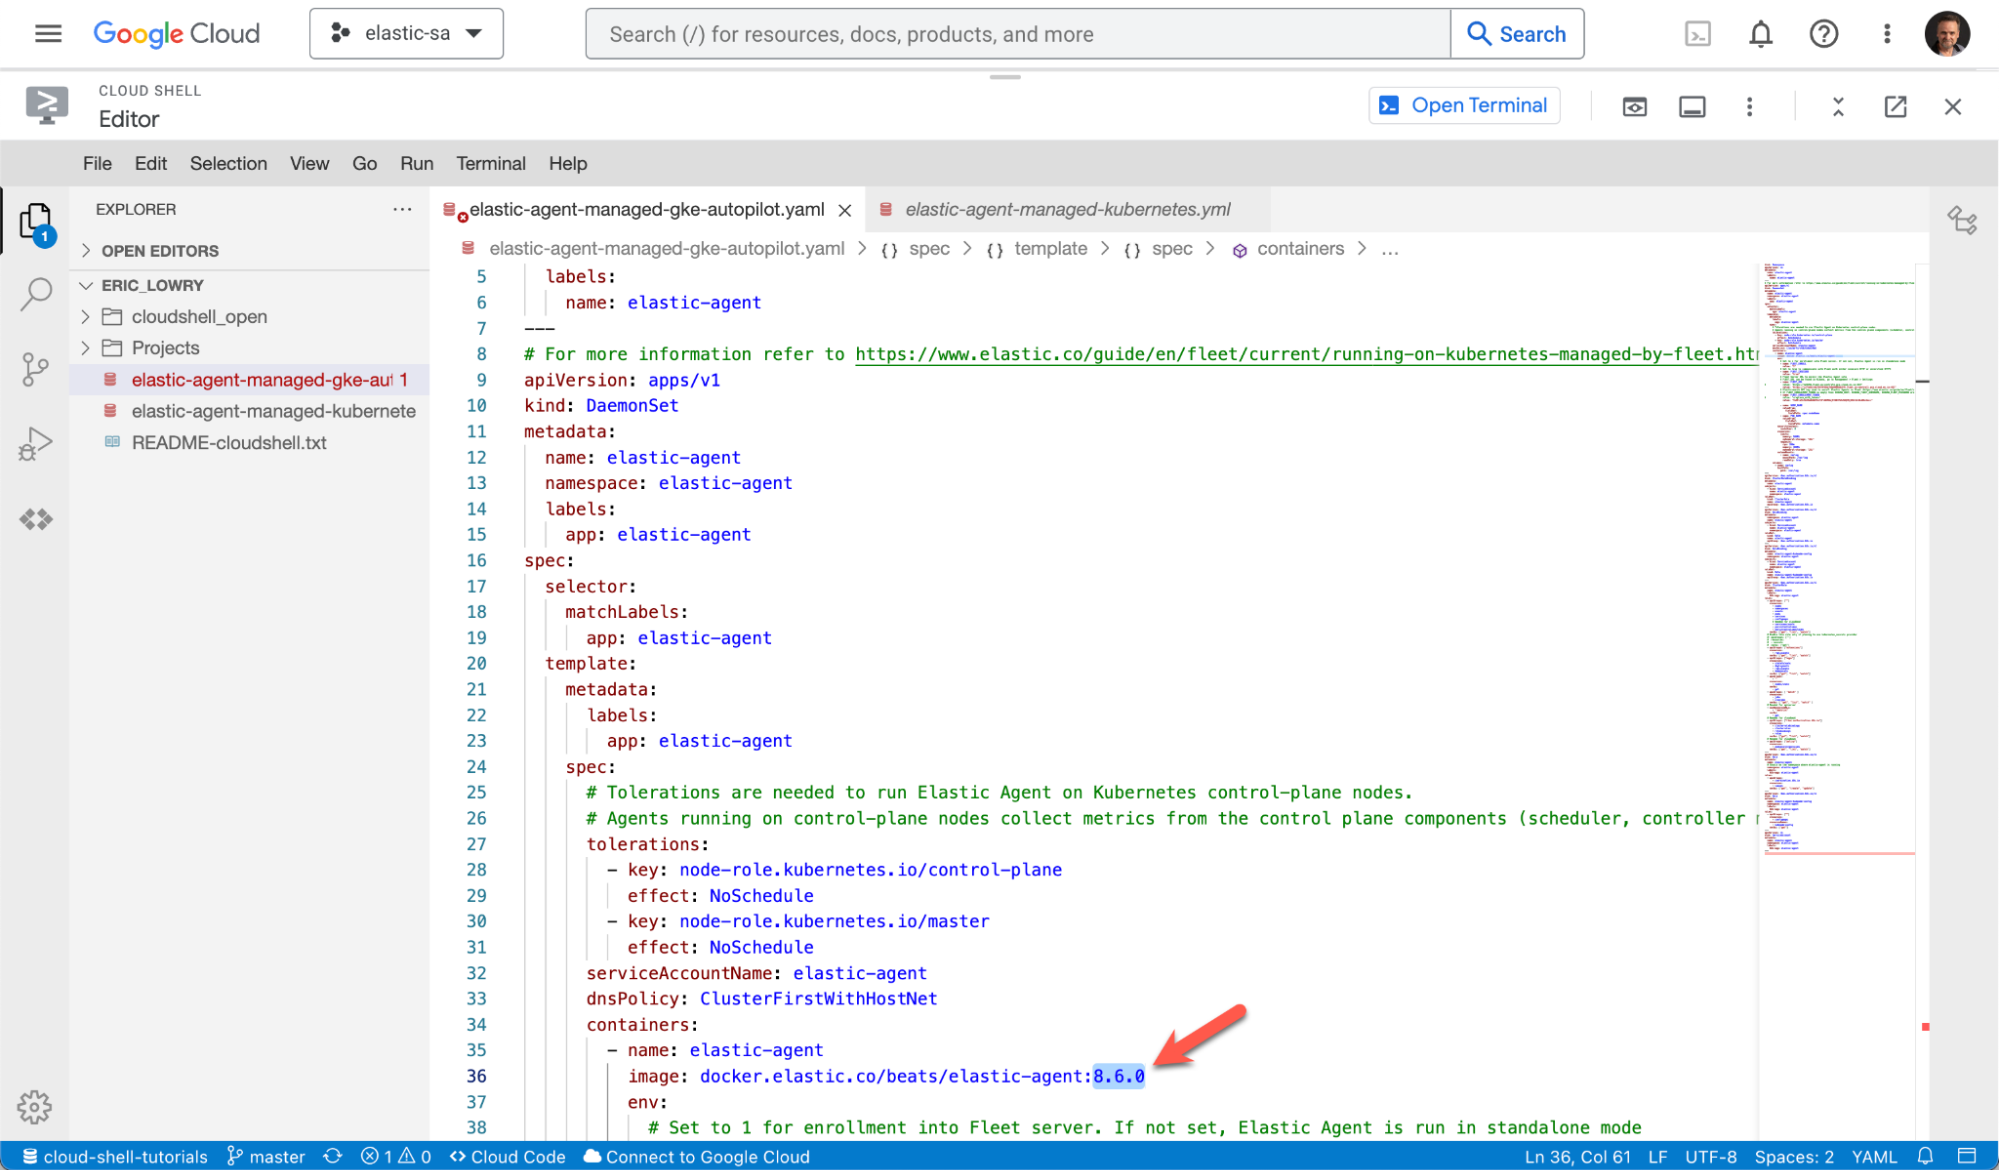
I used the cloud shell editor to configure the manifest for my Autopilot and Elastic clusters. For example, I updated the following:
     containers:
       - name: elastic-agent
image: docker.elastic.co/beats/elastic-agent:8.5.3I also changed the agent to the version of Elastic that I installed (8.6.0).
From the Integration manifest I downloaded earlier, I copied the values for FLEET_URL and FLEET_ENROLLMENT_TOKEN into this YAML file.
Now it’s time to apply the updated manifest to the Autopilot instance.
Before I commit, I always like to see what’s going to be created (and check for syntax errors) with a dry run.
$ clear
$ kubectl apply --dry-run="client" -f elastic-agent-managed-gke-autopilot.yaml
Everything looks good, so I’ll do it for real this time.
$ clear
$ kubectl apply -f elastic-agent-managed-gke-autopilot.yaml
After several minutes, metrics will start flowing from the Autopilot cluster directly into the Elastic deployment.
Adding a workload to the Autopilot cluster
Observing an Autopilot cluster without a workload is boring, so I deployed a modified version of Google’s Hipster Shop (which includes OpenTelemetry reporting):
$ git clone https://github.com/bshetti/opentelemetry-microservices-demo
$ cd opentelemetry-microservices-demo
$ nano ./deploy-with-collector-k8s/otelcollector.yamlTo get the application’s telemetry talking to our Elastic stack, I replaced all instances of the exporter type from HTTP (otlphttp/elastic) to gRPC (otlp/elastic). I then replaced OTEL_EXPORTER_OTLP_ENDPOINT with my APM endpoint and I replaced OTEL_EXPORTER_OTLP_HEADERS with my APM OTEL Bearer and Token.
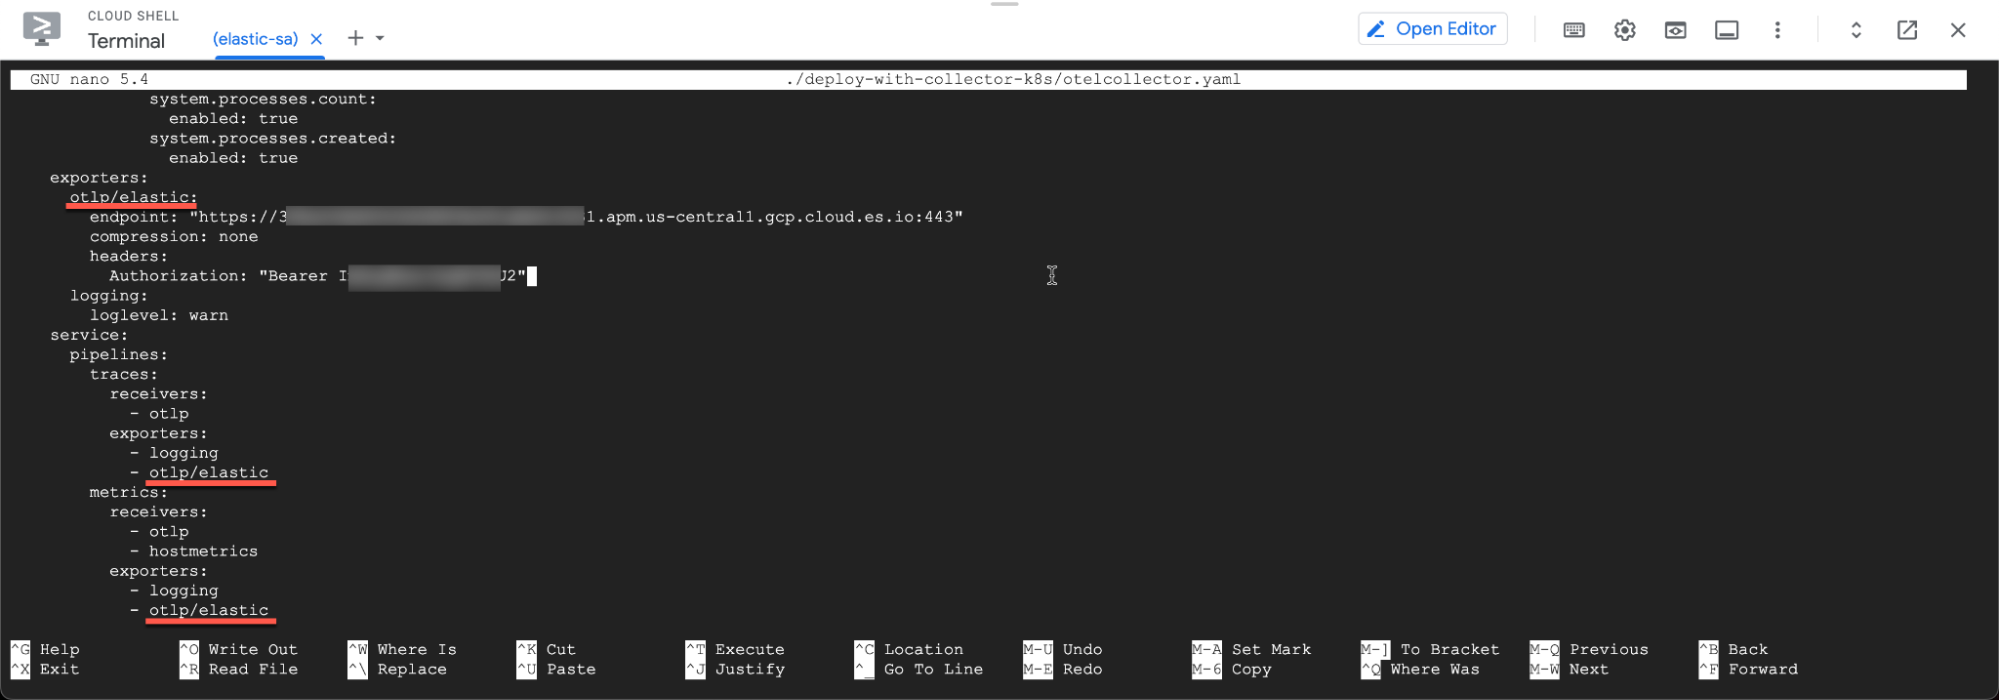
Then I deployed the Hipster Shop.
$ kubectl create -f ./deploy-with-collector-k8s/adservice.yaml
$ kubectl create -f ./deploy-with-collector-k8s/redis.yaml
$ kubectl create -f ./deploy-with-collector-k8s/cartservice.yaml
$ kubectl create -f ./deploy-with-collector-k8s/checkoutservice.yaml
$ kubectl create -f ./deploy-with-collector-k8s/currencyservice.yaml
$ kubectl create -f ./deploy-with-collector-k8s/emailservice.yaml
$ kubectl create -f ./deploy-with-collector-k8s/frontend.yaml
$ kubectl create -f ./deploy-with-collector-k8s/paymentservice.yaml
$ kubectl create -f ./deploy-with-collector-k8s/productcatalogservice.yaml
$ kubectl create -f ./deploy-with-collector-k8s/recommendationservice.yaml
$ kubectl create -f ./deploy-with-collector-k8s/shippingservice.yaml
$ kubectl create -f ./deploy-with-collector-k8s/loadgenerator.yamlOnce all of the shop’s pods were running, I deployed the OpenTelemetry collector.
$ kubectl create -f ./deploy-with-collector-k8s/otelcollector.yaml
Observe and visualize Autopilot’s metrics
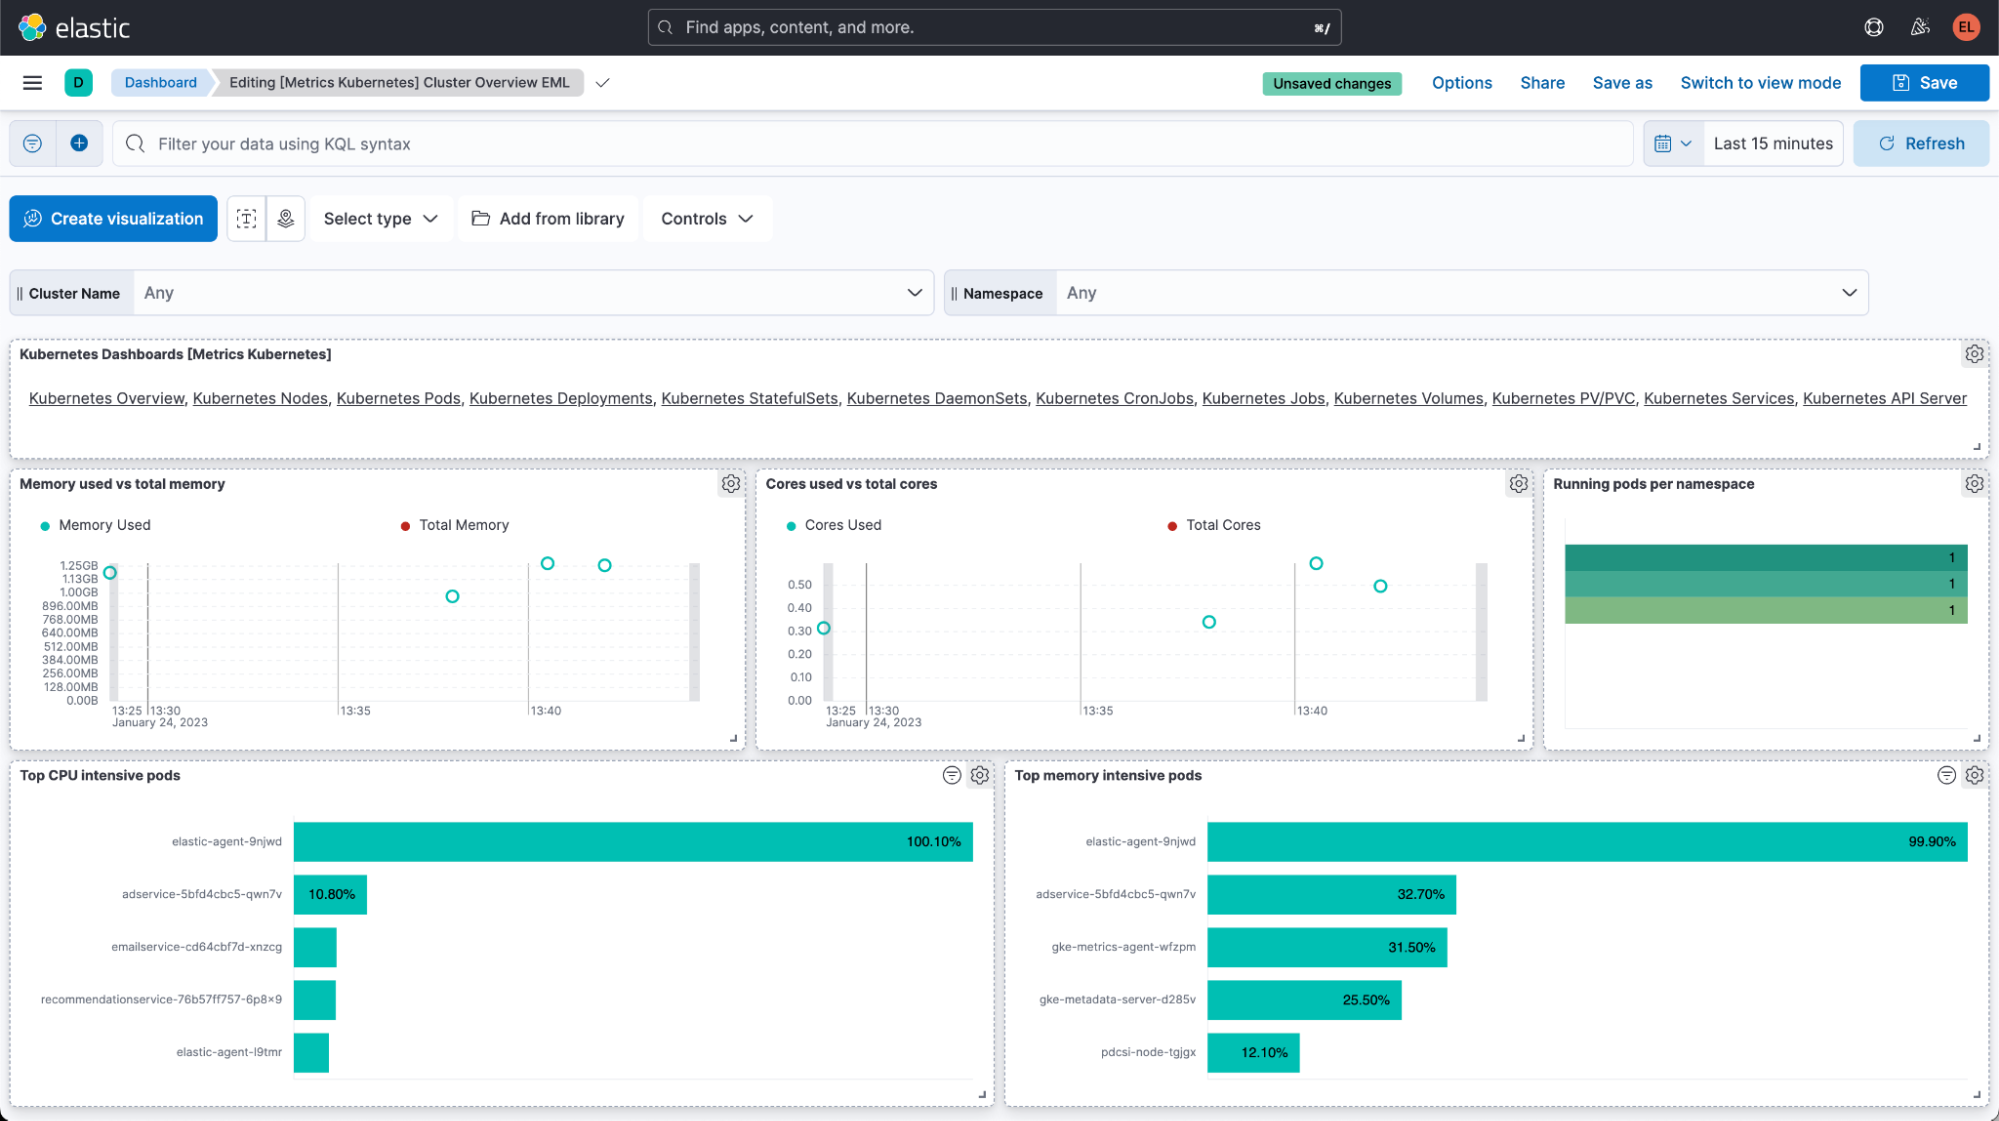
Now that we have added the Elastic Agent to our Autopilot cluster and added a workload, let's take a look at some of the Kubernetes visualizations the integration provides out of the box.
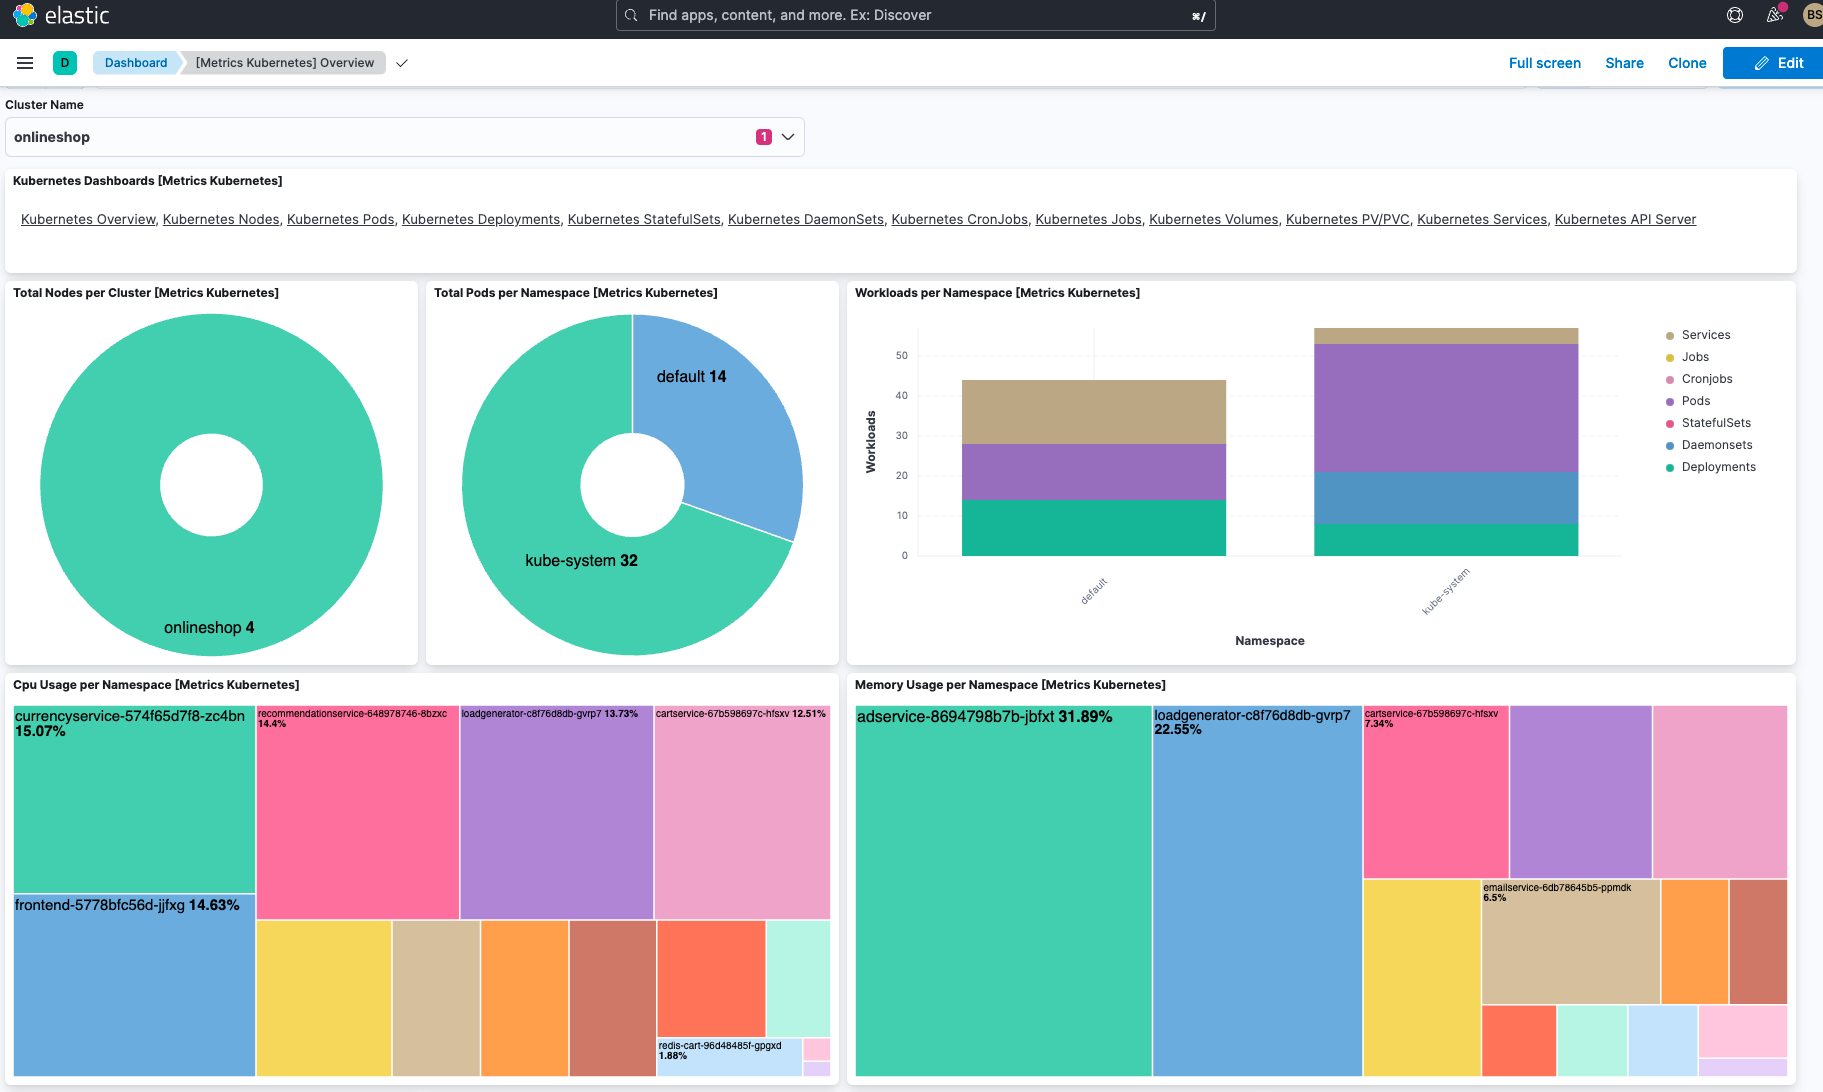
The “[Metrics Kubernetes] Overview” is a great place to start. It provides a high-level view of the resources used by the cluster and allows me to drill into more specific dashboards that I find interesting:
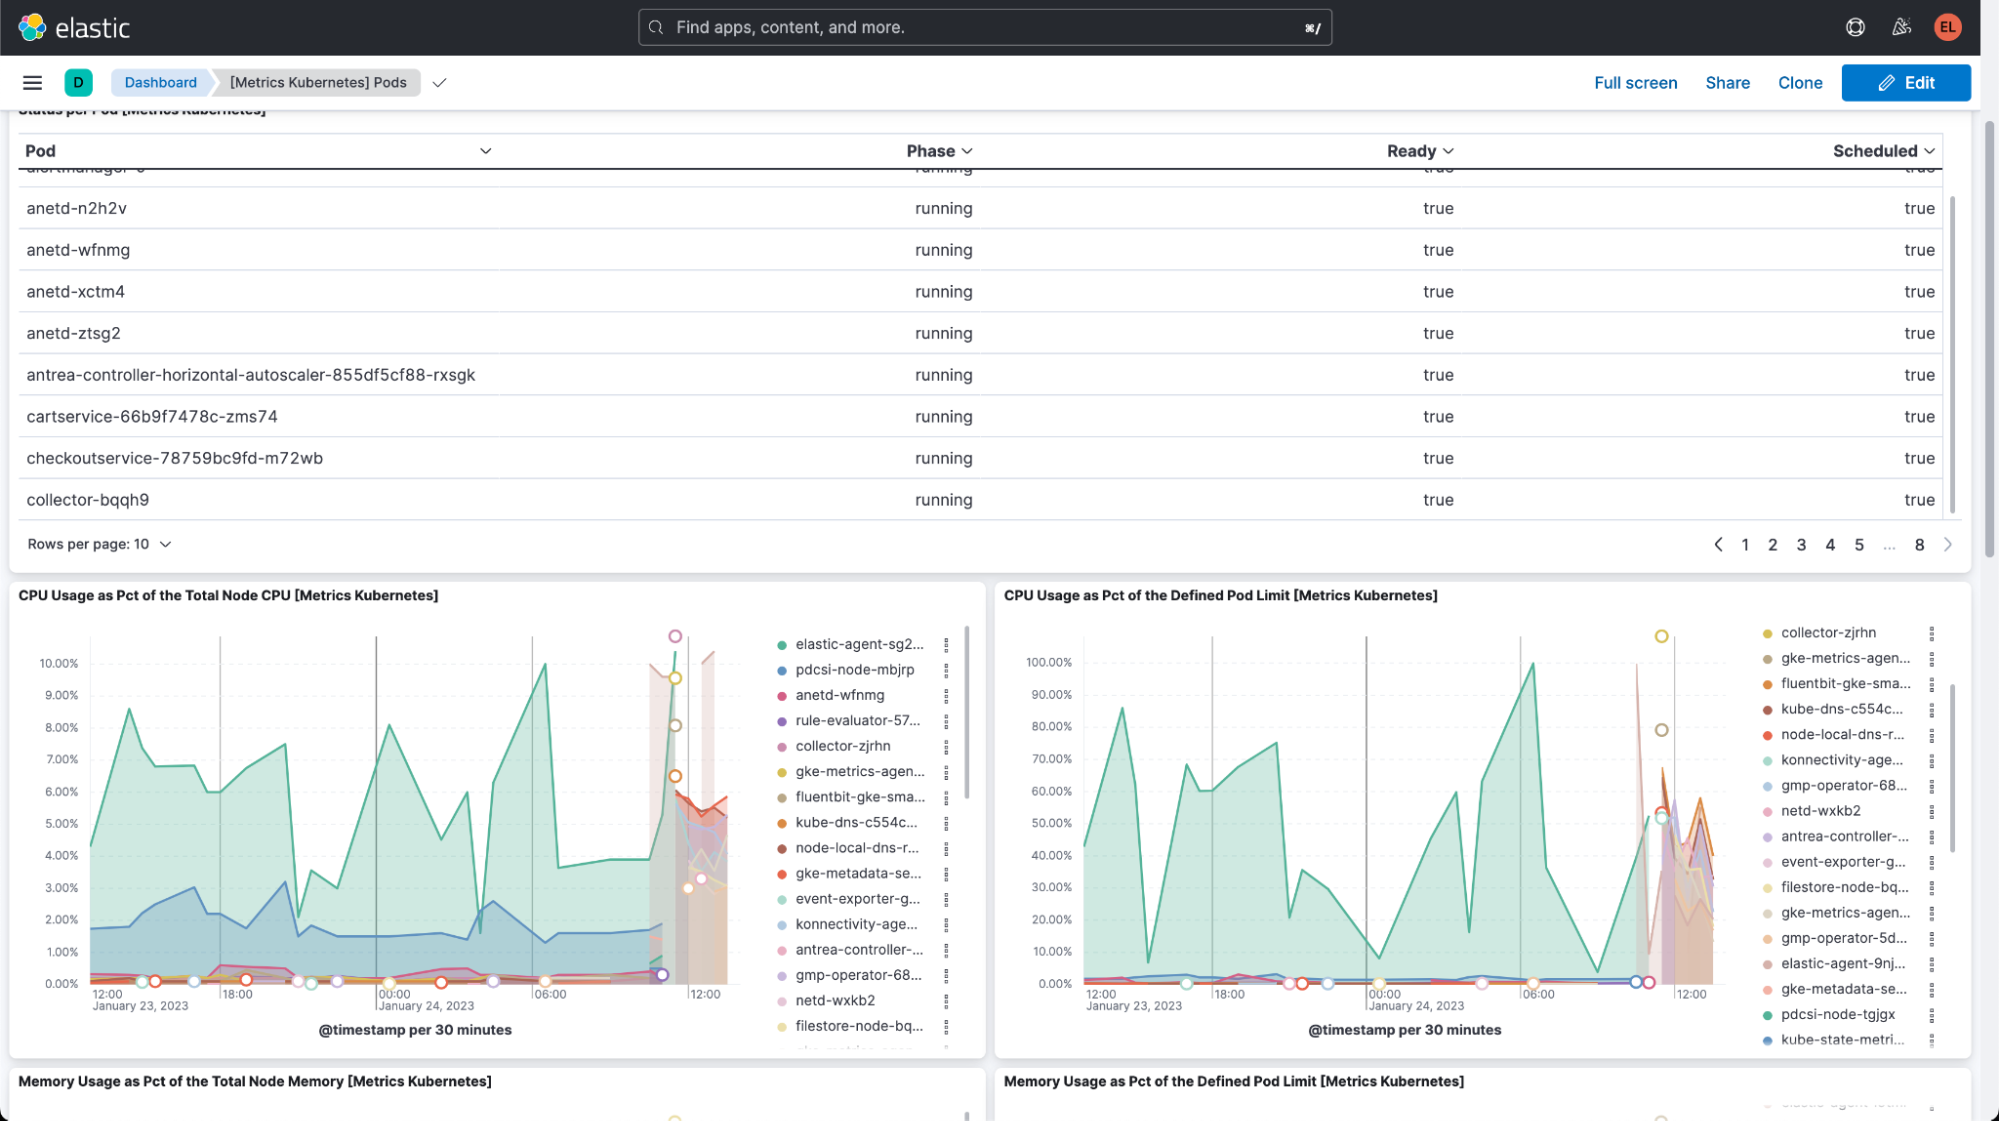
For example, the “[Metrics Kubernetes] Pods” gives me a high-level view of the pods deployed in the cluster:
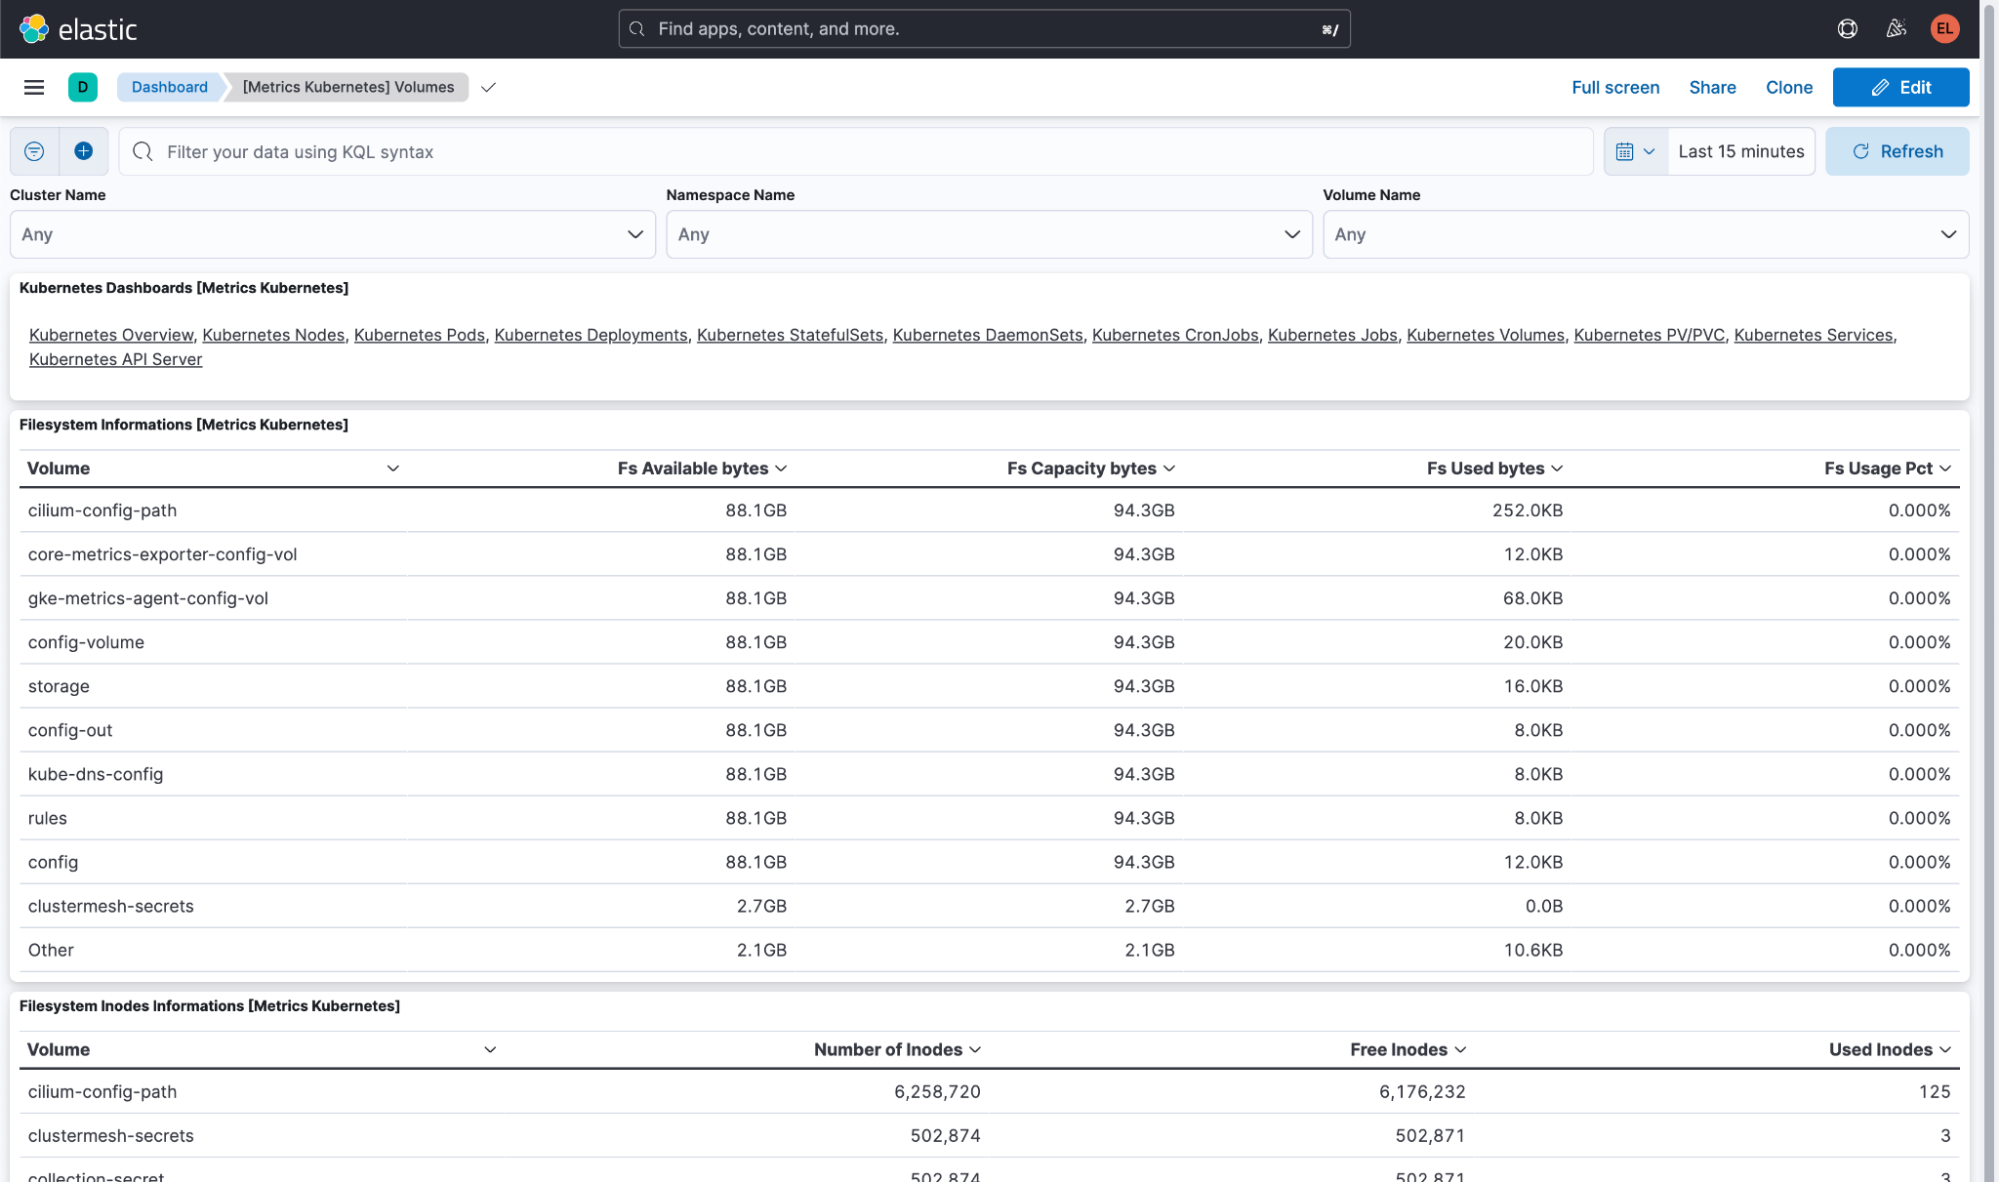
The “[Metrics Kubernetes] Volumes” gives me an in-depth view to how storage is allocated and used in the Autopilot cluster:
Creating an alert
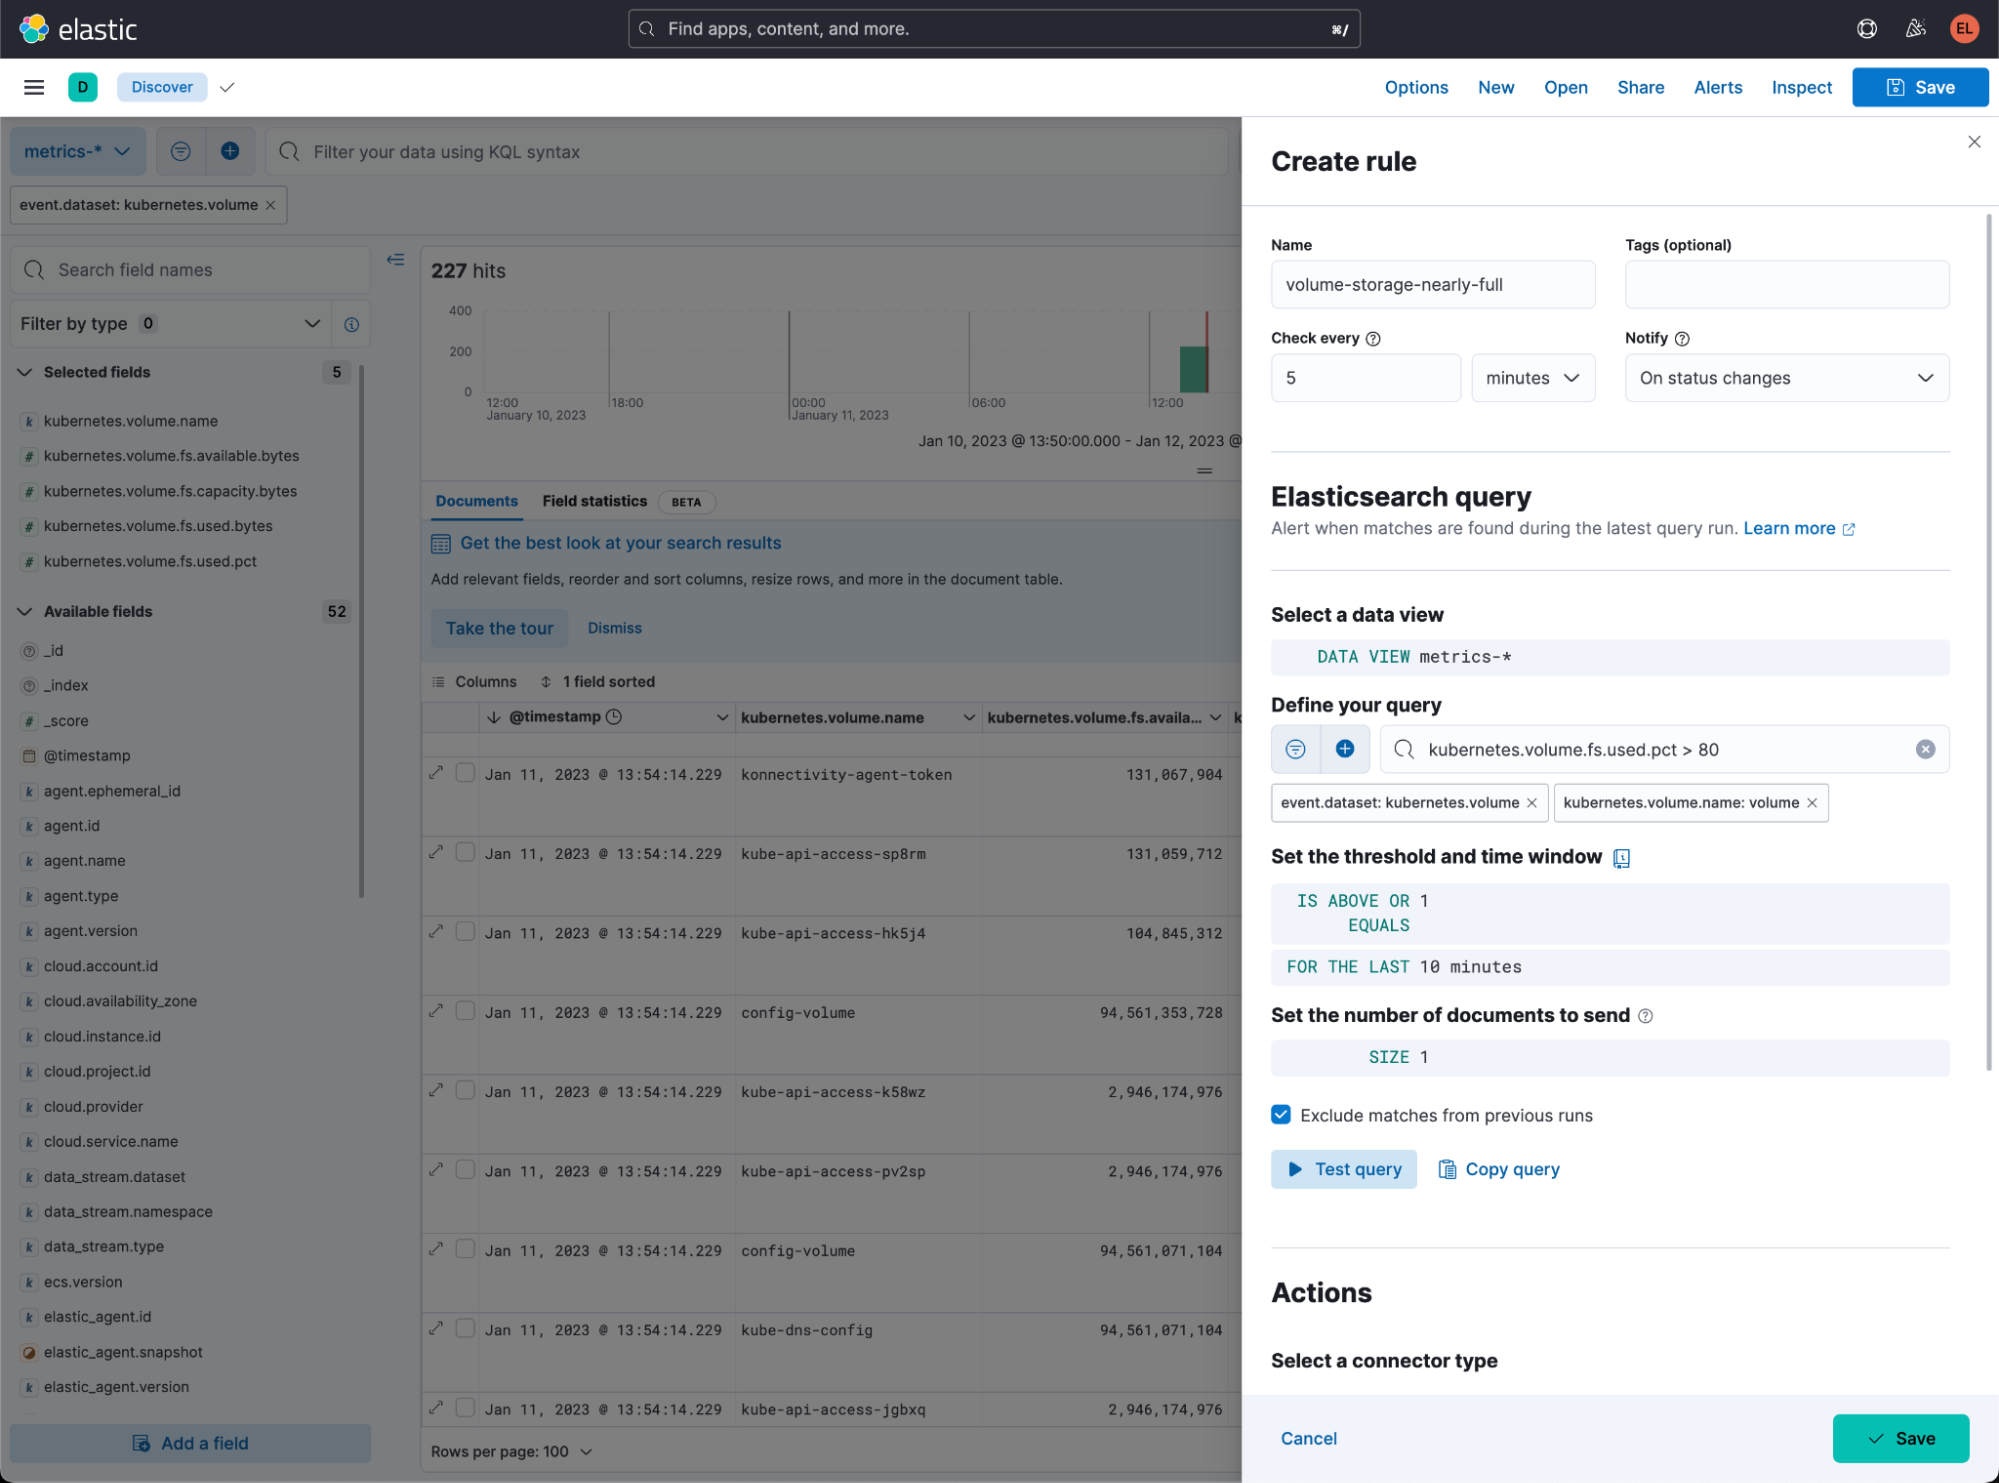
From here, I can easily discover patterns in my cluster’s behavior and even create Alerts. Here is an example of an alert to notify me if the the main storage volume (called “volume”) exceeds 80% of its allocated space:
With a little work, I created this view from the standard dashboard:
Conclusion
Today I have shown how easy it is to monitor, observe, and generate alerts on a GKE Autopilot cluster. To get more information on what is possible, see the official Elastic documentation for Autopilot observability with Elastic Agent.
Next steps
If you don’t have Elastic yet, you can get started for free with an Elastic Trial today. Get more from Elastic and Google together with a Marketplace subscription. Elastic does more than just integrate with GKE — check out the almost 300 integrations that Elastic provides.

