Managing your Kubernetes cluster with Elastic Observability
As an operations engineer (SRE, IT manager, DevOps), you’re always struggling with how to manage technology and data sprawl. Kubernetes is becoming increasingly pervasive and a majority of these deployments will be in Amazon Elastic Kubernetes Service (EKS), Google Kubernetes Engine (GKE), or Azure Kubernetes Service (AKS). Some of you may be on a single cloud while others will have the added burden of managing clusters on multiple Kubernetes cloud services. In addition to cloud provider complexity, you also have to manage hundreds of deployed services generating more and more observability and telemetry data.
The day-to-day operations of understanding the status and health of your Kubernetes clusters and applications running on them, through the logs, metrics, and traces they generate, will likely be your biggest challenge. But as an operations engineer you will need all of that important data to help prevent, predict, and remediate issues. And you certainly don’t need that volume of metrics, logs and traces spread across multiple tools when you need to visualize and analyze Kubernetes telemetry data for troubleshooting and support.
Elastic Observability helps manage the sprawl of Kubernetes metrics and logs by providing extensive and centralized observability capabilities beyond just the logging that we are known for. Elastic Observability provides you with granular insights and context into the behavior of your Kubernetes clusters along with the applications running on them by unifying all of your metrics, log, and trace data through OpenTelemetry and APM agents.
Regardless of the cluster location (EKS, GKE, AKS, self-managed) or application, Kubernetes monitoring is made simple with Elastic Observability. All of the node, pod, container, application, and infrastructure (AWS, GCP, Azure) metrics, infrastructure and application logs, along with application traces are available in Elastic Observability.
In this blog we will show:
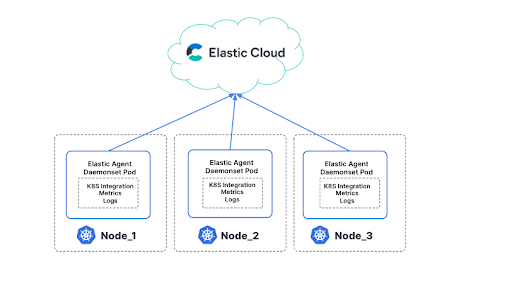
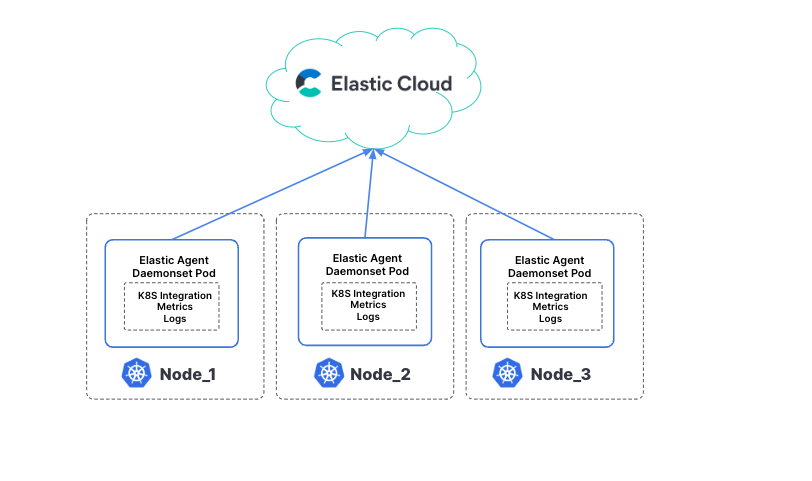
- How Elastic Cloud can aggregate and ingest metrics and log data through the Elastic Agent (easily deployed on your cluster as a DaemonSet) to retrieve logs and metrics from the host (system metrics, container stats) along with logs from all services running on top of Kubernetes.
- How Elastic Observability can bring a unified telemetry experience (logs, metrics,traces) across all your Kubernetes cluster components (pods, nodes, services, namespaces, and more).
Prerequisites and config
If you plan on following this blog, here are some of the components and details we used to set up this demonstration:
- Ensure you have an account on Elastic Cloud and a deployed stack (see instructions here).
- While we used GKE, you can use any location for your Kubernetes cluster.
- We used a variant of the ever so popular HipsterShop demo application. It was originally written by Google to showcase Kubernetes across a multitude of variants available such as the OpenTelemetry Demo App. To use the app, please go here and follow the instructions to deploy. You don’t need to deploy otelcollector for Kubernetes metrics to flow — we will cover this below.
- Elastic supports native ingest from Prometheus and FluentD, but in this blog, we are showing a direct ingest from Kubernetes cluster via Elastic Agent. There will be a follow-up blog showing how Elastic can also pull in telemetry from Prometheus or FluentD/bit.
What can you observe and analyze with Elastic?
Before we walk through the steps on getting Elastic set up to ingest and visualize Kubernetes cluster metrics and logs, let’s take a sneak peek at Elastic’s helpful dashboards.
As we noted, we ran a variant of HipsterShop on GKE and deployed Elastic Agents with Kubernetes integration as a DaemonSet on the GKE cluster. Upon deployment of the agents, Elastic starts ingesting metrics from the Kubernetes cluster (specifically from kube-state-metrics) and additionally Elastic will pull all log information from the cluster.
Visualizing Kubernetes metrics on Elastic Observability
Here are a few Kubernetes dashboards that will be available out of the box (OOTB) on Elastic Observability.
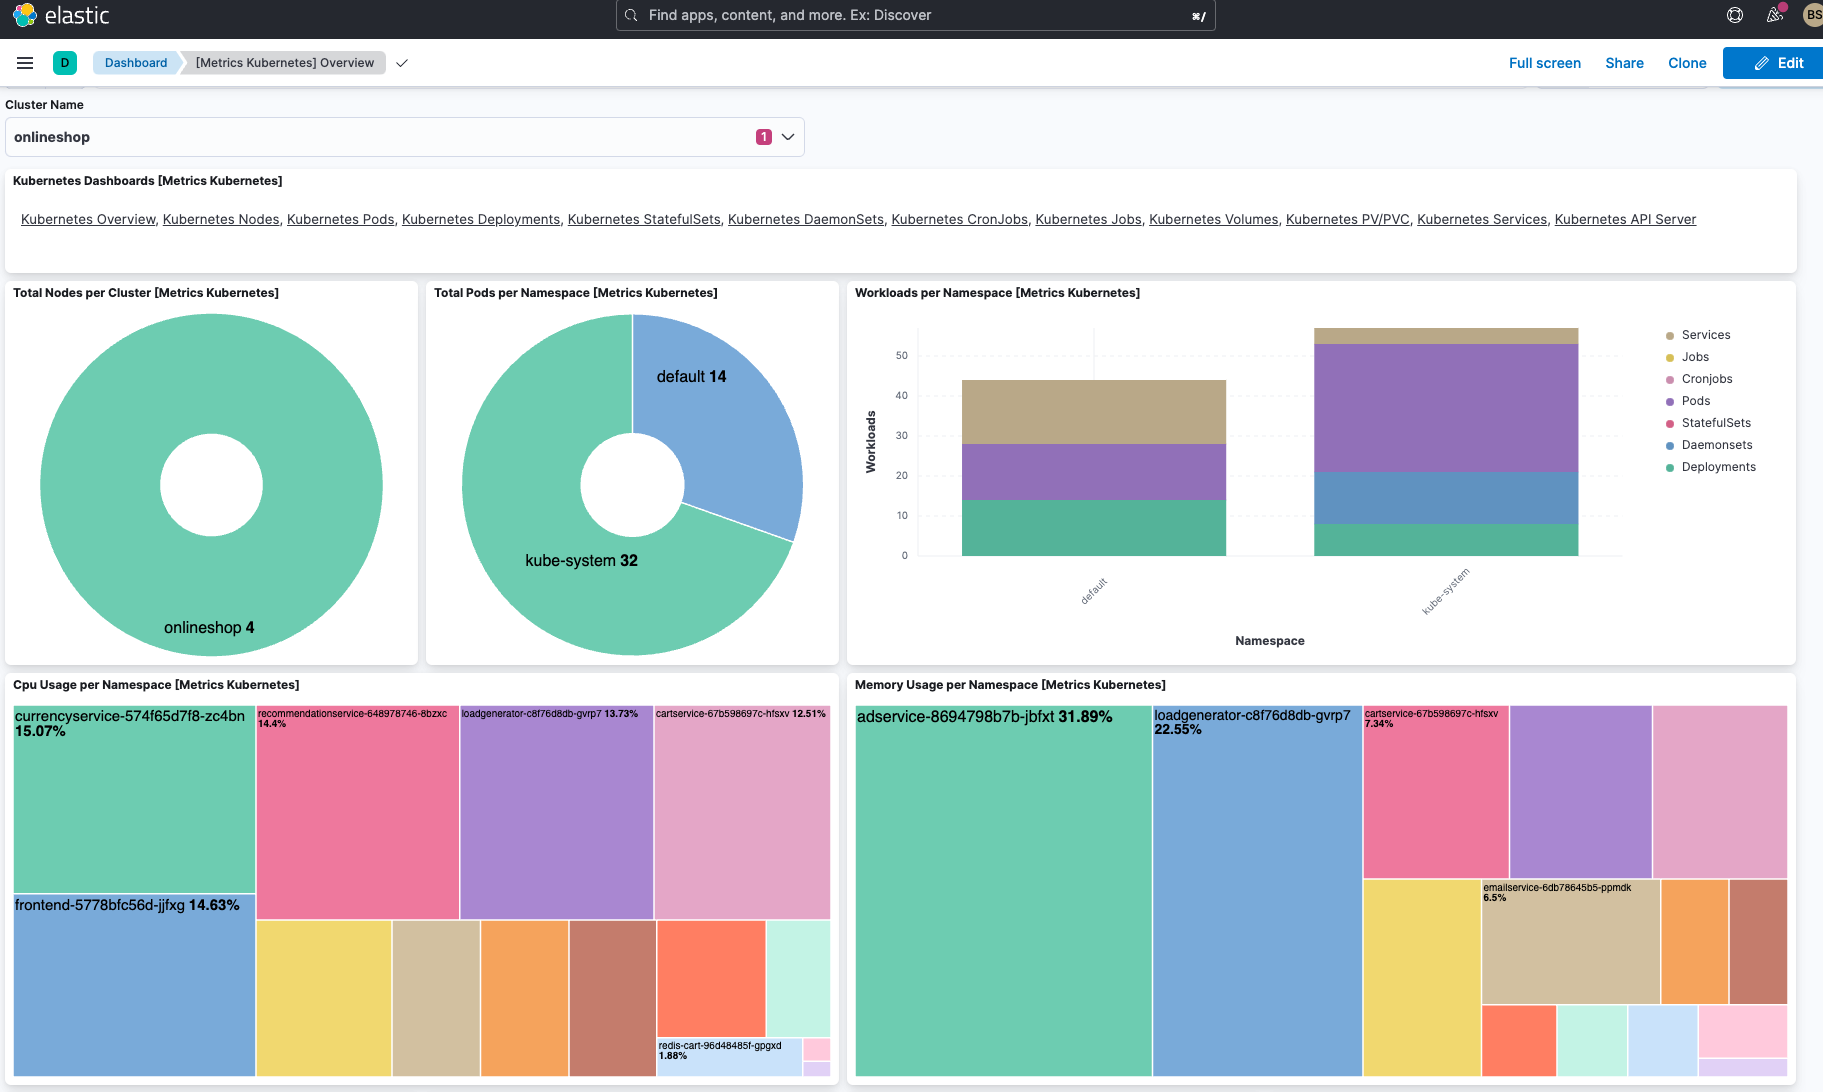
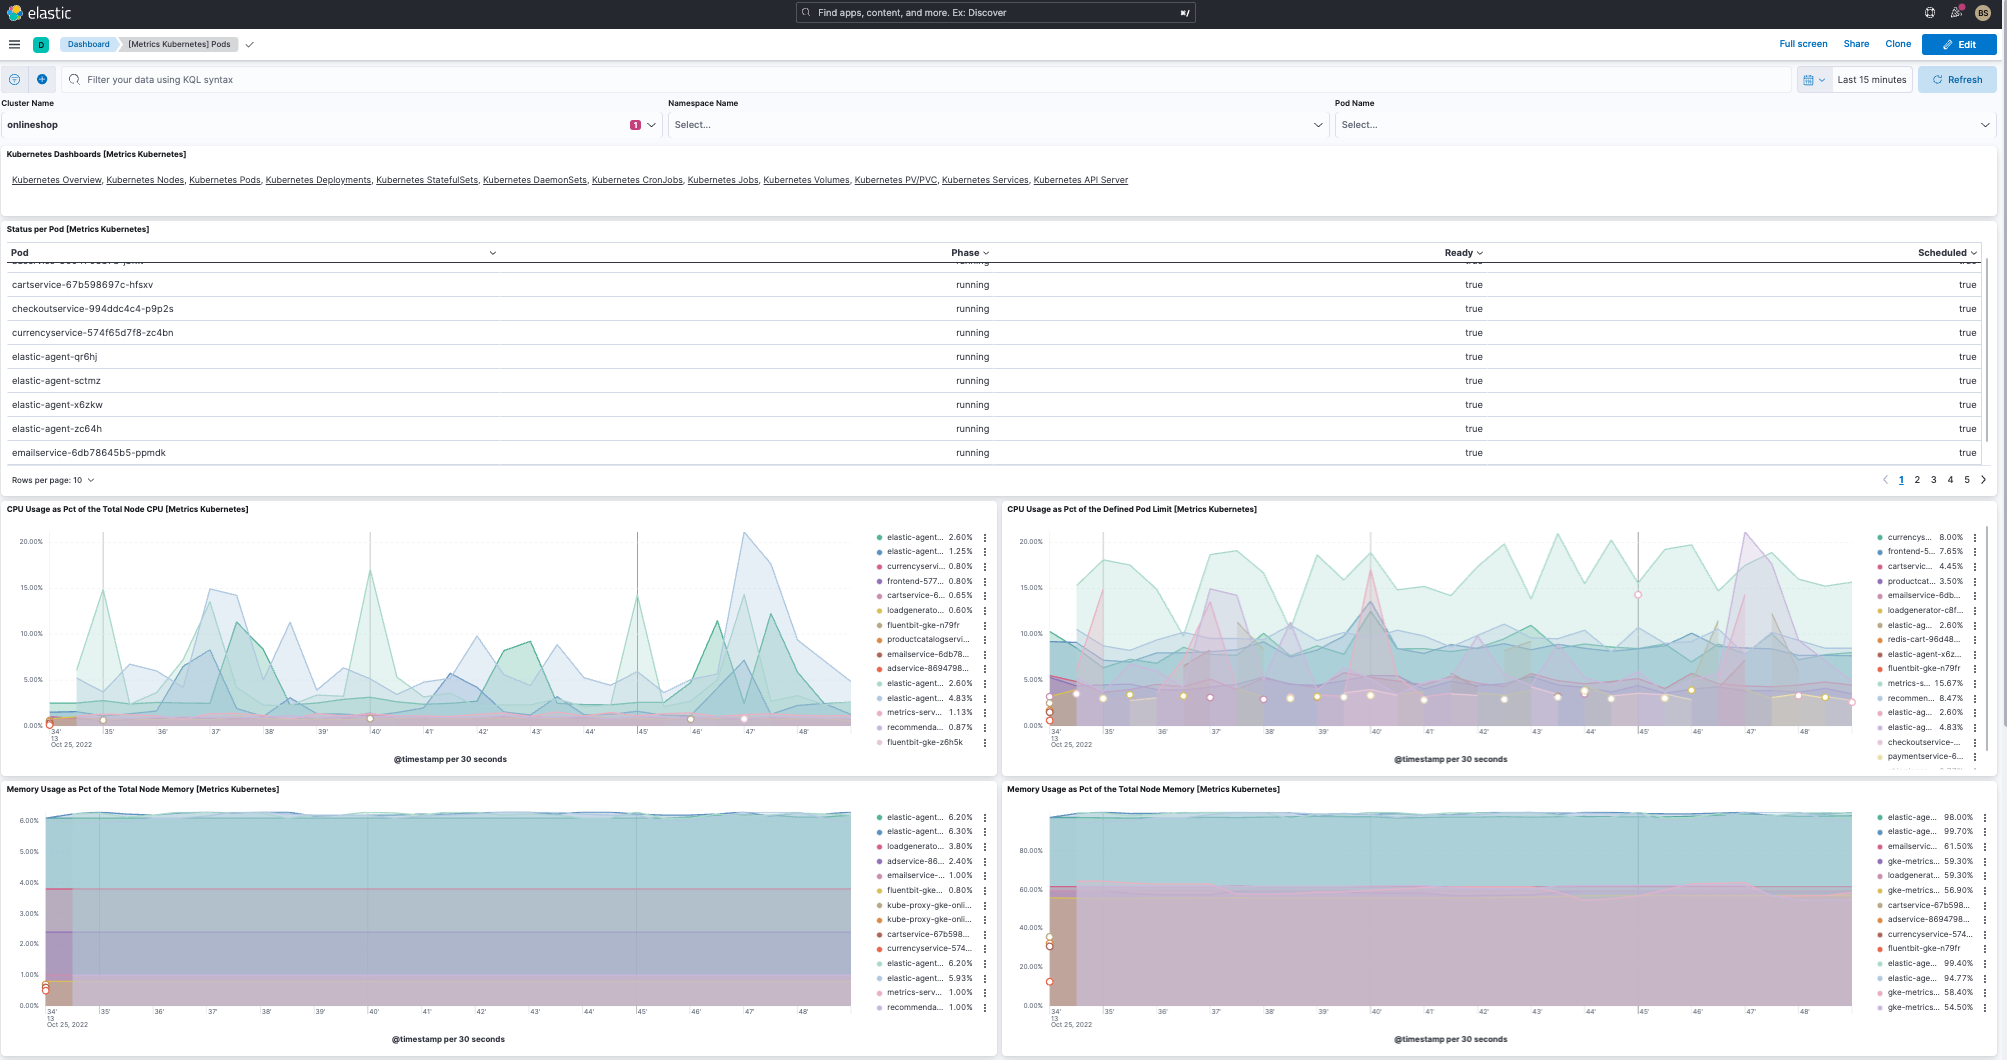
In addition to the cluster overview dashboard and pod dashboard, Elastic has several useful OOTB dashboards:
- Kubernetes overview dashboard (see above)
- Kubernetes pod dashboard (see above)
- Kubernetes nodes dashboard
- Kubernetes deployments dashboard
- Kubernetes DaemonSets dashboard
- Kubernetes StatefulSets dashboards
- Kubernetes CronJob & Jobs dashboards
- Kubernetes services dashboards
- More being added regularly
Additionally, you can either customize these dashboards or build out your own.
Working with logs on Elastic Observability
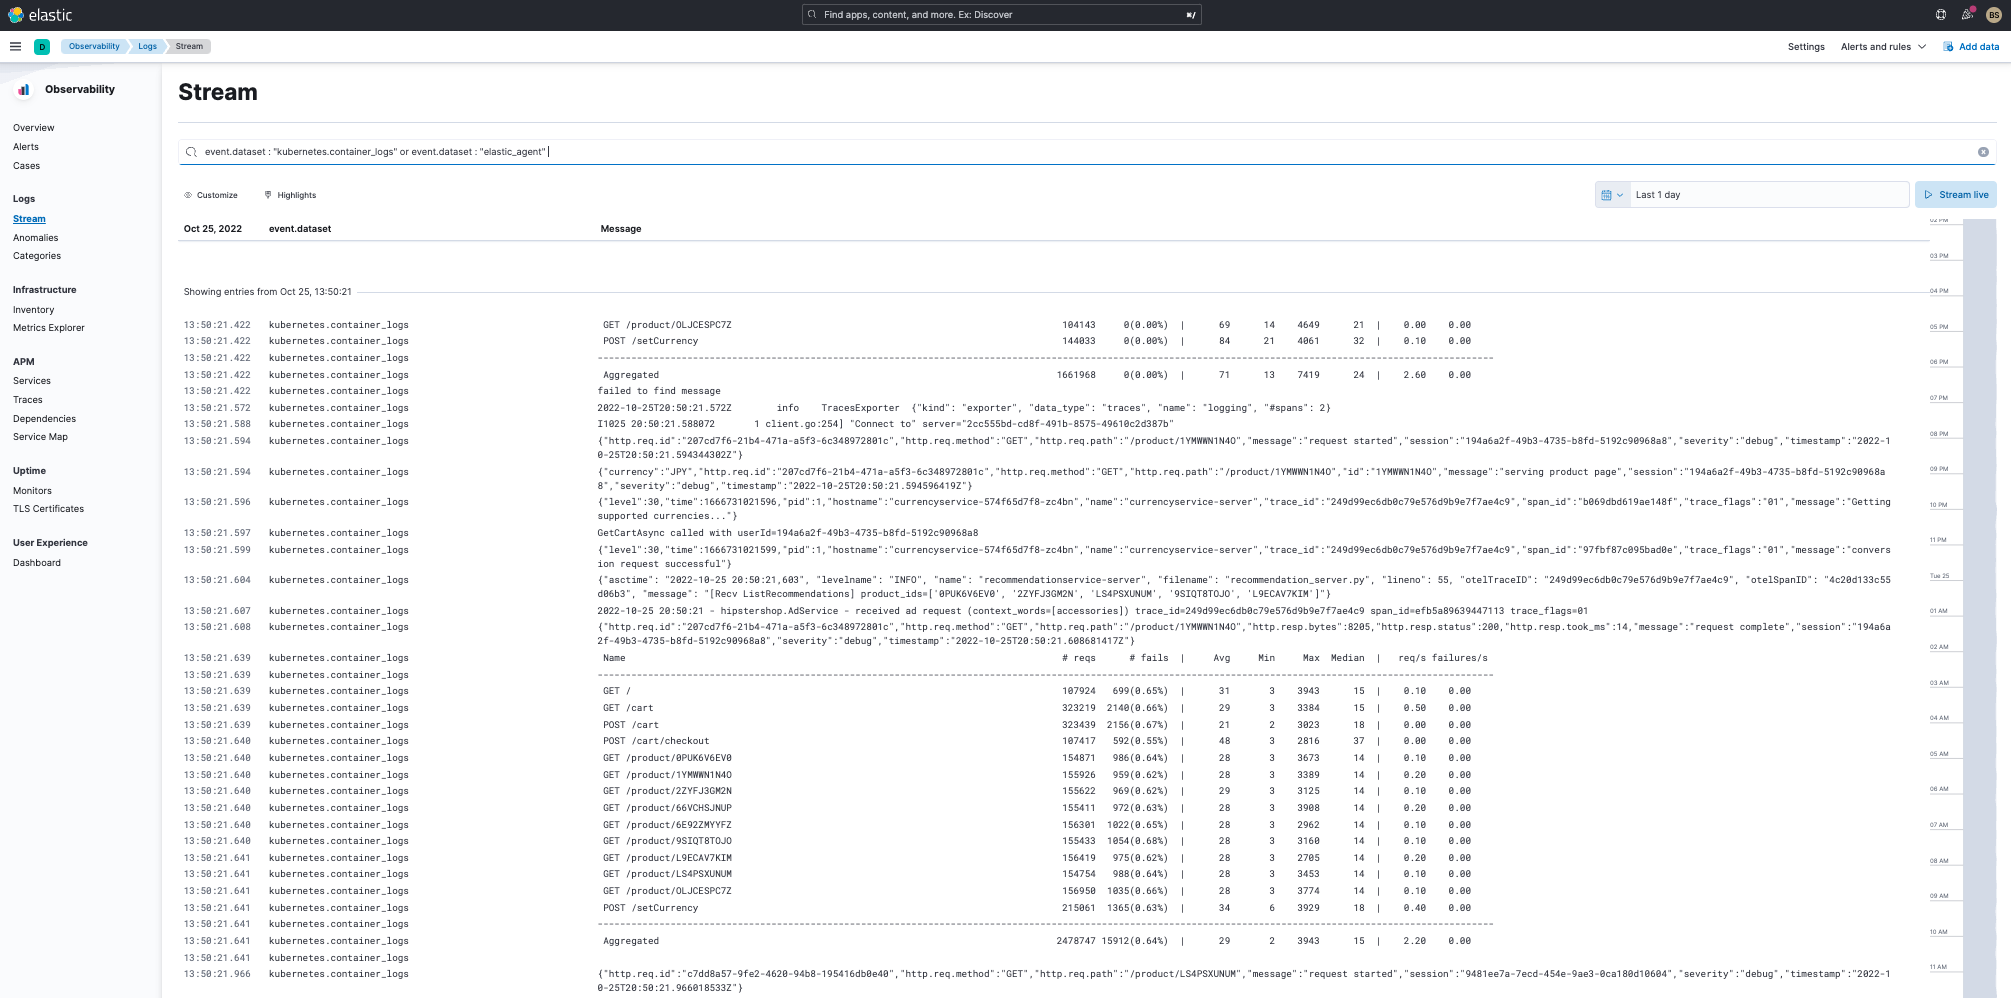
As you can see from the screens above, not only can I get Kubernetes cluster metrics, but also all the Kubernetes logs simply by using the Elastic Agent in my Kubernetes cluster.
Prevent, predict, and remediate issues
In addition to helping manage metrics and logs, Elastic can help you detect and predict anomalies across your cluster telemetry. Simply turn on Machine Learning in Elastic against your data and watch it help you enhance your analysis work. As you can see below, Elastic is not only a unified observability location for your Kubernetes cluster logs and metrics, but it also provides extensive true machine learning capabilities to enhance your analysis and management.
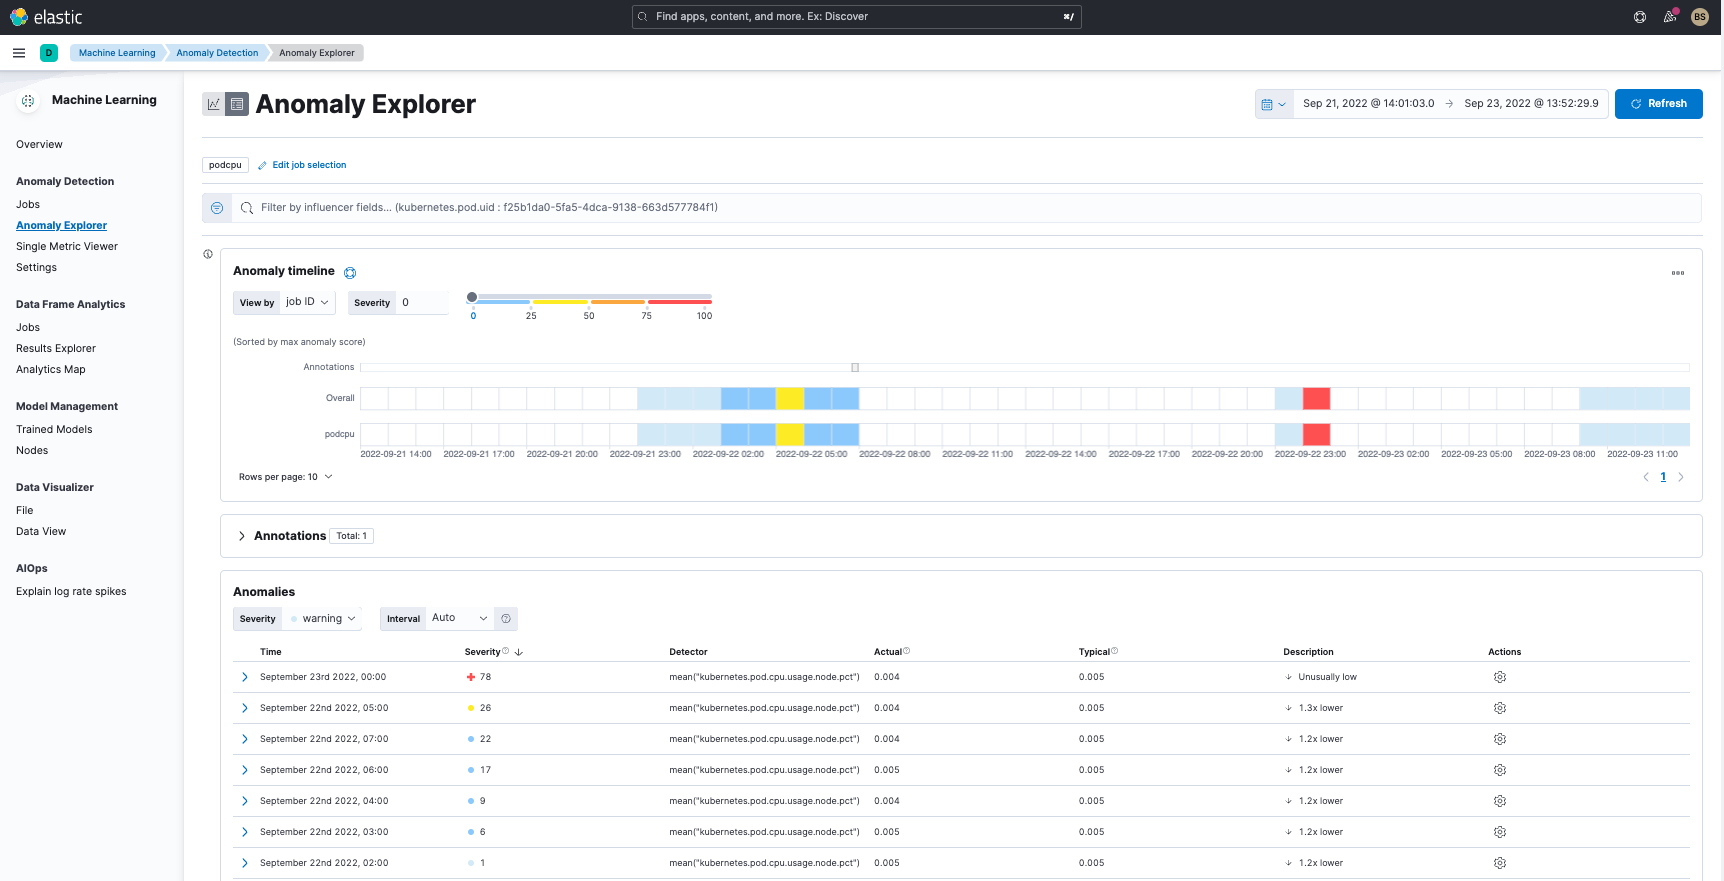
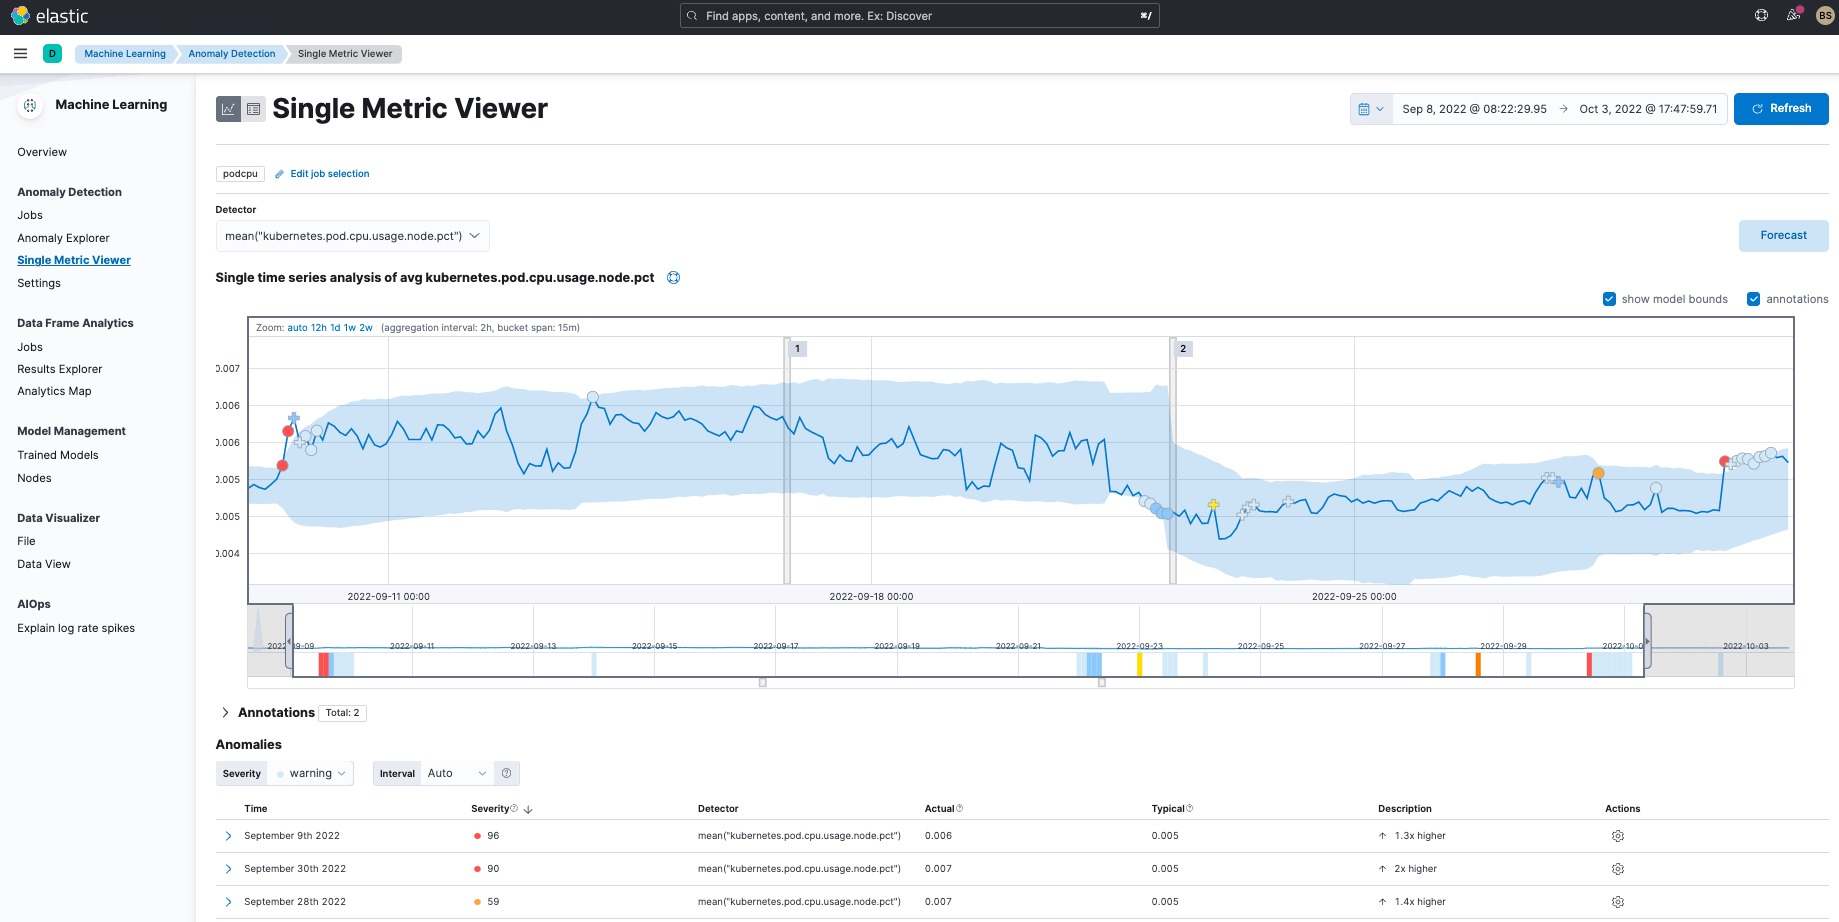
In the top graph, you see anomaly detection across logs and it shows something potentially wrong in the September 21 to 23 time period. Dig into the details on the bottom chart by analyzing a single kubernetes.pod.cpu.usage.node metric showing cpu issues early in September and again, later on in the month. You can do more complicated analyses on your cluster telemetry with Machine Learning using multi-metric analysis (versus the single metric issue I am showing above) along with population analysis.
Elastic gives you better machine learning capabilities to enhance your analysis of Kubernetes cluster telemetry. In the next section, let’s walk through how easy it is to get your telemetry data into Elastic.
Setting it all up
Let’s walk through the details of how to get metrics, logs, and traces into Elastic from a HipsterShop application deployed on GKE.
First, pick your favorite version of Hipstershop — as we noted above, we used a variant of the OpenTelemetry-Demo because it already has OTel. We slimmed it down for this blog, however (fewer services with some varied languages).
Step 0: Get an account on Elastic Cloud
Follow the instructions to get started on Elastic Cloud.
Step 1: Get a Kubernetes cluster and load your Kubernetes app into your cluster
Get your app on a Kubernetes cluster in your Cloud service of choice or local Kubernetes platform. Once your app is up on Kubernetes, you should have the following pods (or some variant) running on the default namespace.
NAME                                    READY   STATUS    RESTARTS   AGE
adservice-8694798b7b-jbfxt              1/1     Running   0          4d3h
cartservice-67b598697c-hfsxv            1/1     Running   0          4d3h
checkoutservice-994ddc4c4-p9p2s         1/1     Running   0          4d3h
currencyservice-574f65d7f8-zc4bn        1/1     Running   0          4d3h
emailservice-6db78645b5-ppmdk           1/1     Running   0          4d3h
frontend-5778bfc56d-jjfxg               1/1     Running   0          4d3h
jaeger-686c775fbd-7d45d                 1/1     Running   0          4d3h
loadgenerator-c8f76d8db-gvrp7           1/1     Running   0          4d3h
otelcollector-5b87f4f484-4wbwn          1/1     Running   0          4d3h
paymentservice-6888bb469c-nblqj         1/1     Running   0          4d3h
productcatalogservice-66478c4b4-ff5qm   1/1     Running   0          4d3h
recommendationservice-648978746-8bzxc   1/1     Running   0          4d3h
redis-cart-96d48485f-gpgxd              1/1     Running   0          4d3h
shippingservice-67fddb767f-cq97d 1/1 Running 0 4d3hgit clone https://github.com/kubernetes/kube-state-metrics.gitNext, in the kube-state-metrics directory under the examples directory, just apply the standard config.
kubectl apply -f ./standardThis will turn on kube-state-metrics, and you should see a pod similar to this running in kube-system namespace.
kube-state-metrics-5f9dc77c66-qjprz 1/1 Running 0 4d4hStep 3: Install the Elastic Agent with Kubernetes integration
Add Kubernetes Integration:

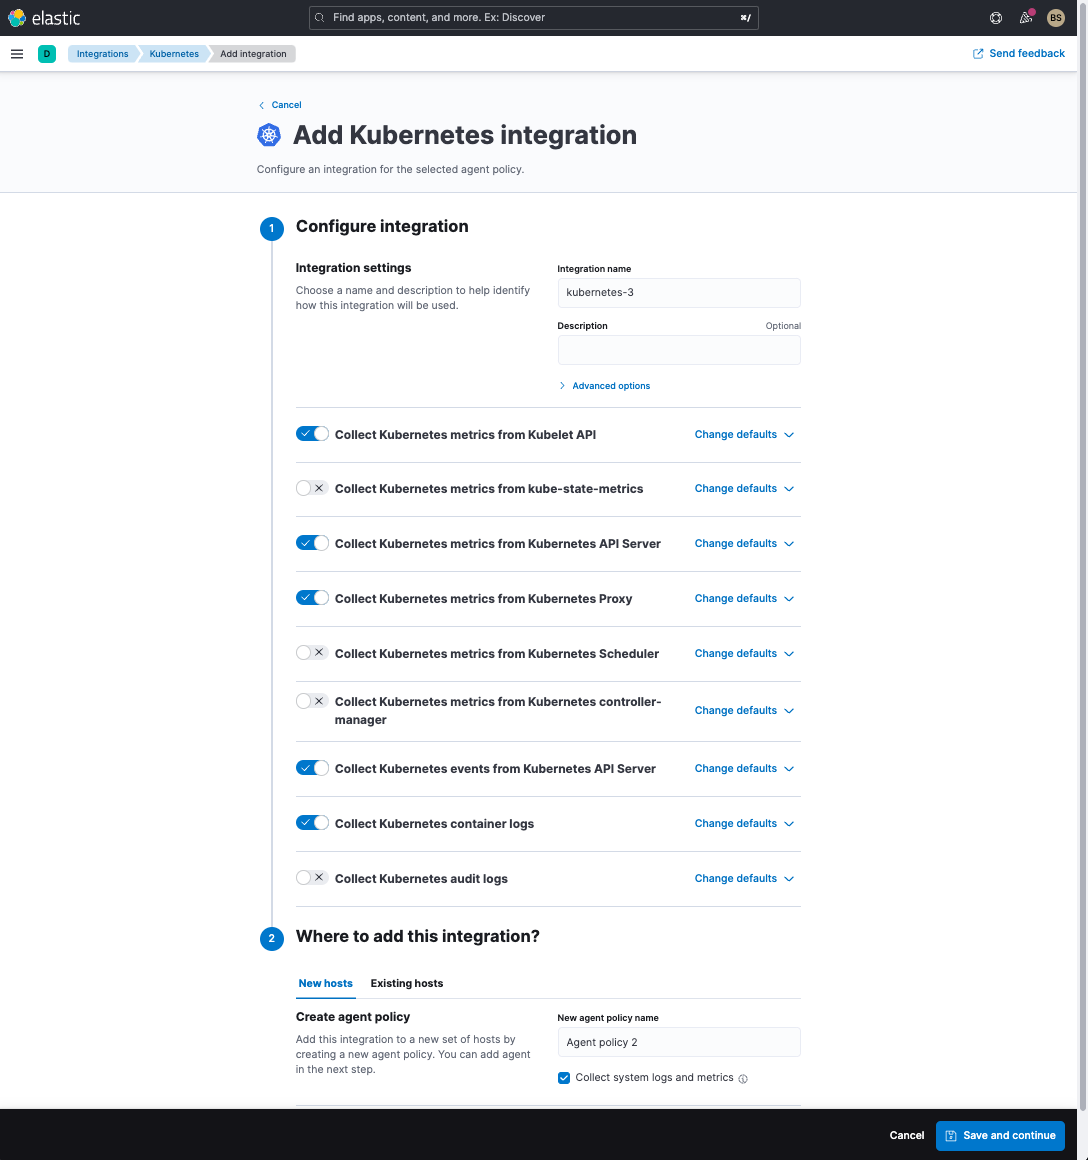
- In Elastic, go to integrations and select the Kubernetes Integration, and select to Add Kubernetes.
- Select a name for the Kubernetes integration.
- Turn on kube-state-metrics in the configuration screen.
- Give the configuration a name in the new-agent-policy-name text box.
- Save the configuration. The integration with a policy is now created.
You can read up on the agent policies and how they are used on the Elastic Agent here.
- Add Kubernetes integration.
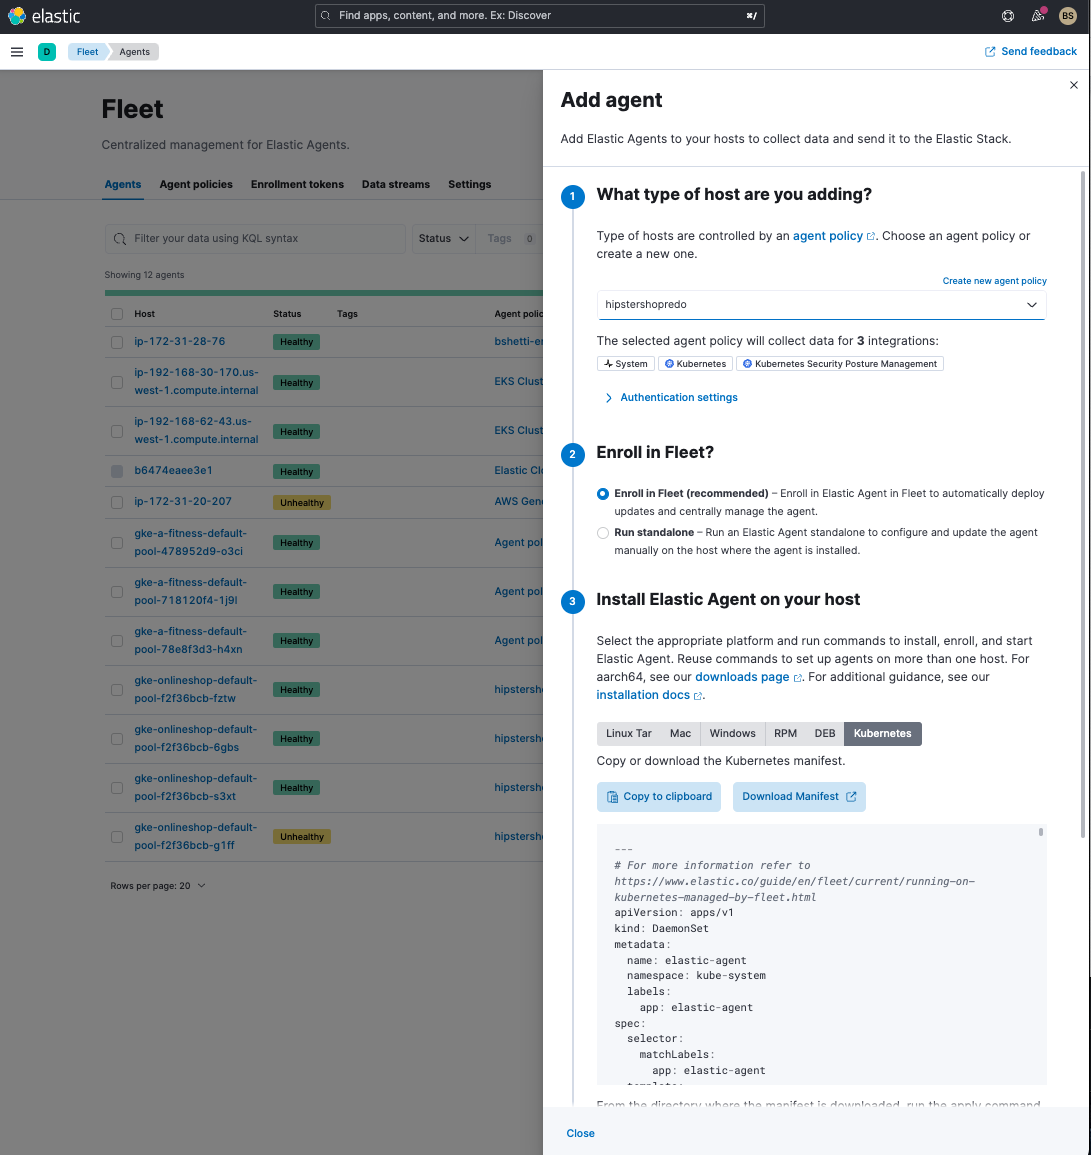
- Select the policy you just created in the second.
- In the third step of Add Agent instructions, copy and paste or download the manifest.
- Add manifest to the shell where you have kubectl running, save it as elastic-agent-managed-kubernetes.yaml, and run the following command.
kubectl apply -f elastic-agent-managed-kubernetes.yamlYou should see a number of agents come up as part of a DaemonSet in kube-system namespace.
NAME                                                   READY   STATUS    RESTARTS   AGE
elastic-agent-qr6hj                                    1/1     Running   0          4d7h
elastic-agent-sctmz                                    1/1     Running   0          4d7h
elastic-agent-x6zkw                                    1/1     Running   0          4d7h
elastic-agent-zc64h 1/1 Running 0 4d7hIn my cluster, I have four nodes and four elastic-agents started as part of the DaemonSet.
Step 4: Look at Elastic out of the box dashboards (OOTB) for Kubernetes metrics and start discovering Kubernetes logs
That is it. You should see metrics flowing into all the dashboards. To view logs for specific pods, simply go into Discover in Kibana and search for a specific pod name.


Additionally, you can browse all the pod logs directly in Elastic.
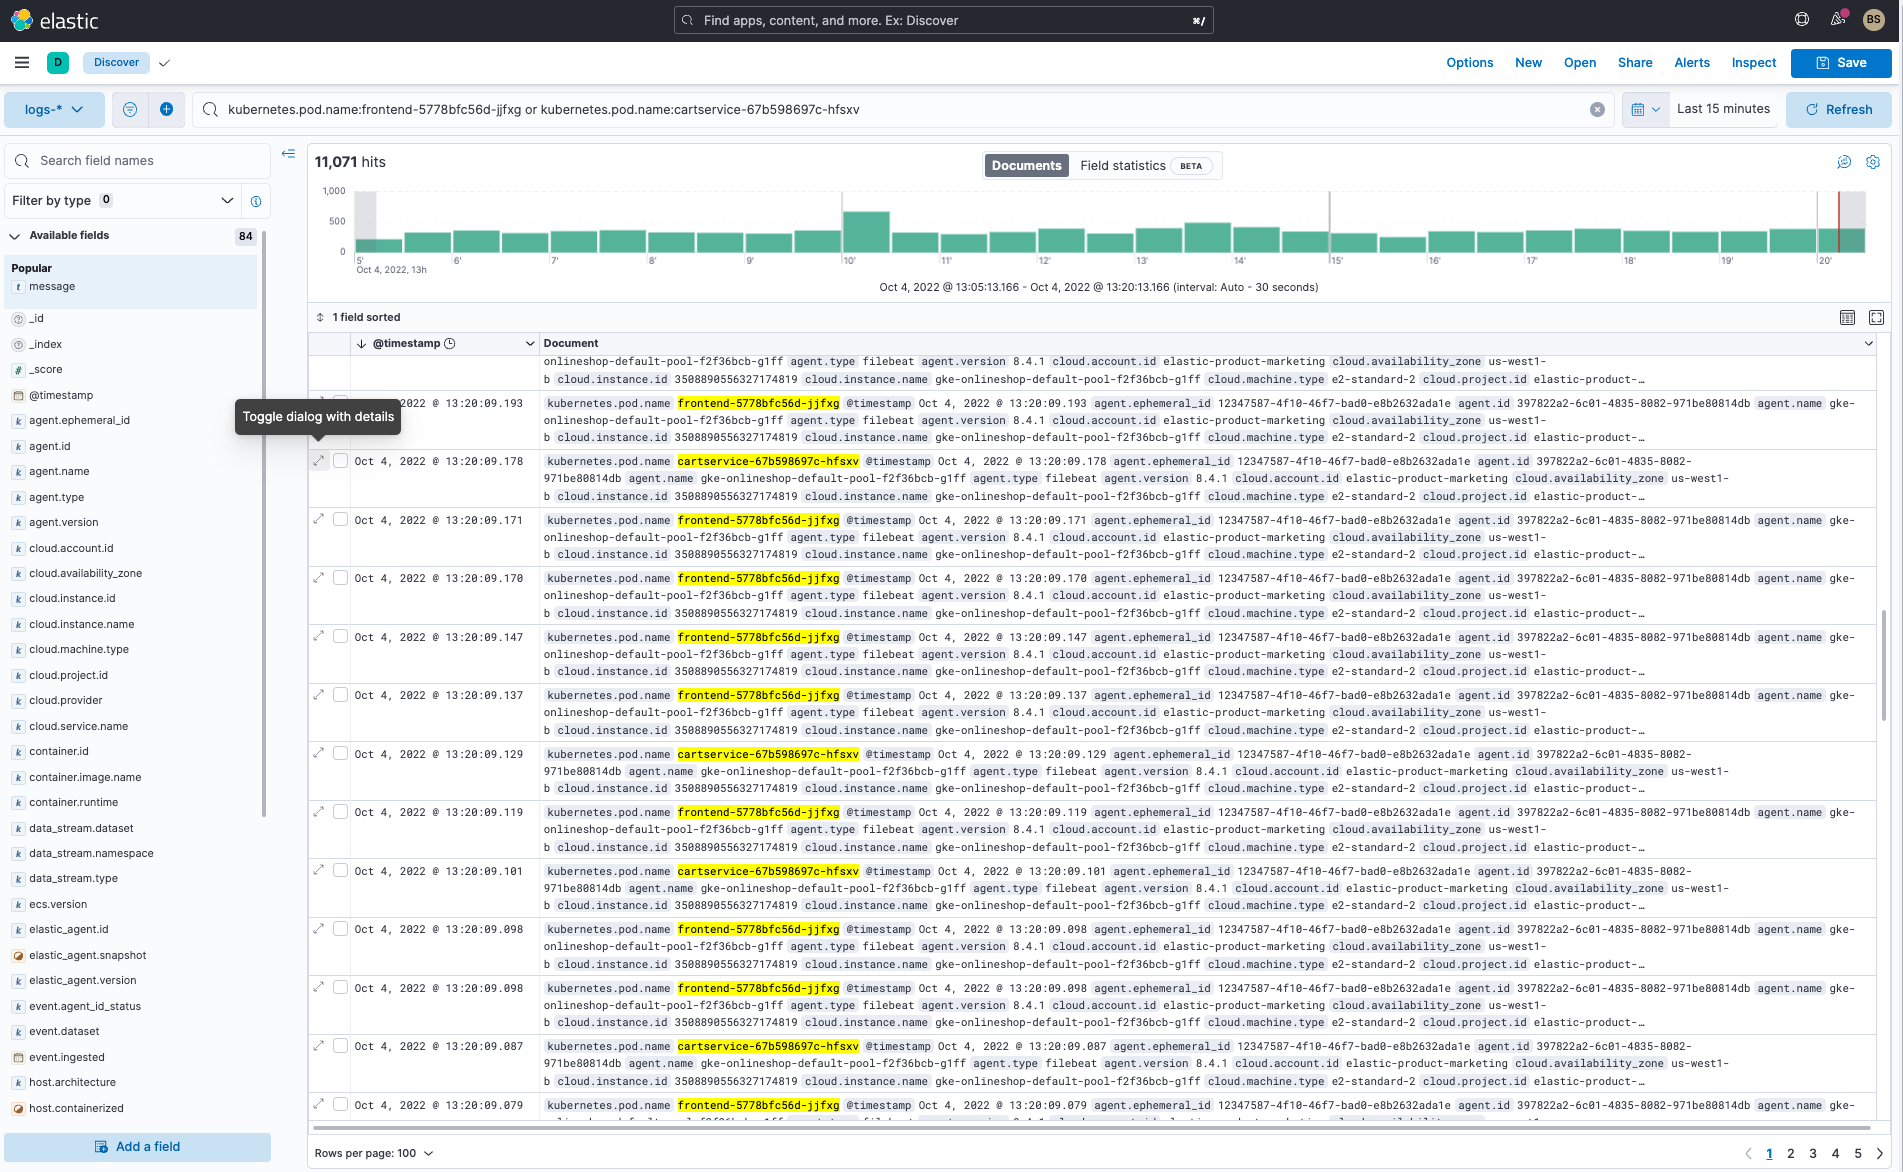
In the above example, I searched for frontendService and cartService logs.
Step 5: Bonus!
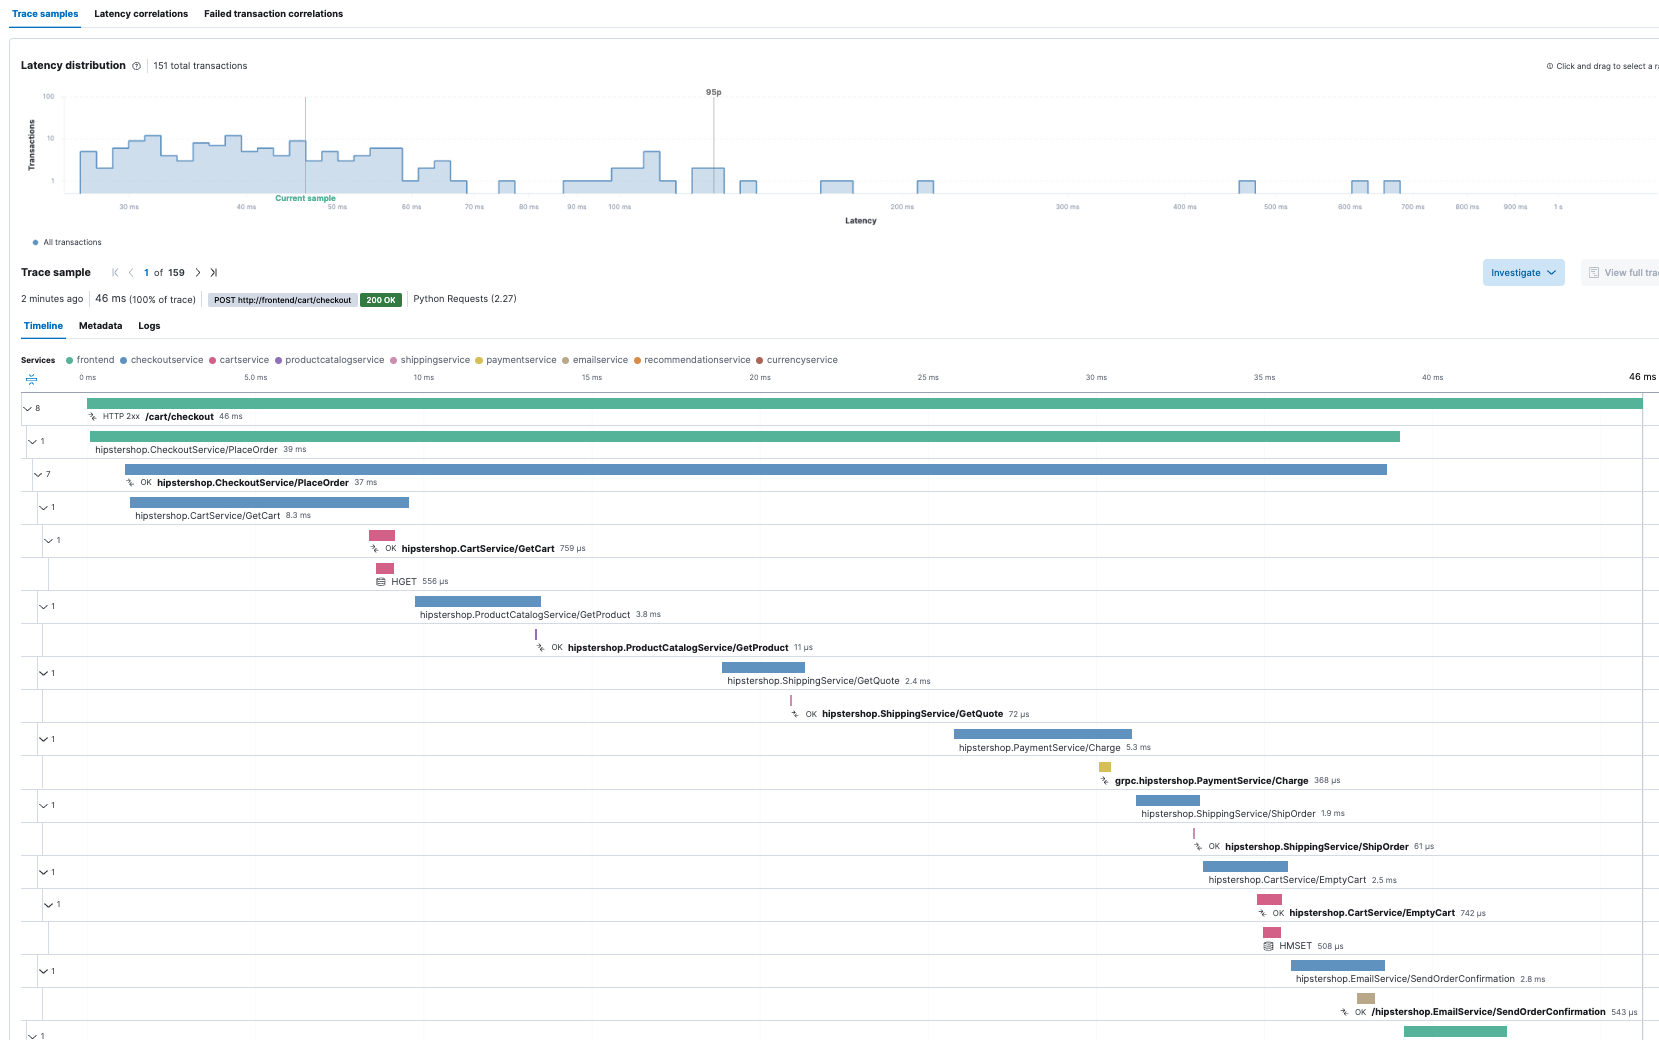
Because we were using an OTel based application, Elastic can even pull in the application traces. But that is a discussion for another blog.
Here is a quick peek at what Hipster Shop’s traces for a front end transaction look like in Elastic Observability.
Conclusion: Elastic Observability rocks for Kubernetes monitoring
I hope you’ve gotten an appreciation for how Elastic Observability can help you manage Kubernetes clusters along with the complexity of the metrics, log, and trace data it generates for even a simple deployment.
A quick recap of lessons and more specifically learned:
- How Elastic Cloud can aggregate and ingest telemetry data through the Elastic Agent, which is easily deployed on your cluster as a DaemonSet and retrieves metrics from the host, such as system metrics, container stats, and metrics from all services running on top of Kubernetes
- Show what Elastic brings from a unified telemetry experience (Kubernenetes logs, metrics, traces) across all your Kubernetes cluster components (pods, nodes, services, any namespace, and more).
- Interest in exploring Elastic’s ML capabilities which will reduce your MTTHH (mean time to happy hour)
Ready to get started? Register and try out the features and capabilities I’ve outlined above.

