Gain insights into Kubernetes errors with Elastic Observability logs and OpenAI

As we’ve shown in previous blogs, Elastic® provides a way to ingest and manage telemetry from the Kubernetes cluster and the application running on it. Elastic provides out-of-the-box dashboards to help with tracking metrics, log management and analytics, APM functionality (which also supports native OpenTelemetry), and the ability to analyze everything with AIOps features and machine learning (ML). While you can use pre-existing ML models in Elastic, out-of-the-box AIOps features, or your own ML models, there is a need to dig deeper into the root cause of an issue.
Elastic helps reduce the operational work to support more efficient operations, but users still need a way to investigate and understand everything from the cause of an issue to the meaning of specific error messages. As an operations user, if you haven’t run into a particular error before or it's part of some runbook, you will likely go to Google and start searching for information.
OpenAI’s ChatGPT is becoming an interesting generative AI tool that helps provide more information using the models behind it. What if you could use OpenAI to obtain deeper insights (even simple semantics) for an error in your production or development environment? You can easily tie Elastic to OpenAI’s API to achieve this.
Kubernetes, a mainstay in most deployments (on-prem or in a cloud service provider) requires a significant amount of expertise — even if that expertise is to manage a service like GKE, EKS, or AKS.
In this blog, I will cover how you can use Elastic’s watcher capability to connect Elastic to OpenAI and ask it for more information about the error logs Elastic is ingesting from a Kubernetes cluster(s). More specifically, we will use Azure’s OpenAI Service. Azure OpenAI is a partnership between Microsoft and OpenAI, so the same models from OpenAI are available in the Microsoft version.
While this blog goes over a specific example, it can be modified for other types of errors Elastic receives in logs. Whether it's from AWS, the application, databases, etc., the configuration and script described in this blog can be modified easily.
Prerequisites and config
If you plan on following this blog, here are some of the components and details we used to set up the configuration:
- Ensure you have an account on Elastic Cloud and a deployed stack (see instructions here).
- We used a GCP GKE Kubernetes cluster, but you can use any Kubernetes cluster service (on-prem or cloud based) of your choice.
- We’re also running with a version of the OpenTelemetry Demo. Directions for using Elastic with OpenTelemetry Demo are here.
- We also have an Azure account and Azure OpenAI service configured. You will need to get the appropriate tokens from Azure and the proper URL endpoint from Azure’s OpenAI service.
- We will use Elastic’s dev tools, the console to be specific, to load up and run the script, which is an Elastic watcher.
- We will also add a new index to store the results from the OpenAI query.
Here is the configuration we will set up in this blog:
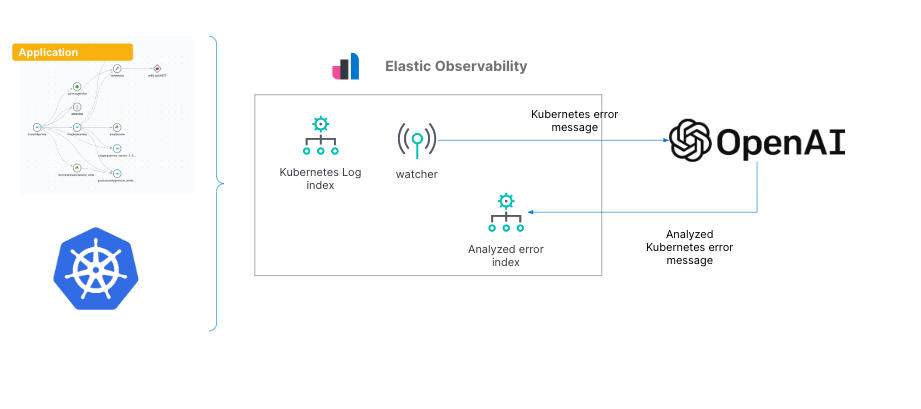
As we walk through the setup, we’ll also provide the alternative setup with OpenAI versus Azure OpenAI Service.
Setting it all up
Over the next few steps, I’ll walk through:
- Getting an account on Elastic Cloud and setting up your K8S cluster and application
- Gaining Azure OpenAI authorization (alternative option with OpenAI)
- Identifying Kubernetes error logs
- Configuring the watcher with the right script
- Comparing the output from Azure OpenAI/OpenAI versus ChatGPT UI
Step 0: Create an account on Elastic Cloud
Follow the instructions to get started on Elastic Cloud.

Once you have the Elastic Cloud login, set up your Kubernetes cluster and application. A complete step-by-step instructions blog is available here. This also provides an overview of how to see Kubernetes cluster metrics in Elastic and how to monitor them with dashboards.
Step 1: Azure OpenAI Service and authorization
When you log in to your Azure subscription and set up an instance of Azure OpenAI Service, you will be able to get your keys under Manage Keys.

There are two keys for your OpenAI instance, but you only need KEY 1 .
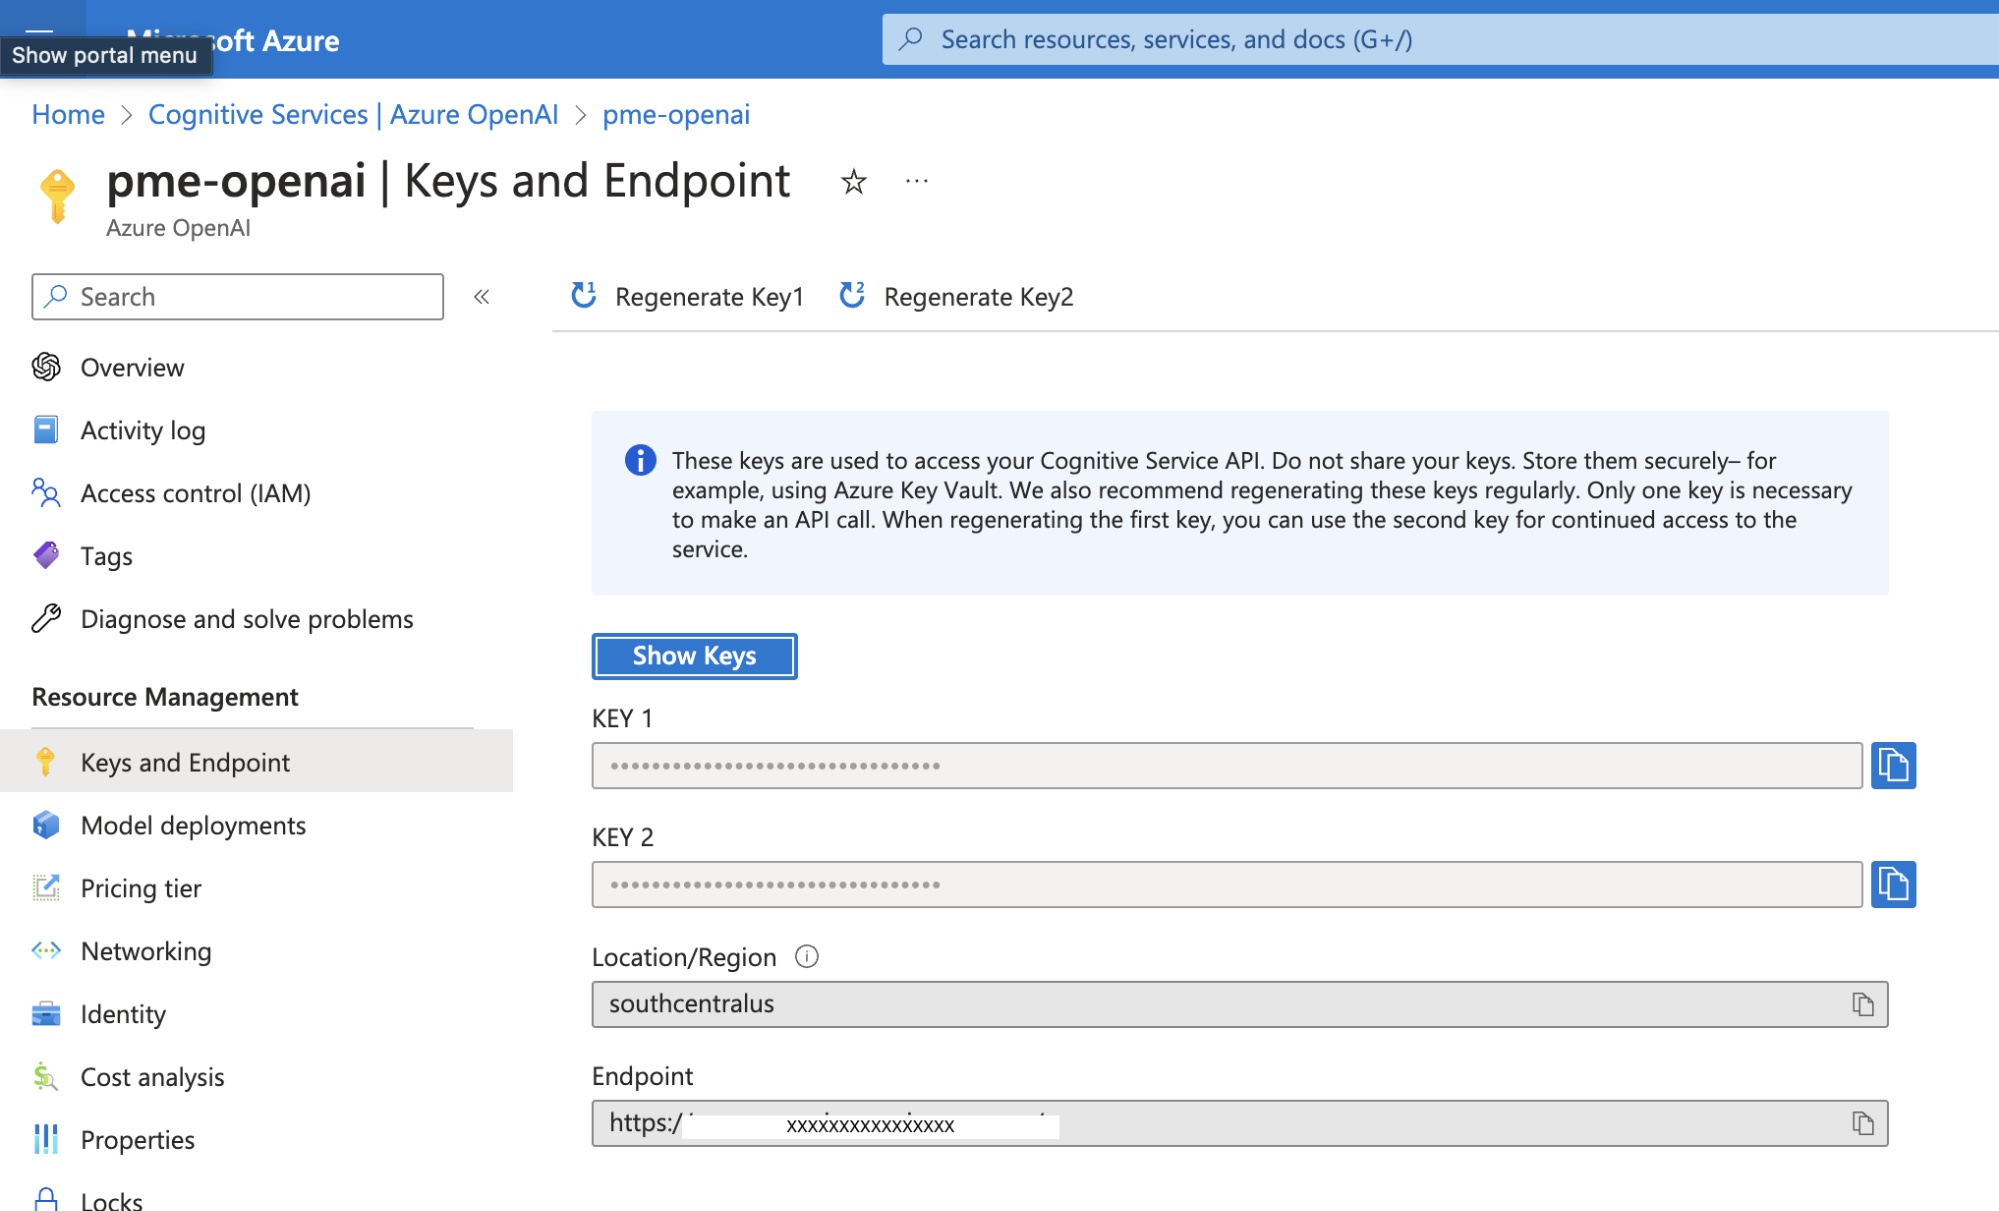
Additionally, you will need to get the service URL. See the image above with our service URL blanked out to understand where to get the KEY 1 and URL.
If you are not using Azure OpenAI Service and the standard OpenAI service, then you can get your keys at:
https://platform.openai.com/account/api-keys
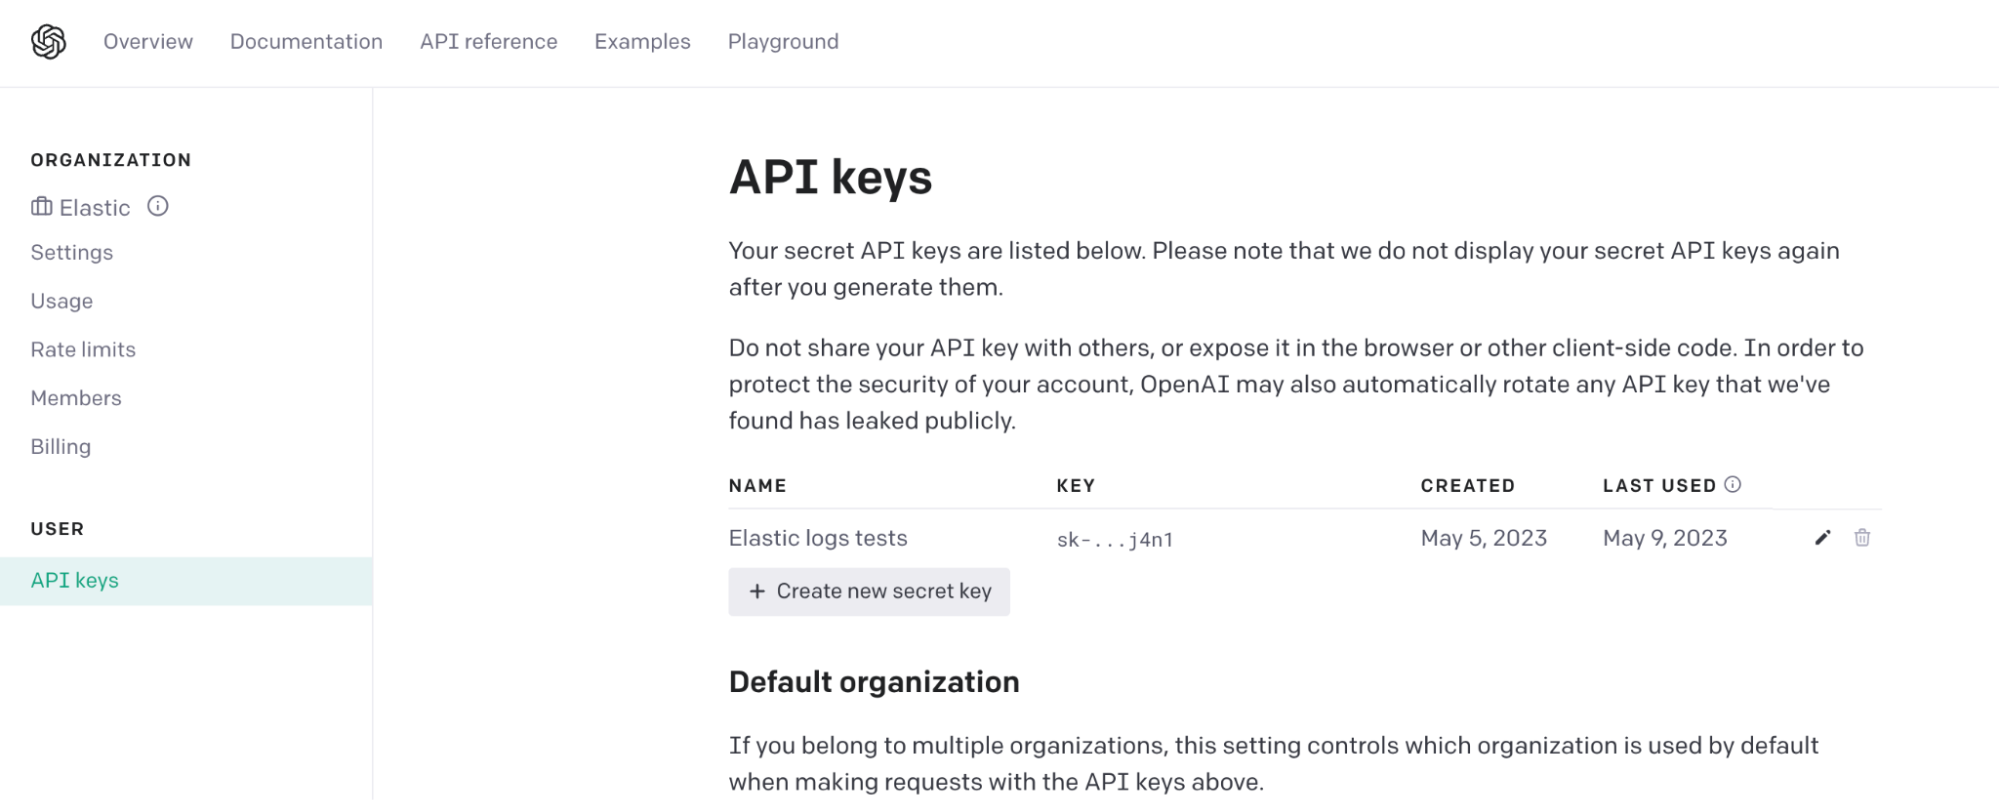
You will need to create a key and save it. Once you have the key, you can go to Step 2.
Step 2: Identifying Kubernetes errors in Elastic logs
As your Kubernetes cluster is running, Elastic’s Kubernetes integration running on the Elastic agent daemon set on your cluster is sending logs and metrics to Elastic. The telemetry is ingested, processed, and indexed. Kubernetes logs are stored in an index called .ds-logs-kubernetes.container_logs-default-* (* is for the date), and an automatic data stream logs-kubernetes.container_logs is also pre-loaded. So while you can use some of the out-of-the-box dashboards to investigate the metrics, you can also look at all the logs in Elastic Discover.
While any error from Kubernetes can be daunting, the more nuanced issues occur with errors from the pods running in the kube-system namespace. Take the pod konnectivity agent, which is essentially a network proxy agent running on the node to help establish tunnels and is a vital component in Kubernetes. Any error will cause the cluster to have connectivity issues and lead to a cascade of issues, so it’s important to understand and troubleshoot these errors.
When we filter out for error logs from the konnectivity agent, we see a good number of errors.
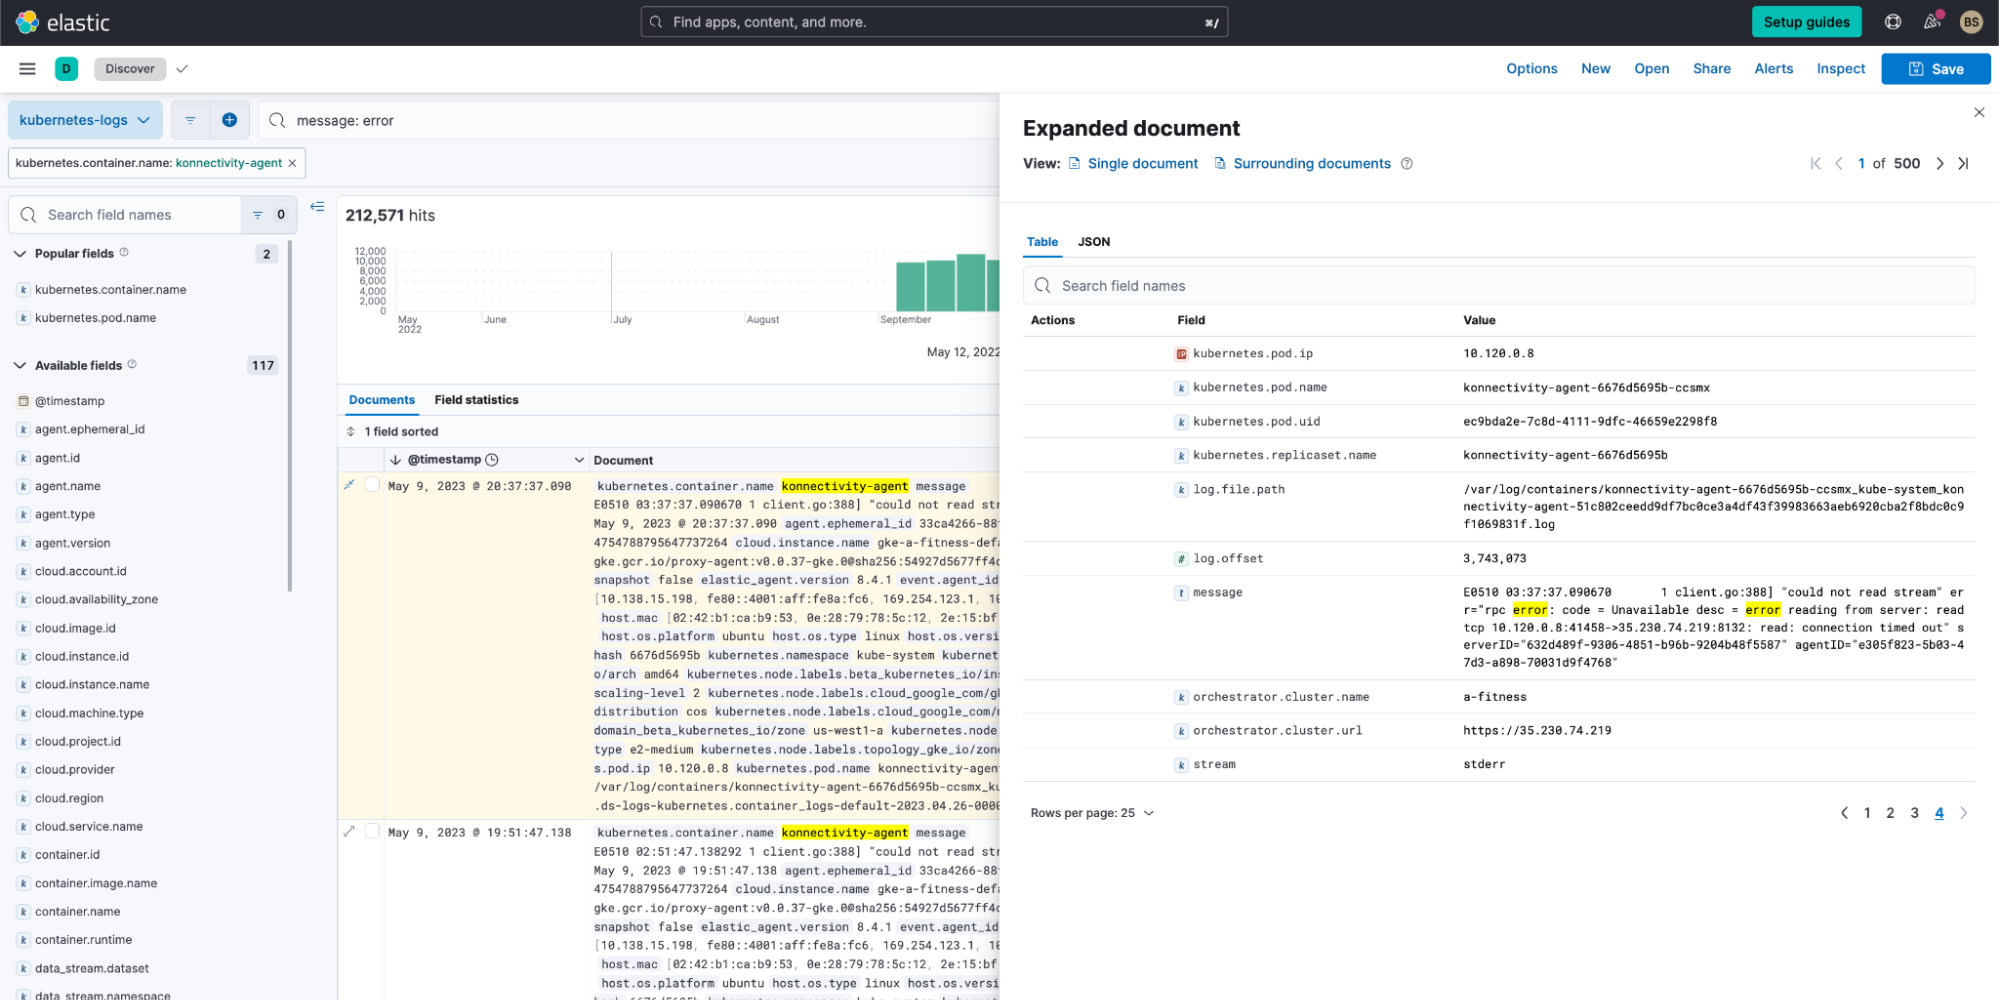
But unfortunately, we still can’t understand what these errors mean.
Enter OpenAI to help us understand the issue better. Generally, you would take the error message from Discover and paste it with a question in ChatGPT (or run a Google search on the message).
One error in particular that we’ve run into but do not understand is:
E0510 02:51:47.138292 1 client.go:388] could not read stream err=rpc error: code = Unavailable desc = error reading from server: read tcp 10.120.0.8:46156->35.230.74.219:8132: read: connection timed out serverID=632d489f-9306-4851-b96b-9204b48f5587 agentID=e305f823-5b03-47d3-a898-70031d9f4768The OpenAI output is as follows:
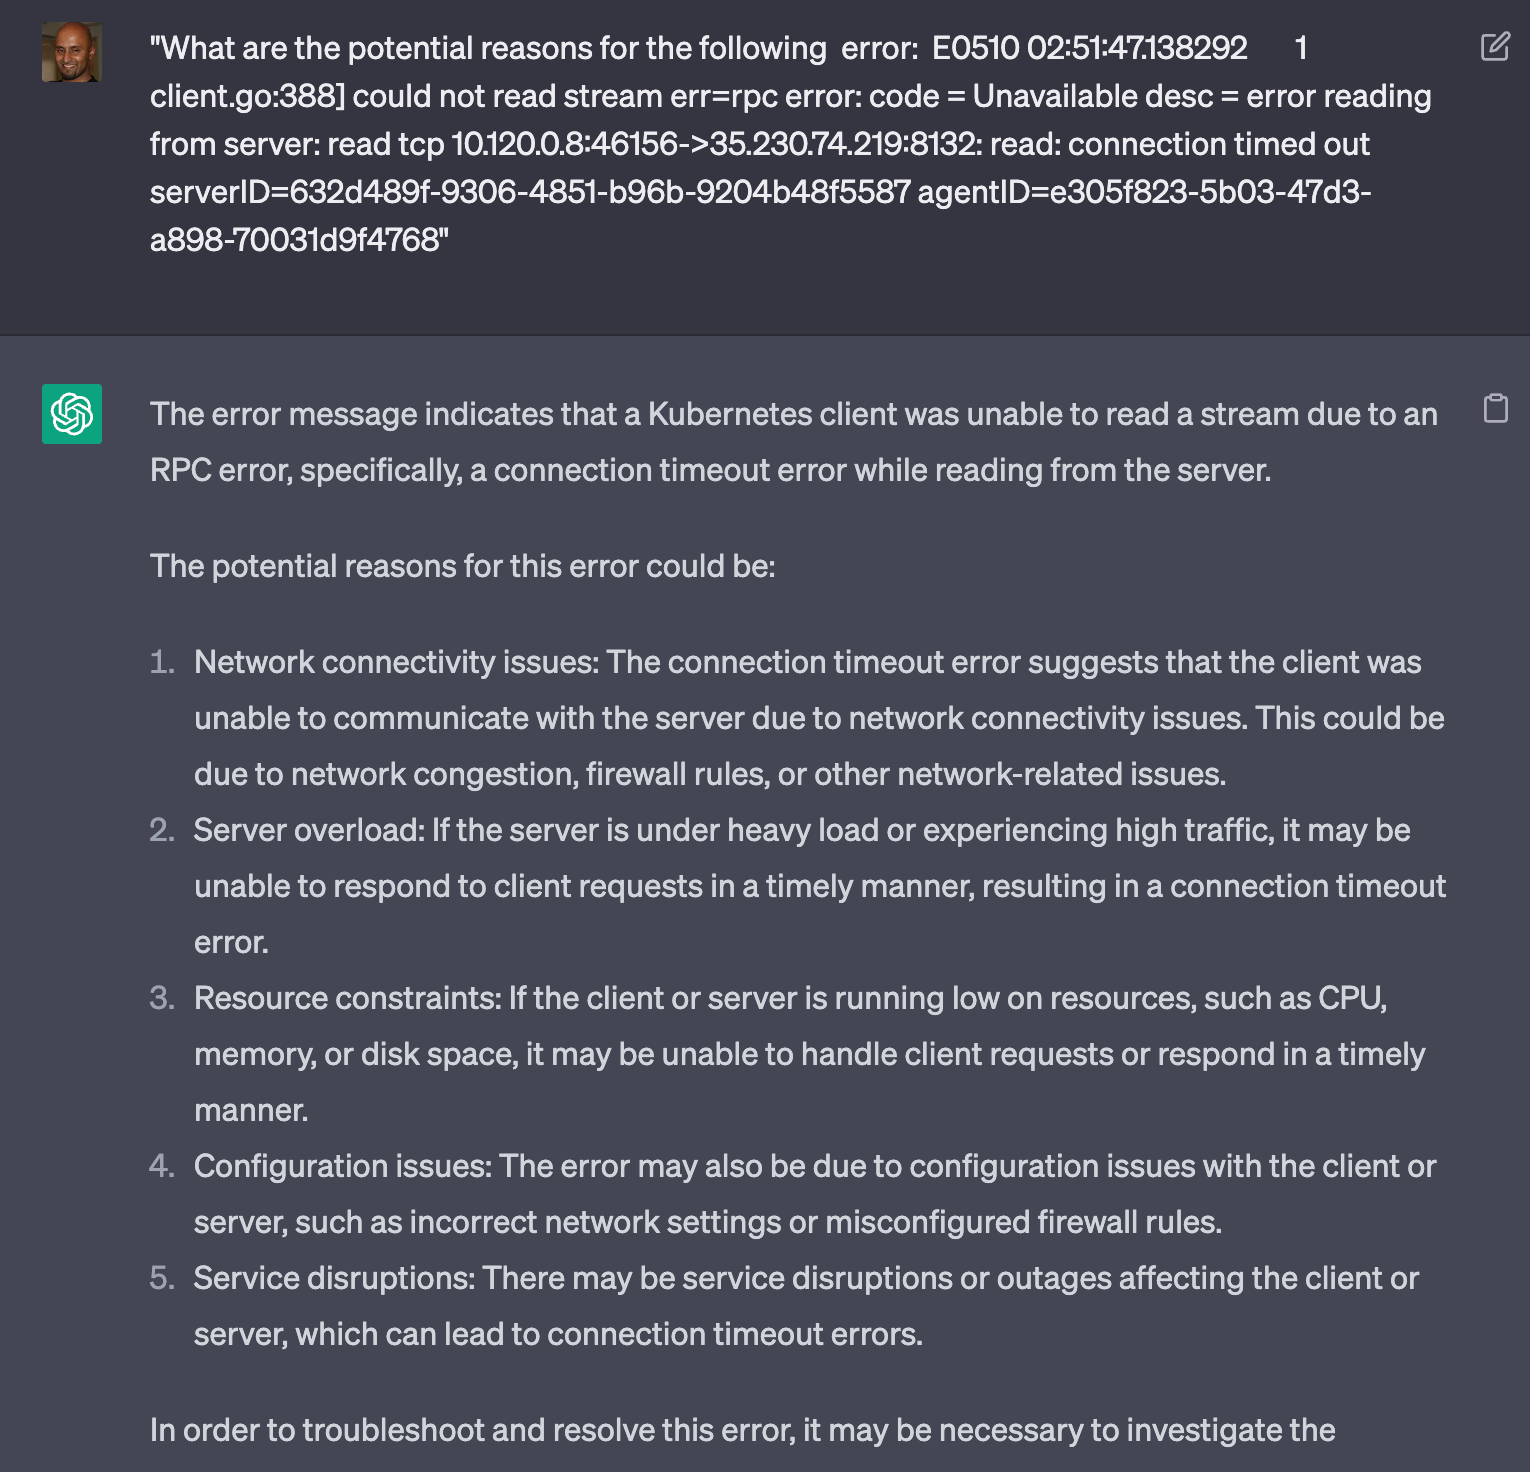
ChatGPT has given us a fairly nice set of ideas on why this rpc error is occurring against our konnectivity-agent.
So how can we get this output automatically for any error when those errors occur?
Step 3: Configuring the watcher with the right script
What is an Elastic watcher? Watcher is an Elasticsearch feature that you can use to create actions based on conditions, which are periodically evaluated using queries on your data. Watchers are helpful for analyzing mission-critical and business-critical streaming data. For example, you might watch application logs for errors causing larger operational issues.
Once a watcher is configured, it can be:
- Manually triggered
- Run periodically
- Created using a UI or a script
In this scenario, we will use a script, as we can modify it easily and run it as needed.
We’re using the DevTools Console to enter the script and test it out:
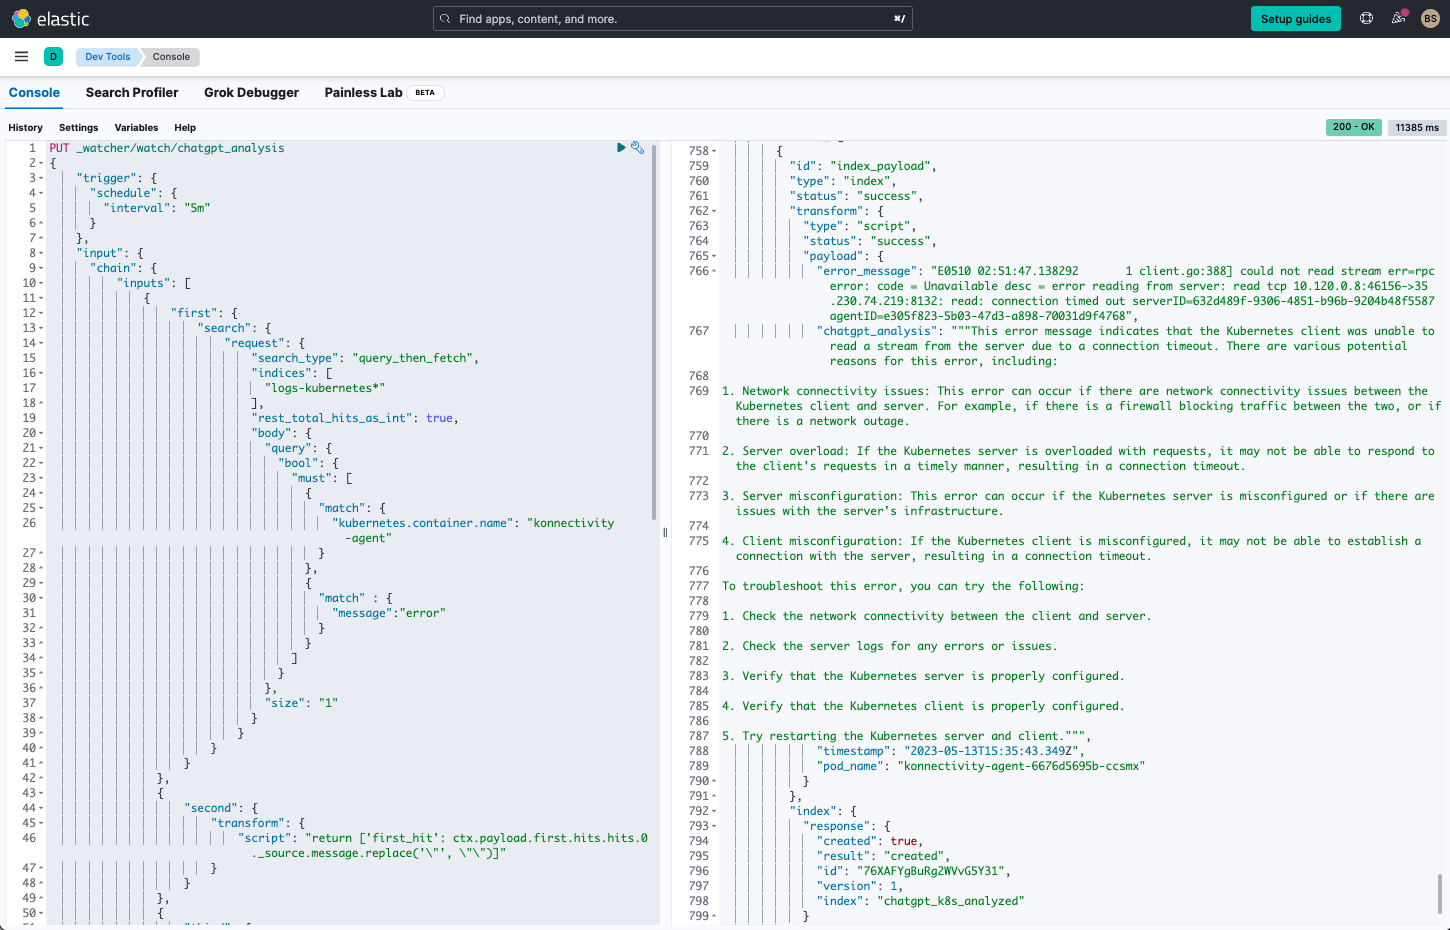
The script is listed at the end of the blog in the appendix. It can also be downloaded here.
The script does the following:
1. It runs continuously every five minutes.
2. It will search the logs for errors from the container konnectivity-agent.
3. It will take the first error’s message, transform it (re-format and clean up), and place it into a variable first_hit.
"script": "return ['first_hit': ctx.payload.first.hits.hits.0._source.message.replace('\"', \"\")]"4. The error message is sent into OpenAI with a query:
What are the potential reasons for the following kubernetes error: {{ctx.payload.second.first_hit}}5. If the search yielded an error, it will proceed to then create an index and place the error message, pod.name (which is konnectivity-agent-6676d5695b-ccsmx in our setup), and OpenAI output into a new index called chatgpt_k8_analyzed.
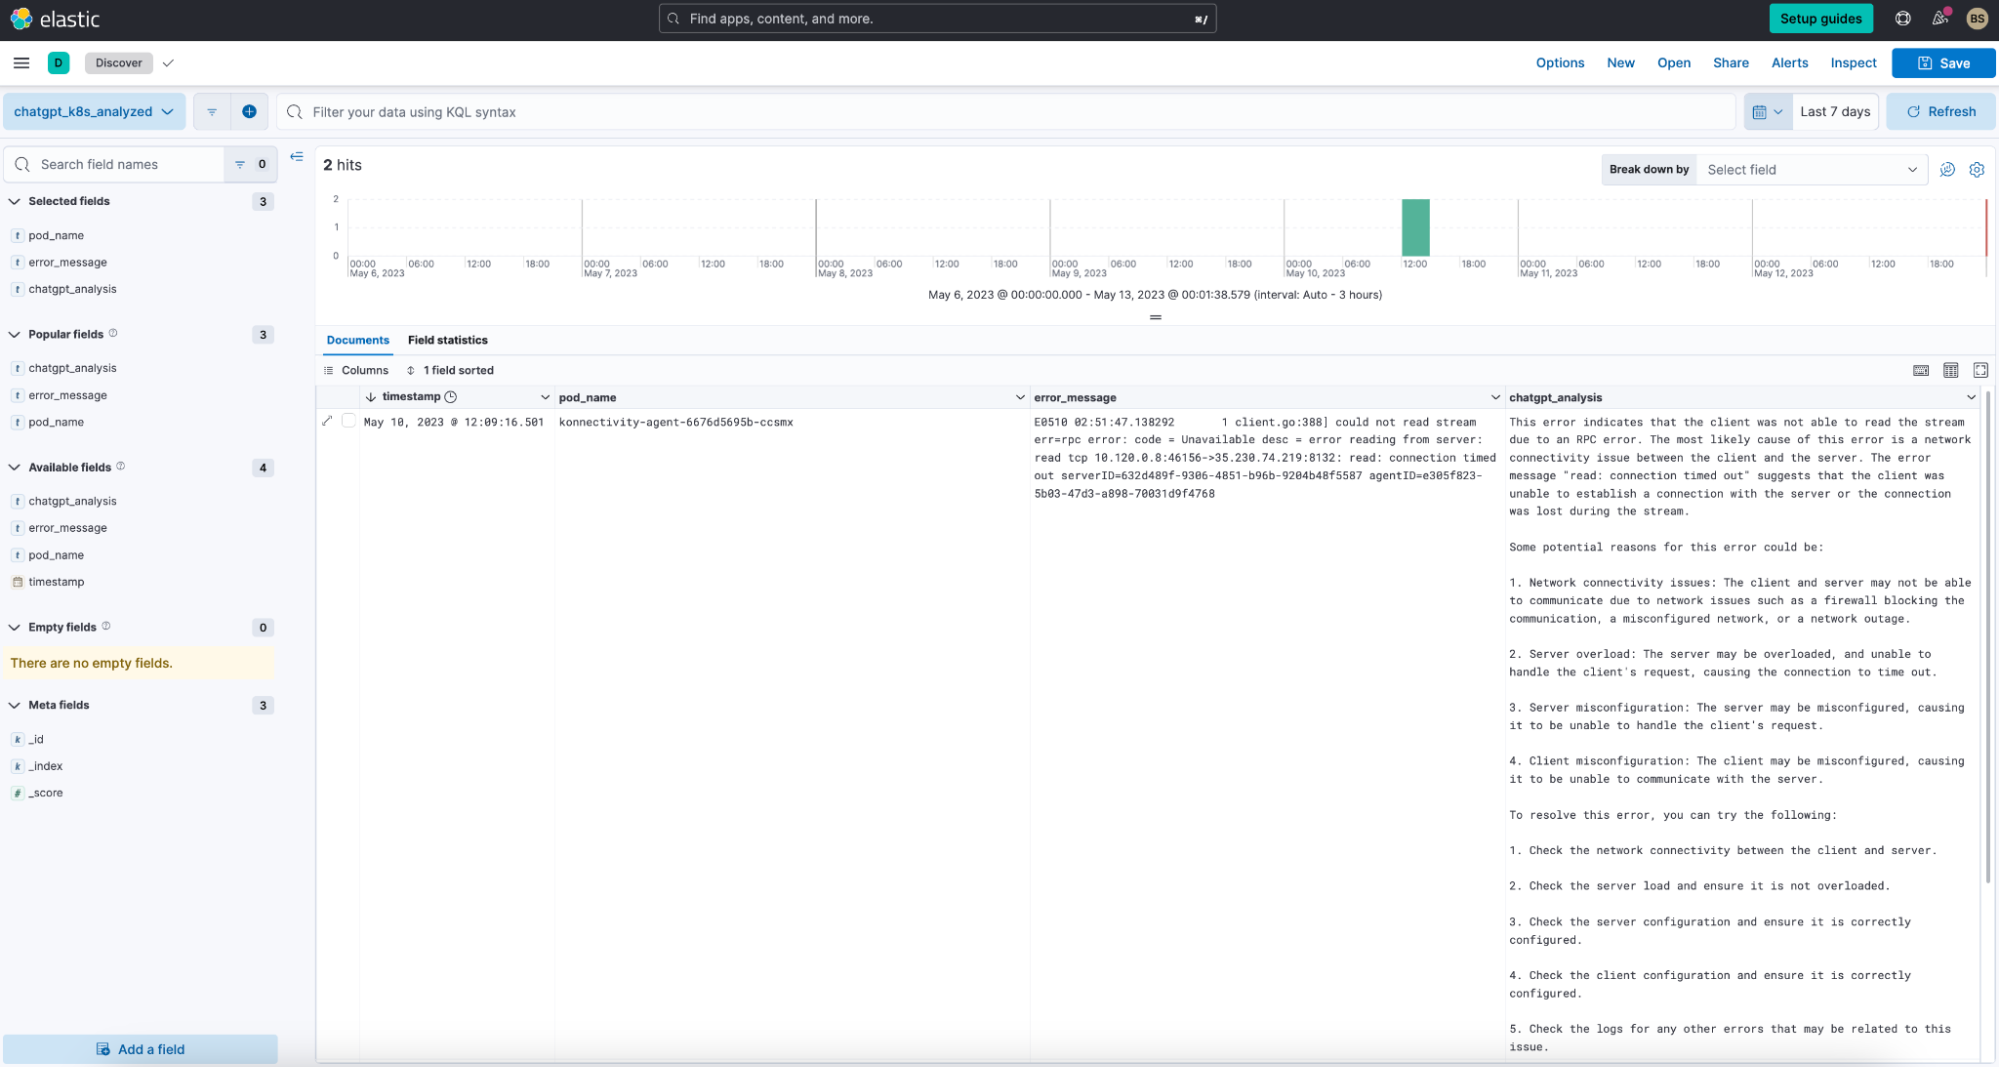
To see the results, we created a new data view called chatgpt_k8_analyzed against the newly created index:
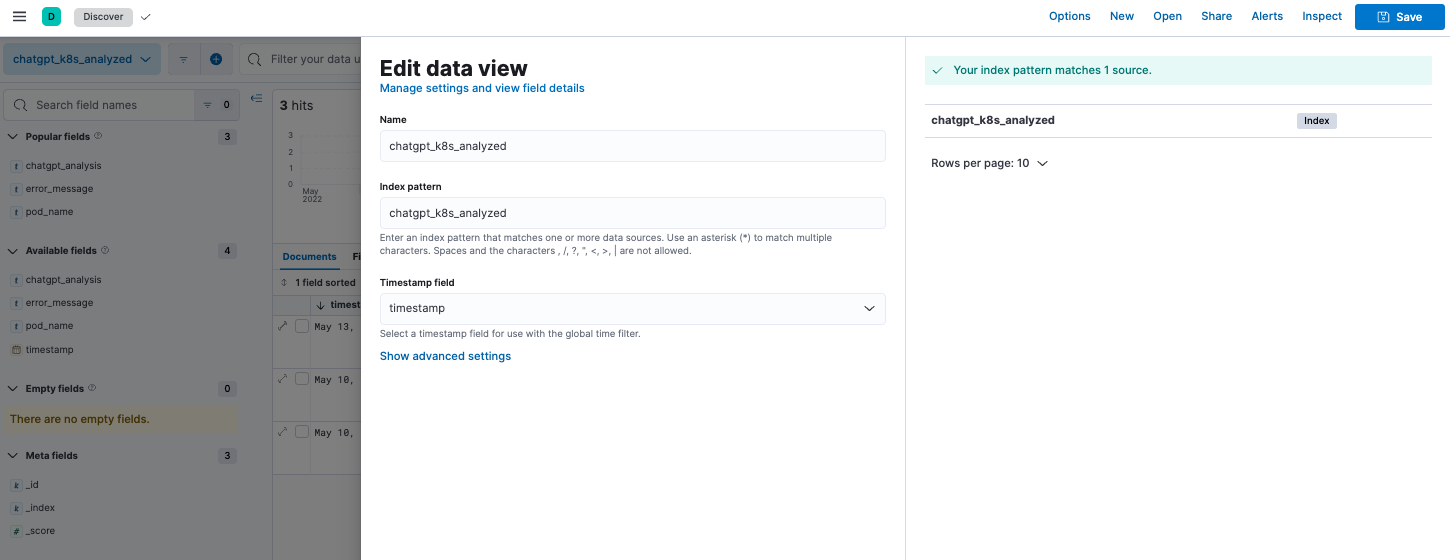
In Discover, the output on the data view provides us with the analysis of the errors.
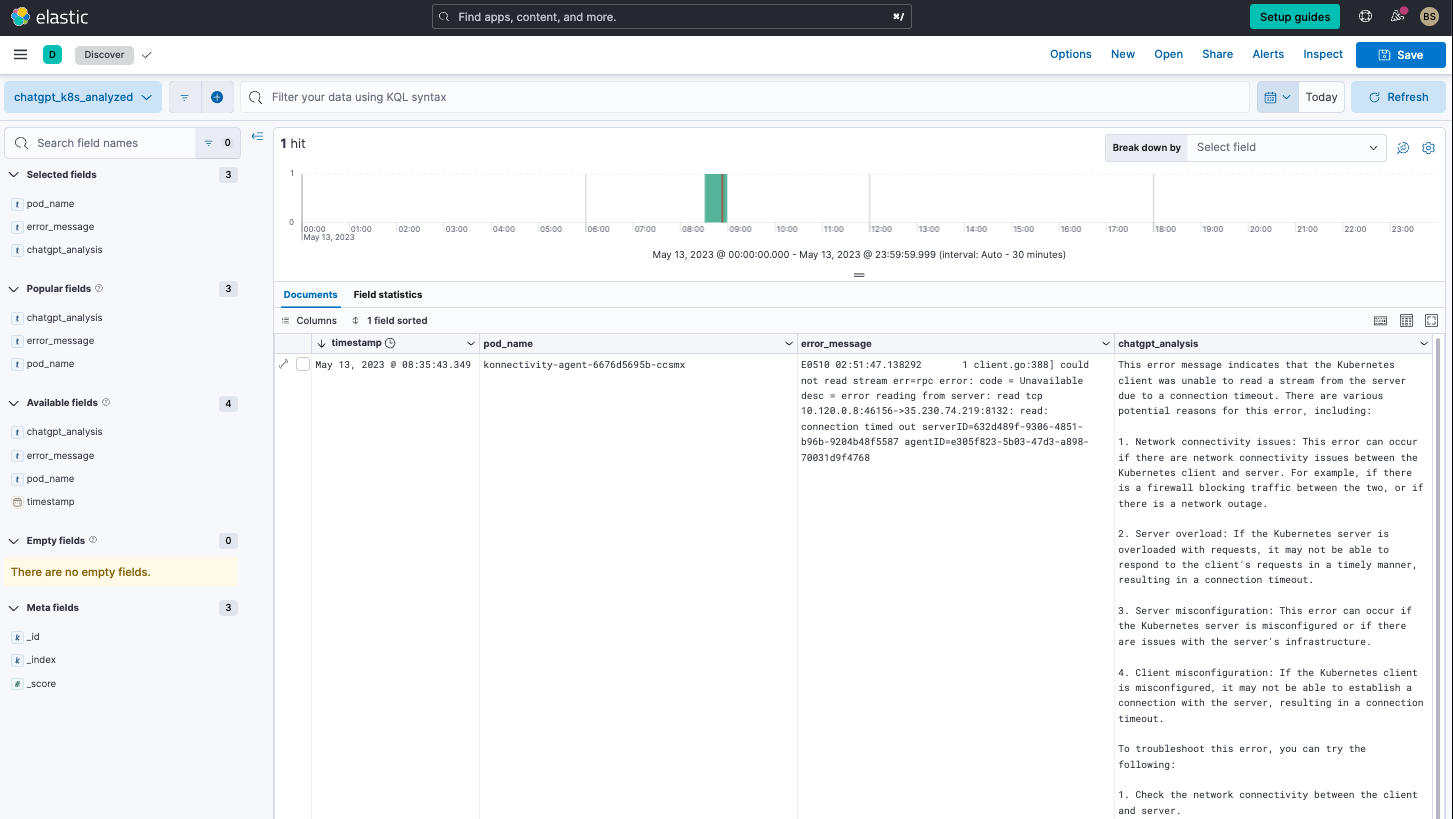
For every error the script sees in the five minute interval, it will get an analysis of the error. We could alternatively also use a range as needed to analyze during a specific time frame. The script would just need to be modified accordingly.
Step 4. Output from Azure OpenAI/OpenAI vs. ChatGPT UI
As you noticed above, we got relatively the same result from the Azure OpenAI API call as we did by testing out our query in the ChatGPT UI. This is because we configured the API call to run the same/similar model as what was selected in the UI.
For the API call, we used the following parameters:
"request": {
             "method" : "POST",
             "Url": "https://XXX.openai.azure.com/openai/deployments/pme-gpt-35-turbo/chat/completions?api-version=2023-03-15-preview",
             "headers": {"api-key" : "XXXXXXX",
                         "content-type" : "application/json"
                        },
             "body" : "{ \"messages\": [ { \"role\": \"system\", \"content\": \"You are a helpful assistant.\"}, { \"role\": \"user\", \"content\": \"What are the potential reasons for the following kubernetes error: {{ctx.payload.second.first_hit}}\"}], \"temperature\": 0.5, \"max_tokens\": 2048}" ,
              "connection_timeout": "60s",
               "read_timeout": "60s"
}By setting the role: system with You are a helpful assistant and using the gpt-35-turbo url portion, we are essentially setting the API to use the davinci model, which is the same as the ChatGPT UI model set by default.
Additionally, for Azure OpenAI Service, you will need to set the URL to something similar the following:
https://YOURSERVICENAME.openai.azure.com/openai/deployments/pme-gpt-35-turbo/chat/completions?api-version=2023-03-15-preview
If you use OpenAI (versus Azure OpenAI Service), the request call (against https://api.openai.com/v1/completions) would be as such:
"request": {
            "scheme": "https",
            "host": "api.openai.com",
            "port": 443,
            "method": "post",
            "path": "\/v1\/completions",
            "params": {},
            "headers": {
               "content-type": "application\/json",
               "authorization": "Bearer YOUR_ACCESS_TOKEN"
                        },
            "body": "{ \"model\": \"text-davinci-003\",  \"prompt\": \"What are the potential reasons for the following kubernetes error: {{ctx.payload.second.first_hit}}\",  \"temperature\": 1,  \"max_tokens\": 512,     \"top_p\": 1.0,      \"frequency_penalty\": 0.0,   \"presence_penalty\": 0.0 }",
            "connection_timeout_in_millis": 60000,
            "read_timeout_millis": 60000
}If you are interested in creating a more OpenAI-based version, you can download an alternative script and look at another blog from an Elastic community member.
Gaining other insights beyond Kubernetes logs
Now that the script is up and running, you can modify it using different:
- Inputs
- Conditions
- Actions
- Transforms
Learn more on how to modify it here. Some examples of modifications could include:
- Look for error logs from application components (e.g., cartService, frontEnd, from the OTel demo), cloud service providers (e.g., AWS/Azure/GCP logs), and even logs from components such as Kafka, databases, etc.
- Vary the time frame from running continuously to running over a specific range.
- Look for specific errors in the logs.
- Query for analysis on a set of errors at once versus just one, which we demonstrated.
The modifications are endless, and of course you can run this with OpenAI rather than Azure OpenAI Service.
Conclusion
I hope you’ve gotten an appreciation for how Elastic Observability can help you connect to OpenAI services (Azure OpenAI, as we showed, or even OpenAI) to better analyze an error log message instead of having to run several Google searches and hunt for possible insights.
Here’s a quick recap of what we covered:
- Developing an Elastic watcher script that can be used to find and send Kubernetes errors into OpenAI and insert them into a new index
- Configuring Azure OpenAI Service or OpenAI with the right authorization and request parameters
Ready to get started? Sign up for Elastic Cloud and try out the features and capabilities I’ve outlined above to get the most value and visibility out of your OpenTelemetry data.
Appendix
Watcher script
PUT _watcher/watch/chatgpt_analysis
{
    "trigger": {
      "schedule": {
        "interval": "5m"
      }
    },
    "input": {
      "chain": {
          "inputs": [
              {
                  "first": {
                      "search": {
                          "request": {
                              "search_type": "query_then_fetch",
                              "indices": [
                                "logs-kubernetes*"
                              ],
                              "rest_total_hits_as_int": true,
                              "body": {
                                "query": {
                                  "bool": {
                                    "must": [
                                      {
                                        "match": {
                                          "kubernetes.container.name": "konnectivity-agent"
                                        }
                                      },
                                      {
                                        "match" : {
                                          "message":"error"
                                        }
                                      }
                                    ]
                                  }
                                },
                                "size": "1"
                              }
                            }
                        }
                    }
                },
                {
                    "second": {
                        "transform": {
                            "script": "return ['first_hit': ctx.payload.first.hits.hits.0._source.message.replace('\"', \"\")]"
                        }
                    }
                },
                {
                    "third": {
                        "http": {
                            "request": {
                                "method" : "POST",
                                "url": "https://XXX.openai.azure.com/openai/deployments/pme-gpt-35-turbo/chat/completions?api-version=2023-03-15-preview",
                                "headers": {
                                    "api-key" : "XXX",
                                    "content-type" : "application/json"
                                },
                                "body" : "{ \"messages\": [ { \"role\": \"system\", \"content\": \"You are a helpful assistant.\"}, { \"role\": \"user\", \"content\": \"What are the potential reasons for the following kubernetes error: {{ctx.payload.second.first_hit}}\"}], \"temperature\": 0.5, \"max_tokens\": 2048}" ,
                                "connection_timeout": "60s",
                                "read_timeout": "60s"
                            }
                        }
                    }
                }
            ]
        }
    },
    "condition": {
      "compare": {
        "ctx.payload.first.hits.total": {
          "gt": 0
        }
      }
    },
    "actions": {
        "index_payload" : {
            "transform": {
                "script": {
                    "source": """
                        def payload = [:];
                        payload.timestamp = new Date();
                        payload.pod_name = ctx.payload.first.hits.hits[0]._source.kubernetes.pod.name;
                        payload.error_message = ctx.payload.second.first_hit;
                        payload.chatgpt_analysis = ctx.payload.third.choices[0].message.content;
                        return payload;
                    """
                }
            },
            "index" : {
                "index" : "chatgpt_k8s_analyzed"
            }
        }
    }
}Additional logging resources:
- Getting started with logging on Elastic (quickstart)
- Ingesting common known logs via integrations (compute node example)
- List of integrations
- Ingesting custom application logs into Elastic
- Enriching logs in Elastic
- Analyzing Logs with Anomaly Detection (ML) and AIOps
Common use case examples with logs:
In this blog post, we may have used third party generative AI tools, which are owned and operated by their respective owners. Elastic does not have any control over the third party tools and we have no responsibility or liability for their content, operation or use, nor for any loss or damage that may arise from your use of such tools. Please exercise caution when using AI tools with personal, sensitive or confidential information. Any data you submit may be used for AI training or other purposes. There is no guarantee that information you provide will be kept secure or confidential. You should familiarize yourself with the privacy practices and terms of use of any generative AI tools prior to use.
Elastic, Elasticsearch and associated marks are trademarks, logos or registered trademarks of Elasticsearch N.V. in the United States and other countries. All other company and product names are trademarks, logos or registered trademarks of their respective owners.
Screenshots of Microsoft products used with permission from Microsoft.

