Root cause analysis with logs: Elastic Observability's AIOps Labs

In the previous blog in our root cause analysis with logs series, we explored how to analyze logs in Elastic Observability with Elastic’s anomaly detection and log categorization capabilities. Elastic’s platform enables you to get started on machine learning (ML) quickly. You don’t need to have a data science team or design a system architecture. Additionally, there’s no need to move data to a third-party framework for model training.
Preconfigured machine learning models for observability and security are available. If those don't work well enough on your data, in-tool wizards guide you through the few steps needed to configure custom anomaly detection and train your model with supervised learning. To get you started, there are several key features built into Elastic Observability to aid in analysis, bypassing the need to run specific ML models. These features help minimize the time and analysis of logs.
Let’s review the set of machine learning-based observability features in Elastic:
Anomaly detection: Elastic Observability, when turned on (see documentation), automatically detects anomalies by continuously modeling the normal behavior of your time series data — learning trends, periodicity, and more — in real time to identify anomalies, streamline root cause analysis, and reduce false positives. Anomaly detection runs in and scales with Elasticsearch and includes an intuitive UI.
Log categorization: Using anomaly detection, Elastic also identifies patterns in your log events quickly. Instead of manually identifying similar logs, the logs categorization view lists log events that have been grouped, based on their messages and formats, so that you can take action more quickly.
High-latency or erroneous transactions: Elastic Observability’s APM capability helps you discover which attributes are contributing to increased transaction latency and identifies which attributes are most influential in distinguishing between transaction failures and successes. Read APM correlations in Elastic Observability: Automatically identifying probable causes of slow or failed transactions for an overview of this capability.
AIOps Labs: AIOps Labs provides two main capabilities using advanced statistical methods:
- Log spike detector helps identify reasons for increases in log rates. It makes it easy to find and investigate the causes of unusual spikes by using the analysis workflow view. Examine the histogram chart of the log rates for a given data view, and find the reason behind a particular change possibly in millions of log events across multiple fields and values.
- Log pattern analysis helps you find patterns in unstructured log messages and makes it easier to examine your data. It performs categorization analysis on a selected field of a data view, creates categories based on the data, and displays them together with a chart that shows the distribution of each category and an example document that matches the category.
As we showed in the last blog, using machine learning-based features helps minimize the extremely tedious and time-consuming process of analyzing data using traditional methods, such as alerting and simple pattern matching (visual or simple searching, etc.). Trying to find the needle in the haystack requires the use of some level of artificial intelligence due to the increasing amounts of telemetry data (logs, metrics, and traces) being collected across ever-growing applications.
In this blog post, we’ll cover two capabilities found in Elastic’s AIOps Labs: log spike detector and log pattern analysis. We’ll use the same data from the previous blog and analyze it using these two capabilities.
We will cover log spike detector and log pattern analysis against the popular Hipster Shop app developed by Google, and modified recently by OpenTelemetry.
Overviews of high-latency capabilities can be found here, and an overview of AIOps labs can be found here.
Below, we will examine a scenario where we use anomaly detection and log categorization to help identify a root cause of an issue in Hipster Shop.
Prerequisites and config
If you plan on following this blog, here are some of the components and details we used to set up this demonstration:
- Ensure you have an account on Elastic Cloud and a deployed stack (see instructions here) on AWS. Deploying this on AWS is required for Elastic Serverless Forwarder.
- Utilize a version of the popular Hipster Shop demo application. It was originally written by Google to showcase Kubernetes across a multitude of variants available, such as the OpenTelemetry Demo App. The Elastic version is found here.
- Ensure you have configured the app for either Elastic APM agents or OpenTelemetry agents. For more details, please refer to these two blogs: Independence with OTel in Elastic and Observability and Security with OTel in Elastic. Additionally, review the OTel documentation in Elastic.
- Look through an overview of Elastic Observability APM capabilities.
- Look through our anomaly detection documentation for logs and log categorization documentation.
Once you’ve instrumented your application with APM (Elastic or OTel) agents and are ingesting metrics and logs into Elastic Observability, you should see a service map for the application as follows:
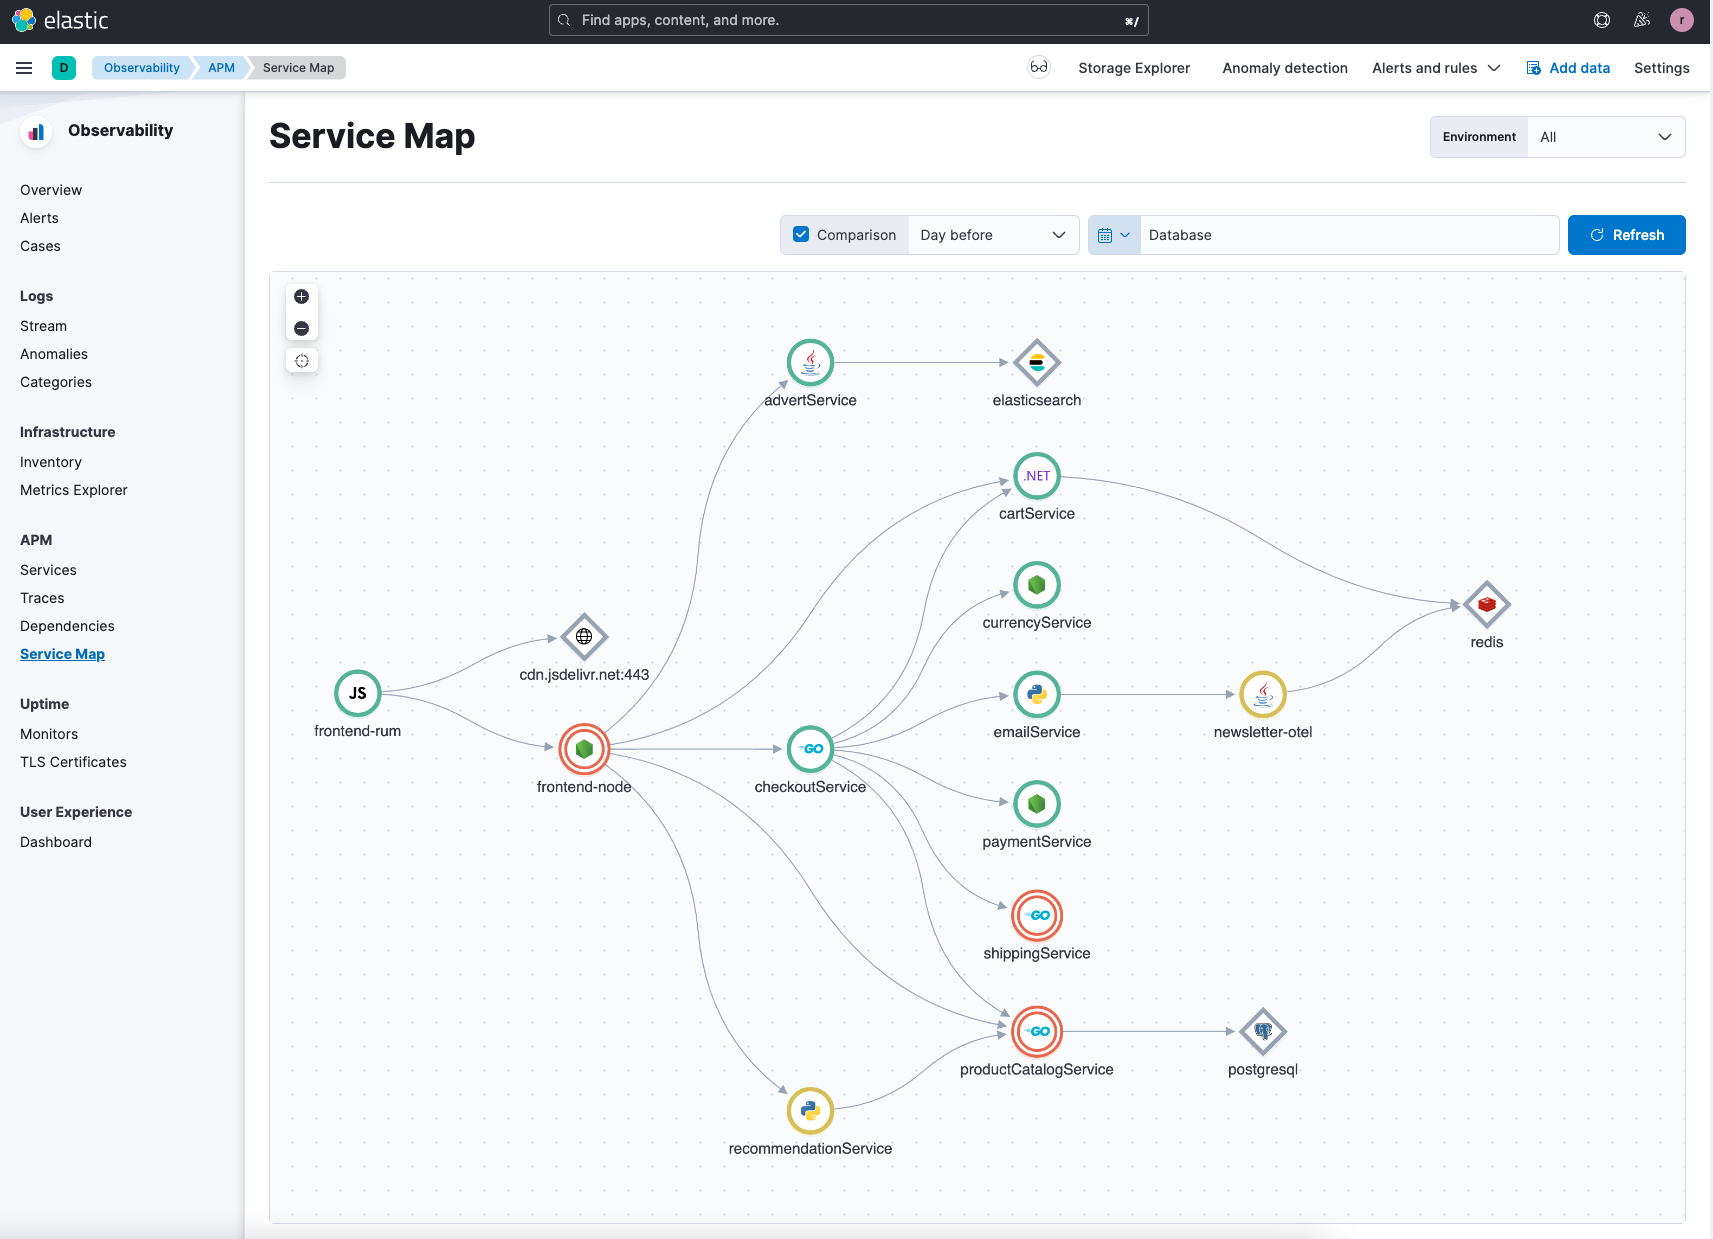
In our example, we’ve introduced issues to help walk you through the root cause analysis features. You might have a different set of issues depending on how you load the application and/or introduce specific feature flags.
As part of the walk-through, we’ll assume we are DevOps or SRE managing this application in production.
Root cause analysis
While the application has been running normally for some time, you get a notification that some of the services are unhealthy. This can occur from the notification setting you’ve set up in Elastic or other external notification platforms (including customer-related issues). In this instance, we’re assuming that customer support has called in multiple customer complaints about the website.
How do you as a DevOps or SRE investigate this? We will walk through two avenues in Elastic to investigate the issue:
- Log spike analysis
- Log pattern analysis
While we show these two paths separately, they can be used in conjunction and are complementary, as they are both tools Elastic Observability provides to help you troubleshoot and identify a root cause.
Starting with the service map, you can see anomalies identified with red circles and as we select them, Elastic will provide a score for the anomaly.
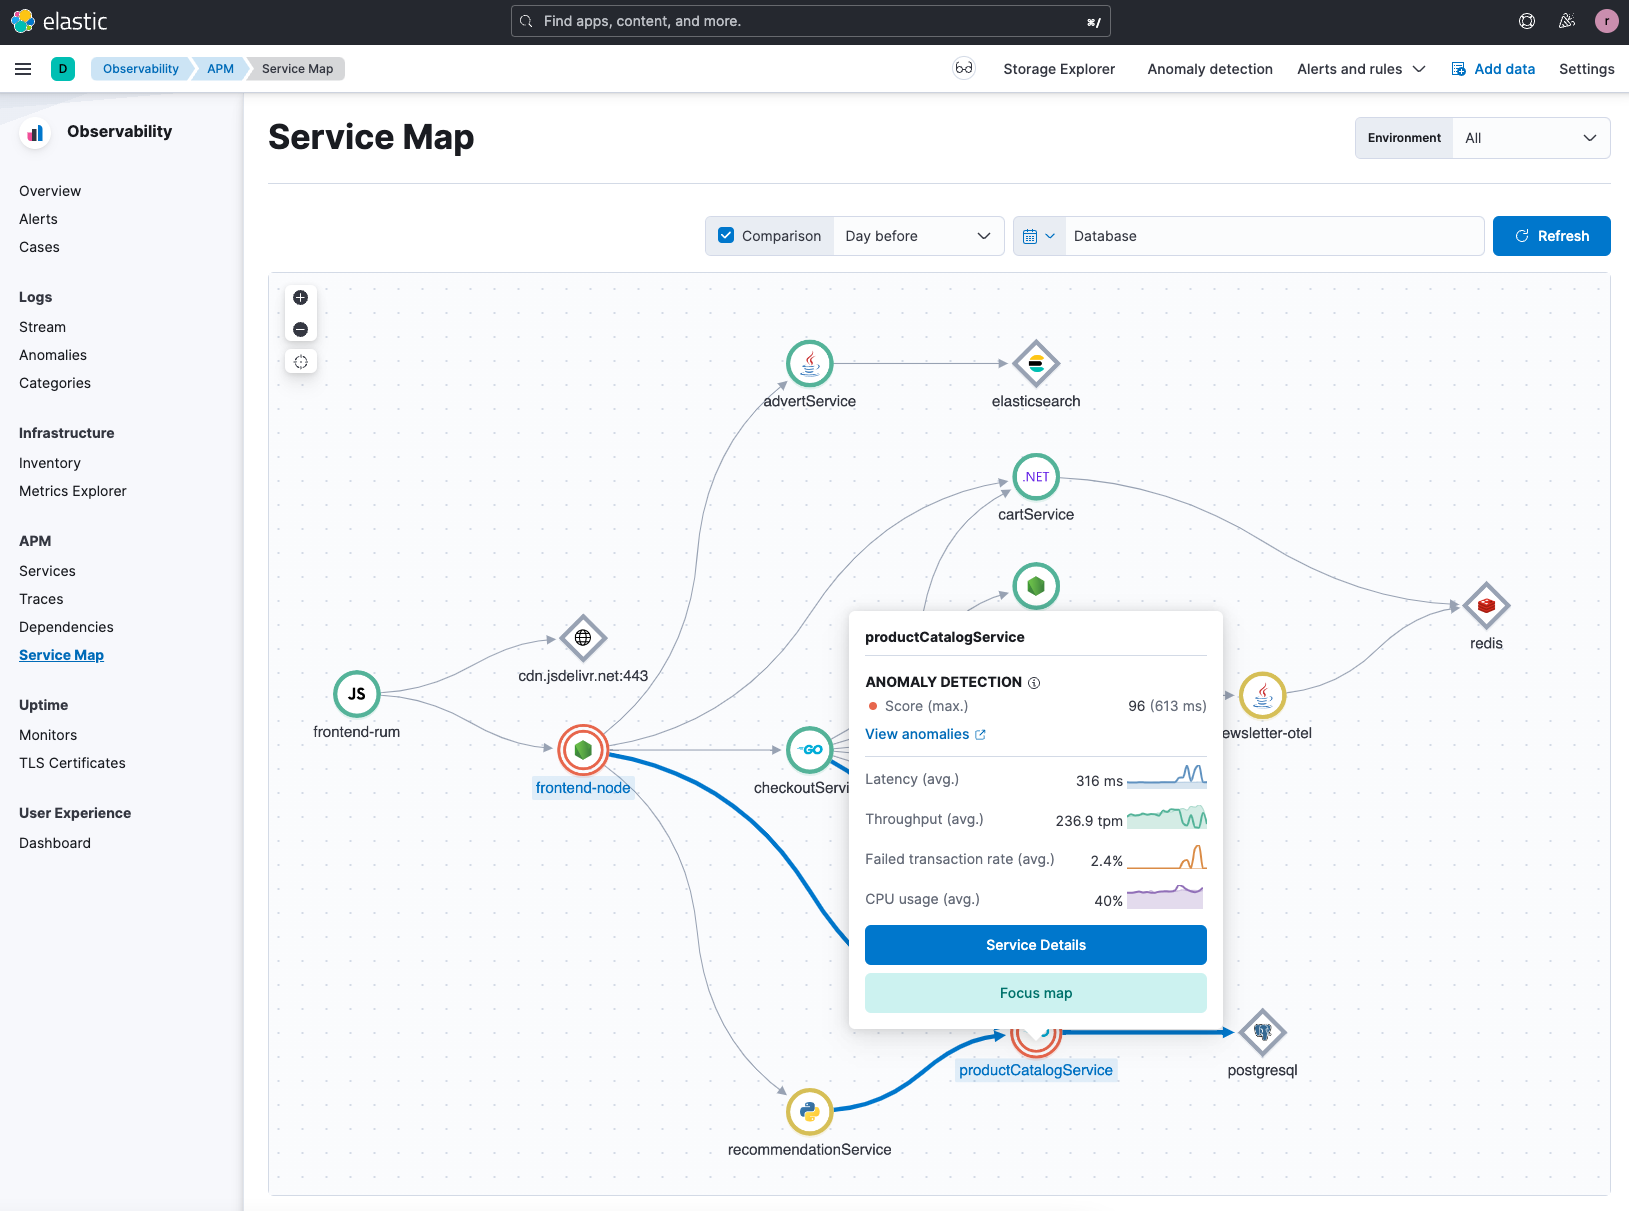
In this example, we can see that there is a score of 96 for a specific anomaly for the productCatalogService in the Hipster Shop application. An anomaly score indicates the significance of the anomaly compared to previously seen anomalies. Rather than jump into anomaly detection (see previous blog), let’s look at some of the potential issues by reviewing the service details in APM.
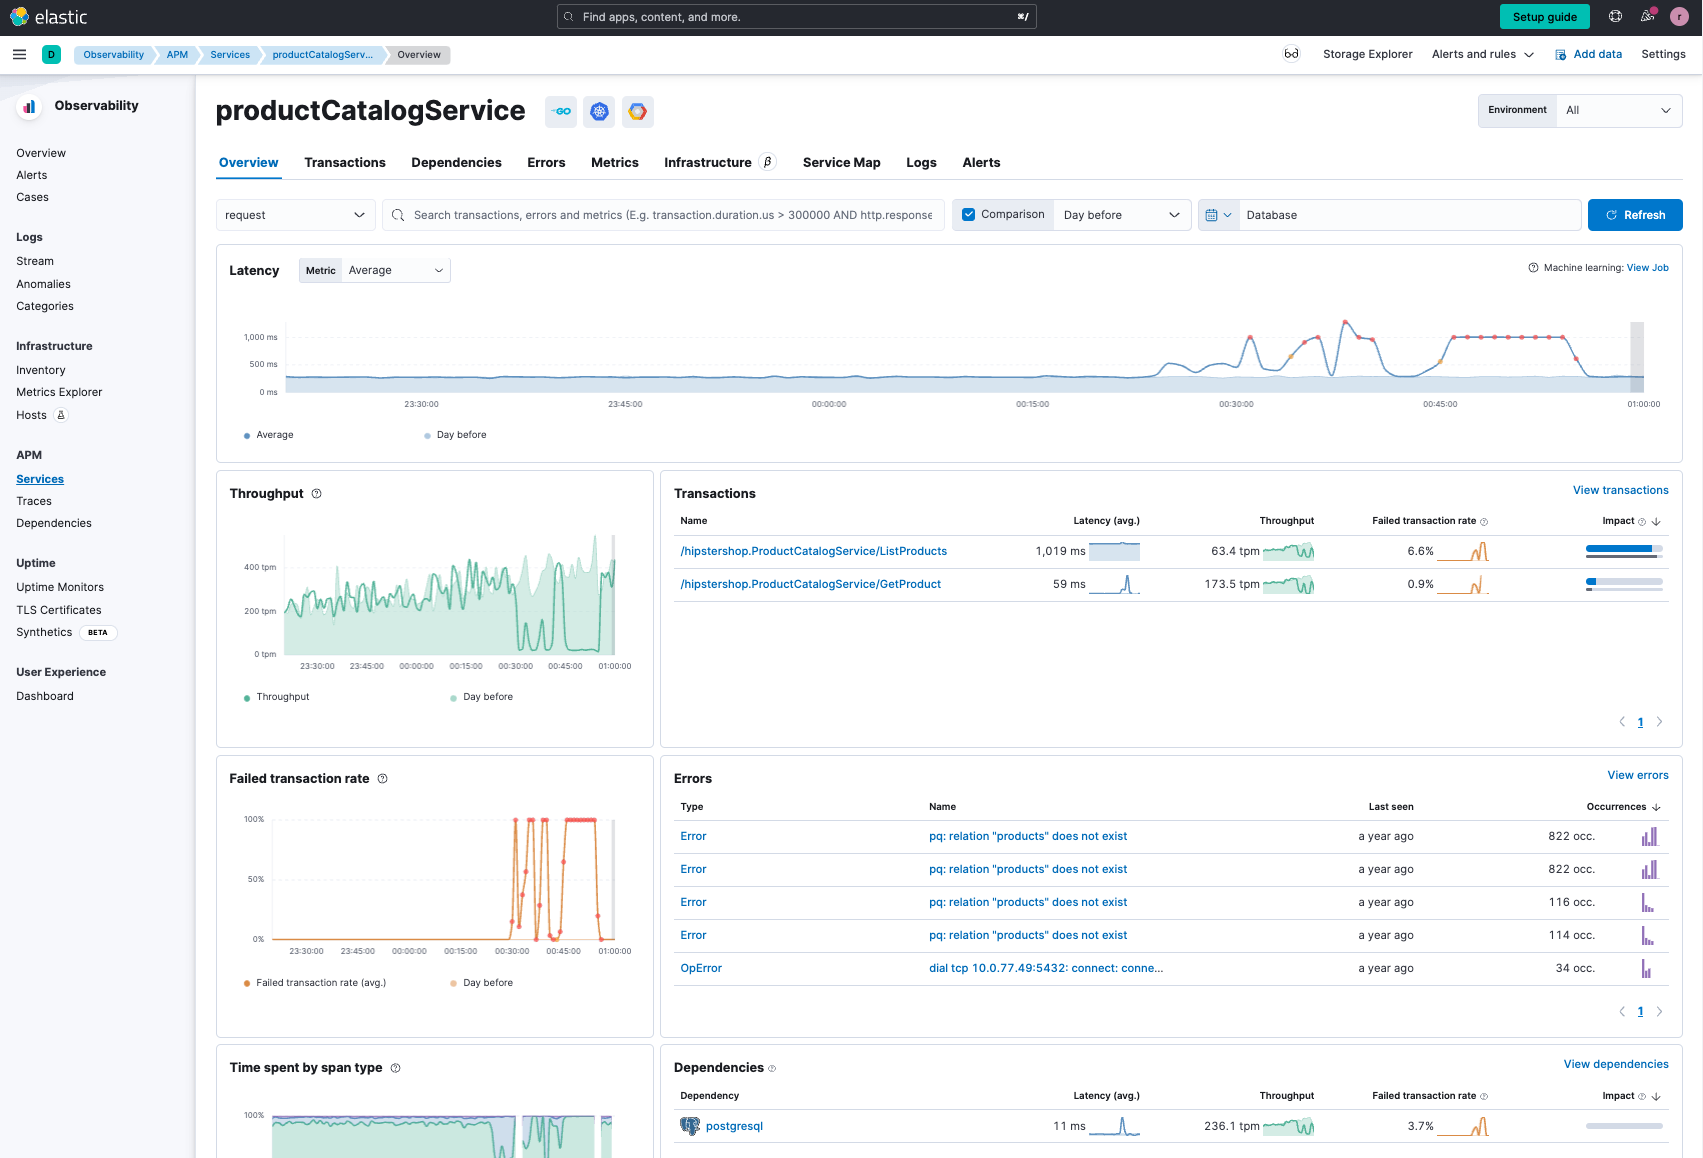
What we see for the productCatalogService is that there are latency issues, failed transactions, a large number of issues, and a dependency to PostgreSQL. When we look at the errors in more detail and drill down, we see they are all coming from PQ - which is a PostgreSQL driver in Go.
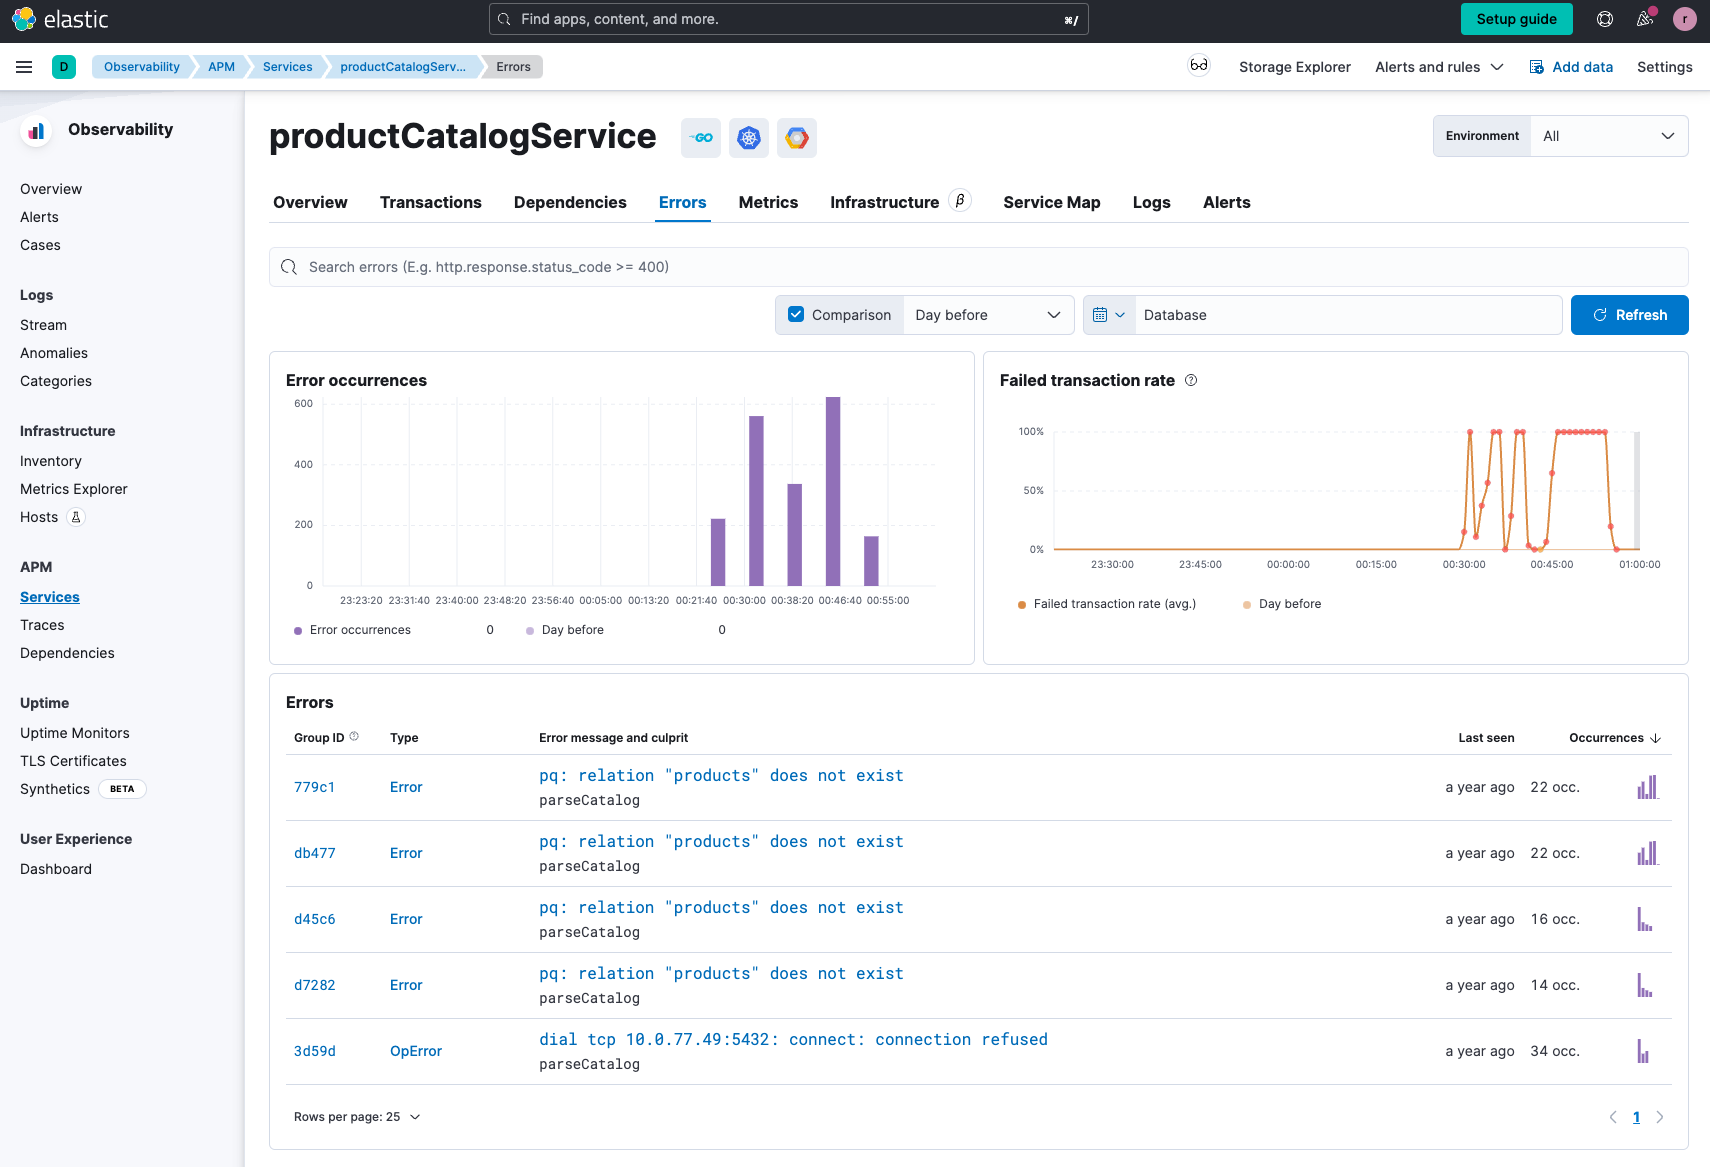
As we drill further, we still can’t tell why the productCatalogService is not able to pull information from the PostgreSQL database.
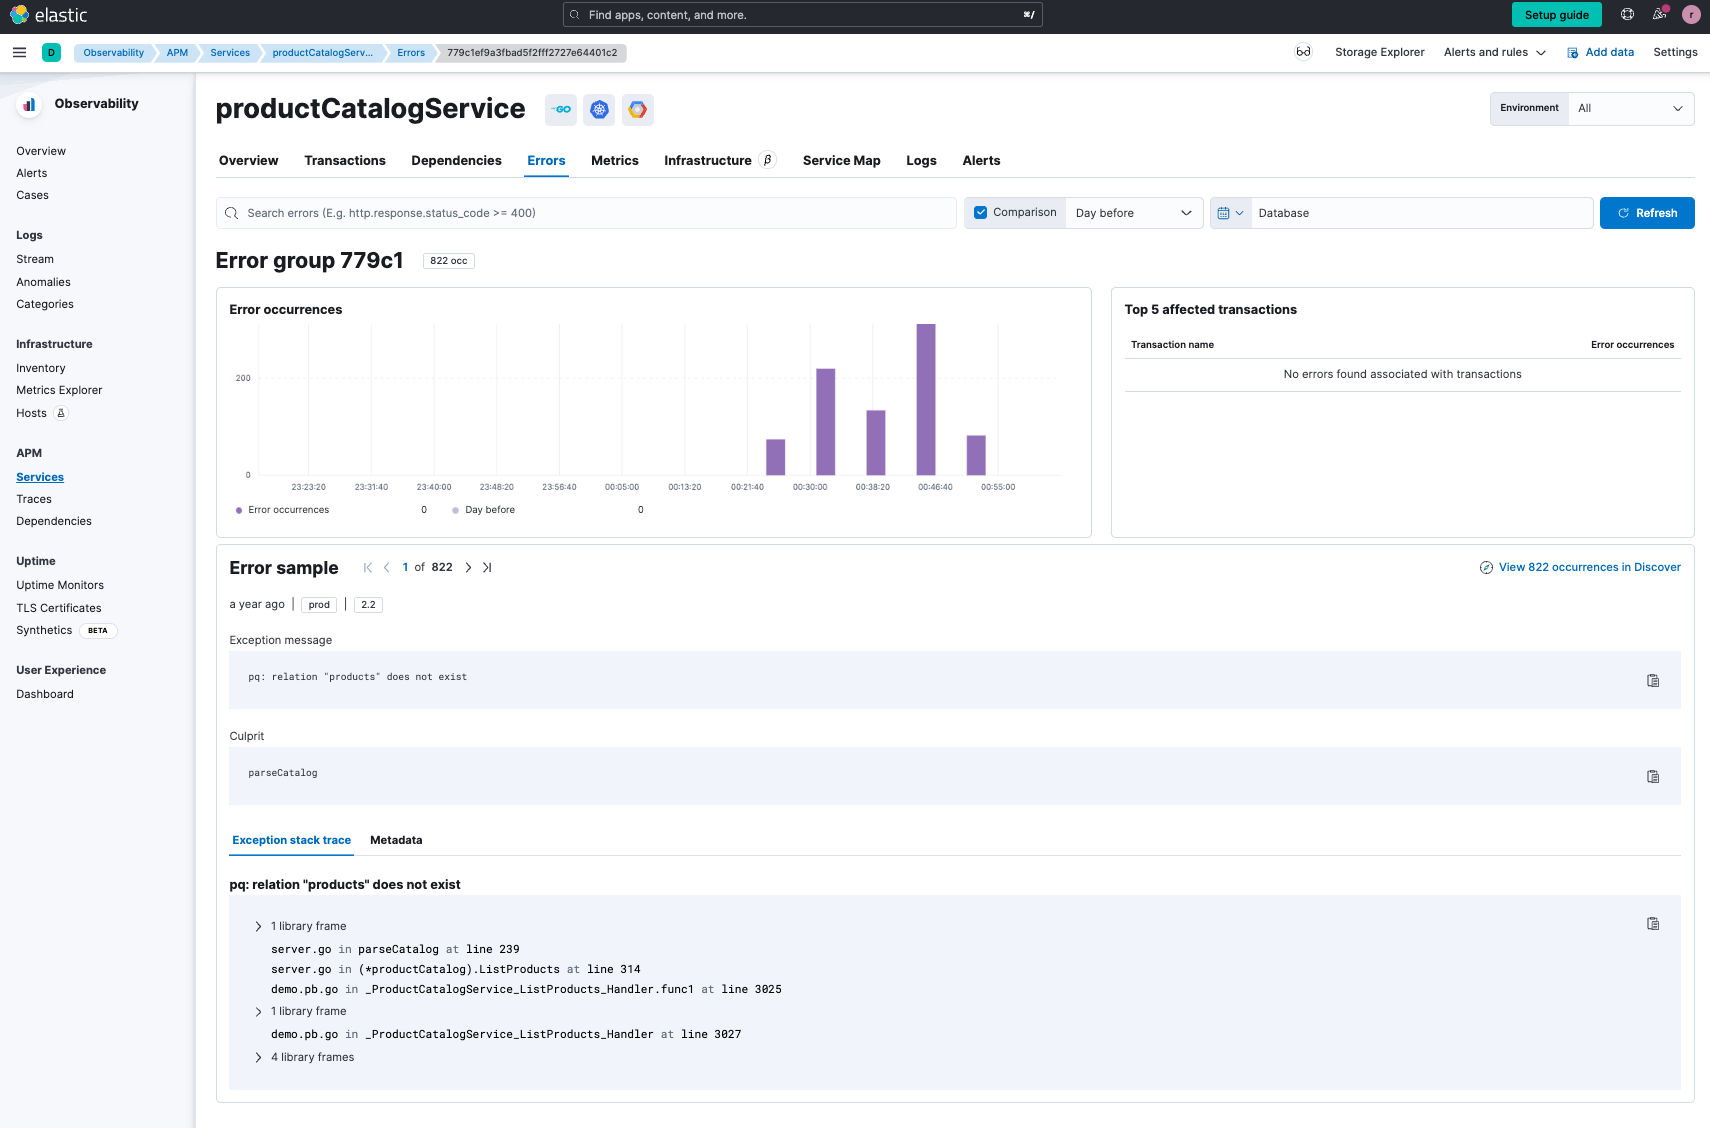
We see that there is a spike in errors, so let's see if we can gleam further insight using one of our two options:
- Log rate spikes
- Log pattern analysis
Log rate spikes
Let’s start with the log rate spikes detector capability from Elastic’s AIOps Labs section of Elastic’s machine learning capabilities. We also pre-select analyzing the spike against a baseline history.
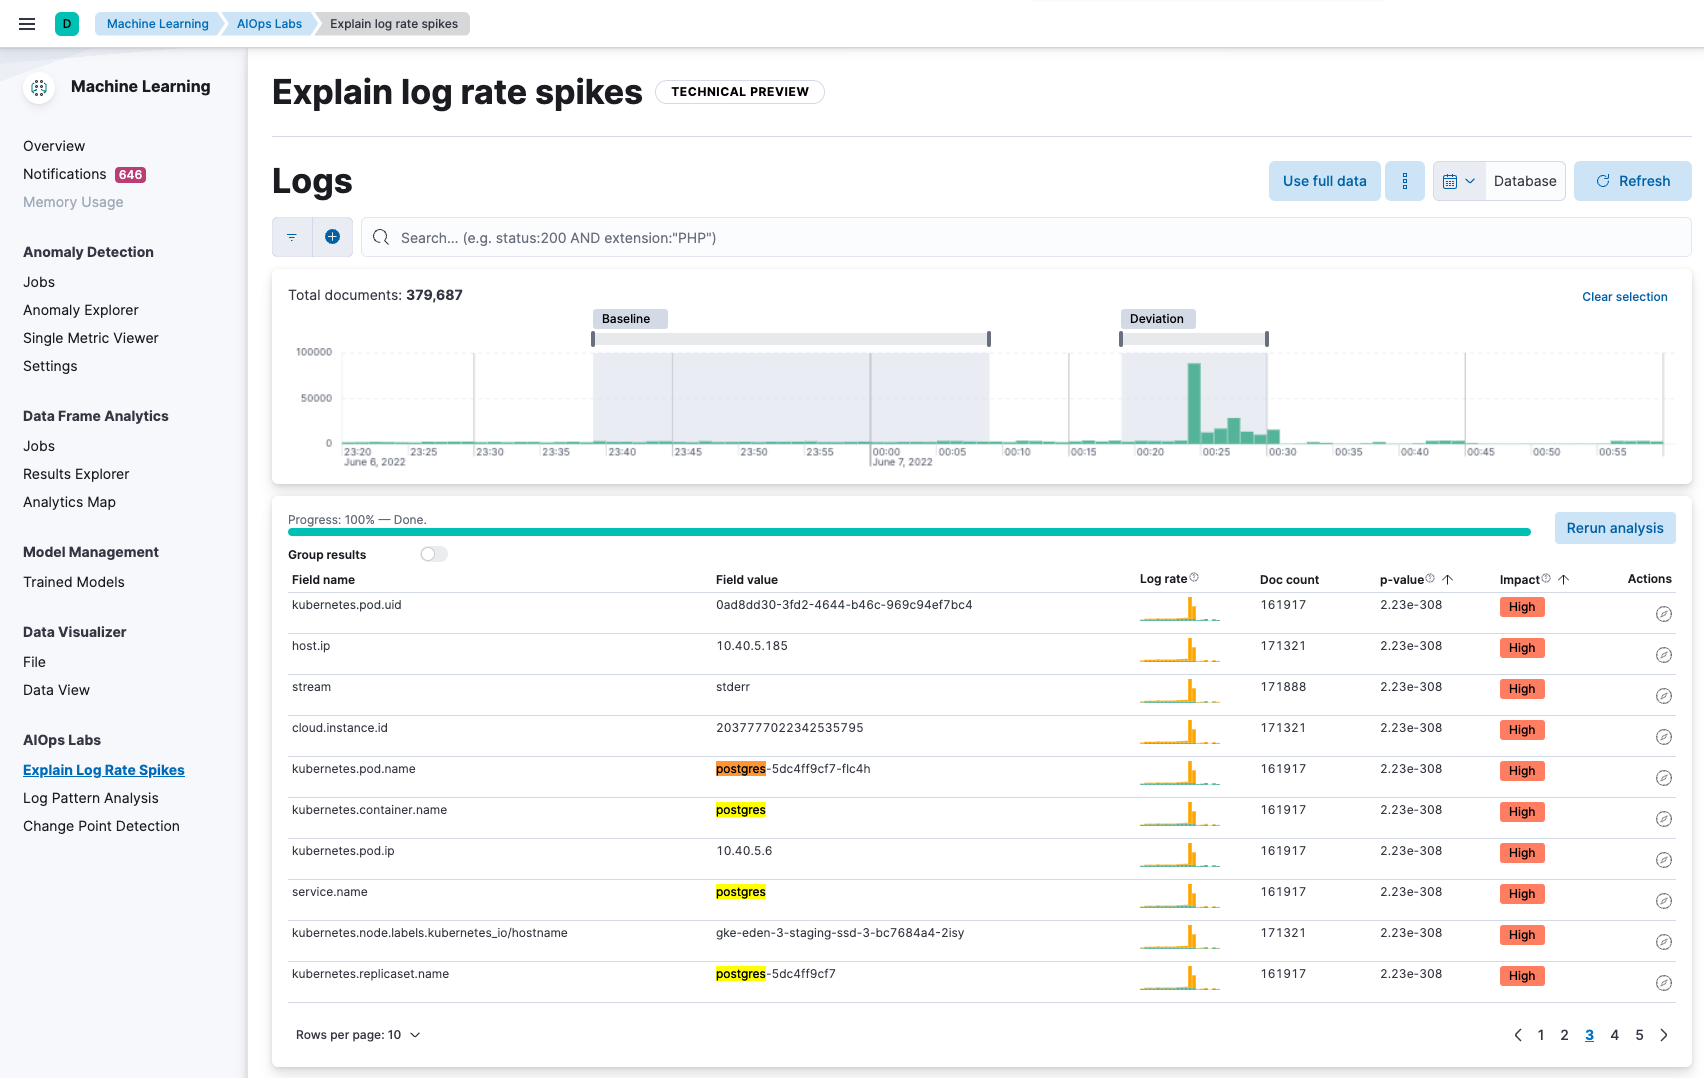
The log rate spikes detector has looked at all the logs from the spike and compared them to the baseline, and it's seeing higher-than-normal counts in specific log messages. From a visual inspection, we see that PostgreSQL log messages are high. We further filter this with postgres.
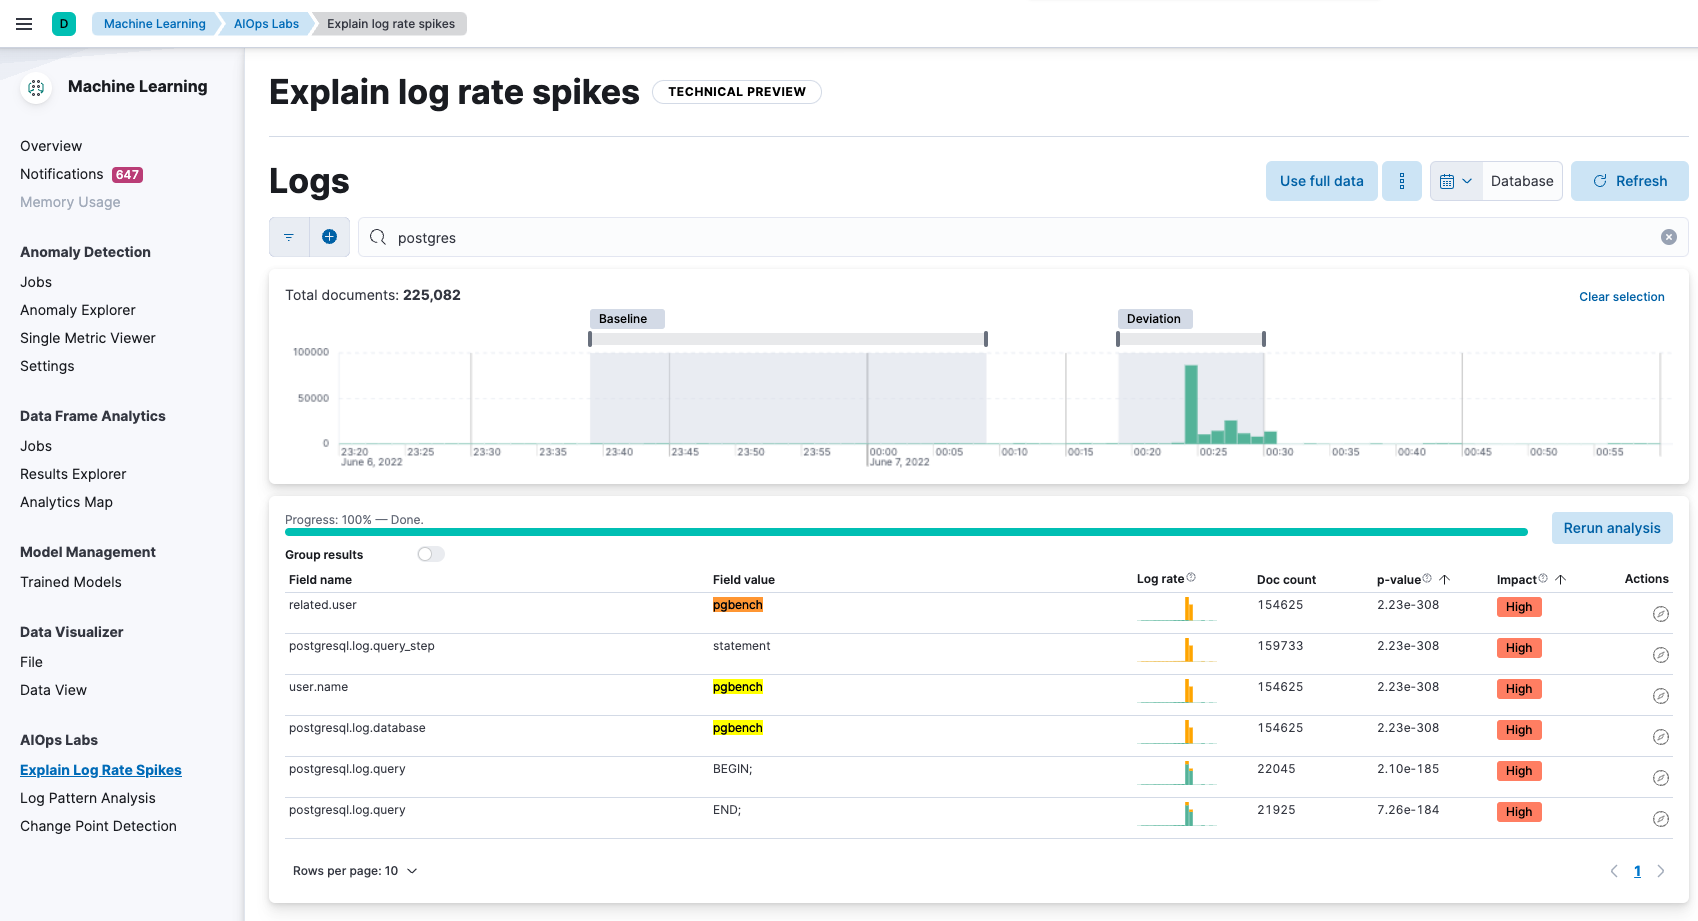
We immediately notice that this issue is potentially caused by pgbench, a popular PostgreSQL tool to help benchmark the database. pgbench runs the same sequence of SQL commands over and over, possibly in multiple, concurrent database sessions. While pgbench is definitely a useful tool, it should not be used in a production environment as it causes a heavy load on the database host, likely causing higher latency issues on the site.
While this may or may not be the ultimate root cause, we have rather quickly identified a potential issue that has a high probability of being the root cause. An engineer likely intended to run pgbench against a staging database to evaluate its performance, and not the production environment.
Log pattern analysis
Instead of log rate spikes, let’s use log pattern analysis to investigate the spike in errors we saw in productCatalogService. In AIOps Labs, we simply select Log Pattern Analysis, use Logs data, filter the results with postgres (since we know it's related to PostgreSQL), and look at information from the message field of the logs we are processing. We see the following:
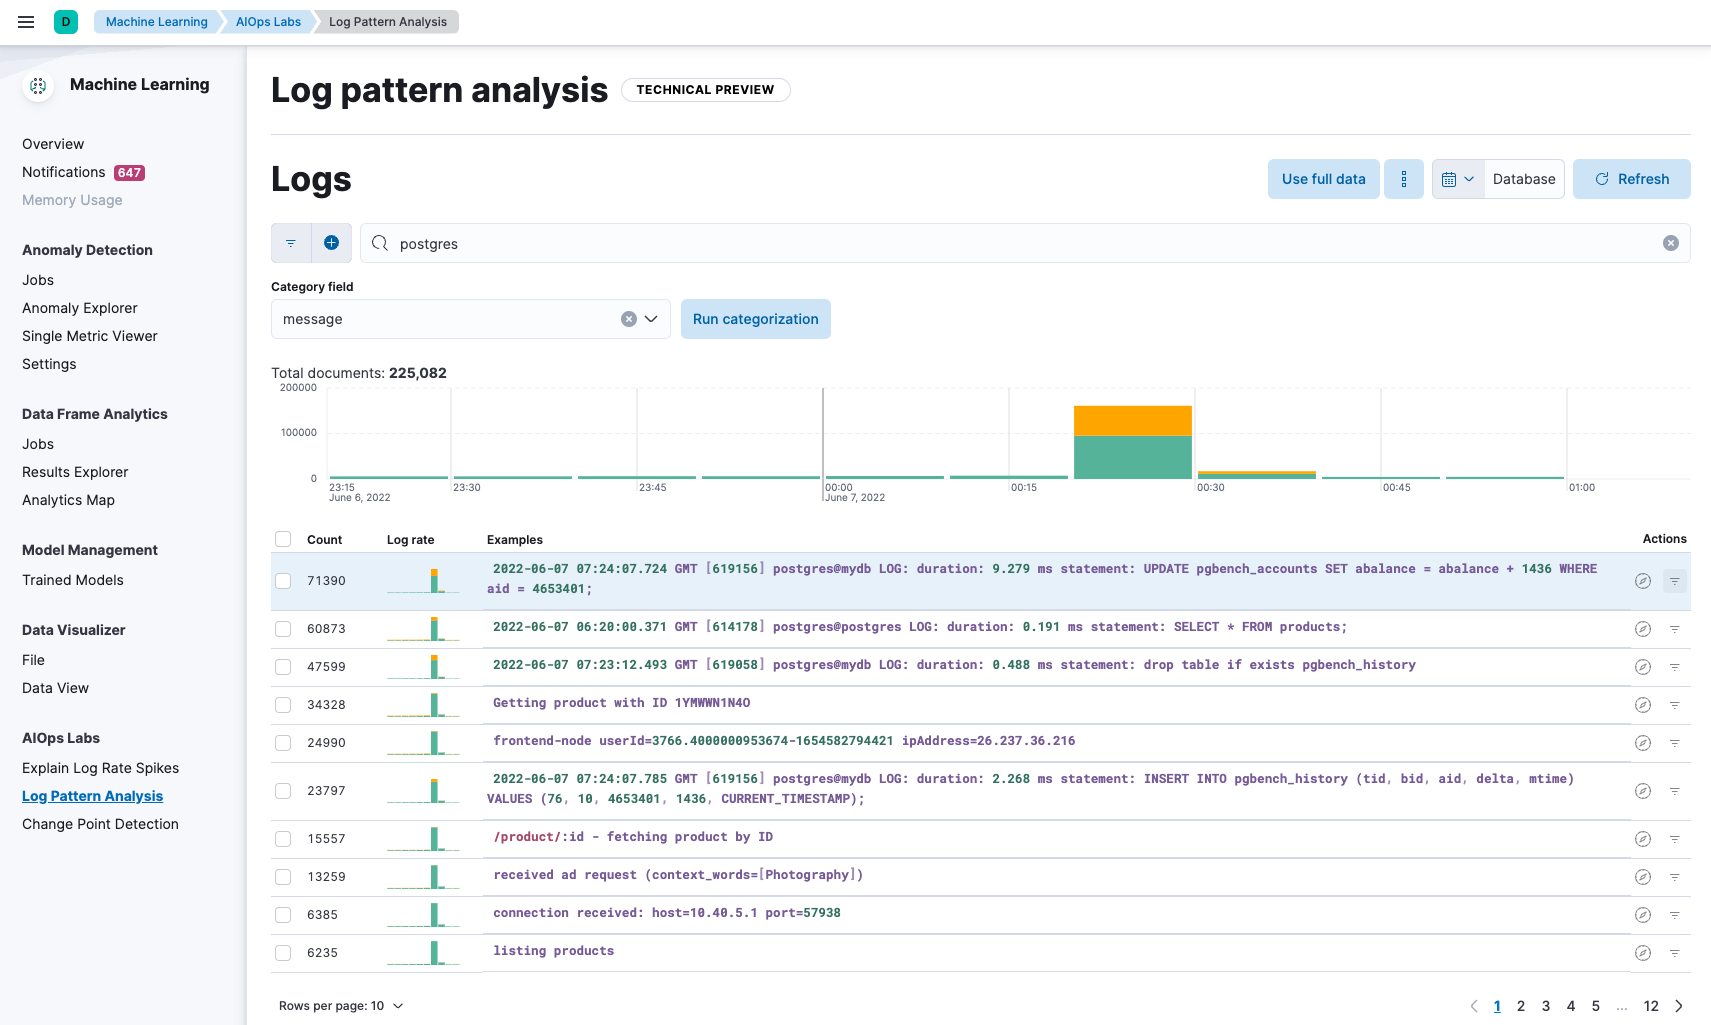
Almost immediately we see the biggest pattern it finds is a log message where pgbench is updating the database. We can further directly drill into this log message from log pattern analysis into Discover and review the details and further analyze the messages.
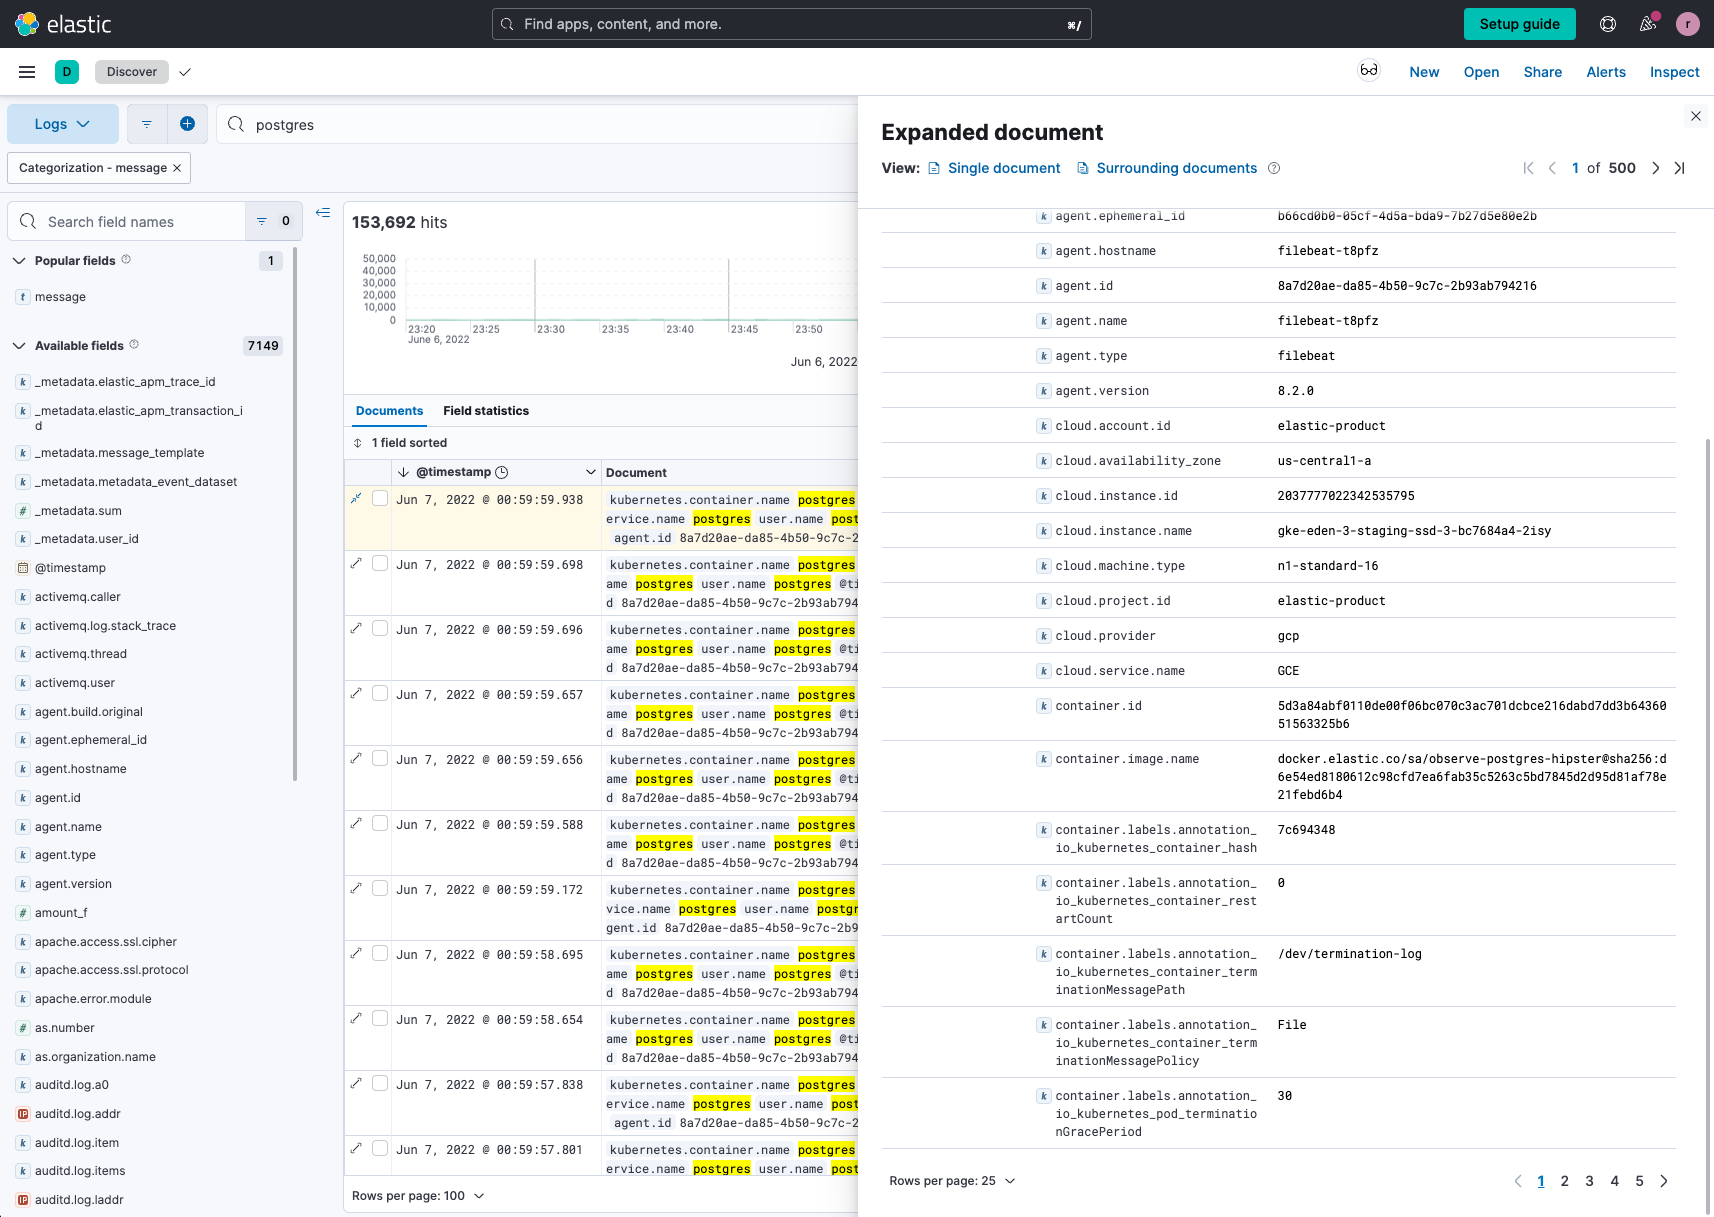
As we mentioned in the previous section, while it may or may not be the root cause, it quickly gives us a place to start and a potential root cause. A developer likely intended to run pgbench against a staging database to evaluate its performance, and not the production environment.
Conclusion
Between the first blog and this one, we’ve shown how Elastic Observability can help you further identify and get closer to pinpointing the root cause of issues without having to look for a “needle in a haystack.” Here’s a quick recap of what you learned in this blog.
- Elastic Observability has numerous capabilities to help you reduce your time to find the root cause and improve your MTTR (even MTTD). In particular, we reviewed the following two main capabilities (found in AIOps Labs in Elastic) in this blog:
- Log rate spikes detector helps identify reasons for increases in log rates. It makes it easy to find and investigate the causes of unusual spikes by using the analysis workflow view. Examine the histogram chart of the log rates for a given data view, and find the reason behind a particular change possibly in millions of log events across multiple fields and values.
- Log pattern analysis helps you find patterns in unstructured log messages and makes it easier to examine your data. It performs categorization analysis on a selected field of a data view, creates categories based on the data, and displays them together with a chart that shows the distribution of each category and an example document that matches the category.
- You learned how easy and simple it is to use Elastic Observability’s log categorization and anomaly detection capabilities without having to understand machine learning (which helps drive these features) or having to do any lengthy setups.
Ready to get started? Register for Elastic Cloud and try out the features and capabilities outlined above.
Additional logging resources:
- Getting started with logging on Elastic (quickstart)
- Ingesting common known logs via integrations (compute node example)
- List of integrations
- Ingesting custom application logs into Elastic
- Enriching logs in Elastic
- Analyzing Logs with Anomaly Detection (ML) and AIOps

