Independence with OpenTelemetry on Elastic
.jpg)
The drive for faster, more scalable services is on the rise. Our day-to-day lives depend on apps, from a food delivery app to have your favorite meal delivered, to your banking app to manage your accounts, to even apps to schedule doctor’s appointments. These apps need to be able to grow from not only a features standpoint but also in terms of user capacity. The scale and need for global reach drives increasing complexity for these high-demand cloud applications.
In order to keep pace with demand, most of these online apps and services (for example, mobile applications, web pages, SaaS) are moving to a distributed microservice-based architecture and Kubernetes. Once you’ve migrated your app to the cloud, how do you manage and monitor production, scale, and availability of the service? OpenTelemetry is quickly becoming the de facto standard for instrumentation and collecting application telemetry data for Kubernetes applications.
OpenTelemetry (OTel) is an open source project providing a collection of tools, APIs, and SDKs that can be used to generate, collect, and export telemetry data (metrics, logs, and traces) to understand software performance and behavior. OpenTelemetry recently became a CNCF incubating project and has a significant amount of growing community and vendor support.
While OTel provides a standard way to instrument applications with a standard telemetry format, it doesn’t provide any backend or analytics components. Hence using OTel libraries in applications, infrastructure, and user experience monitoring provides flexibility in choosing the appropriate observability tool of choice. There is no longer any vendor lock-in for application performance monitoring (APM).
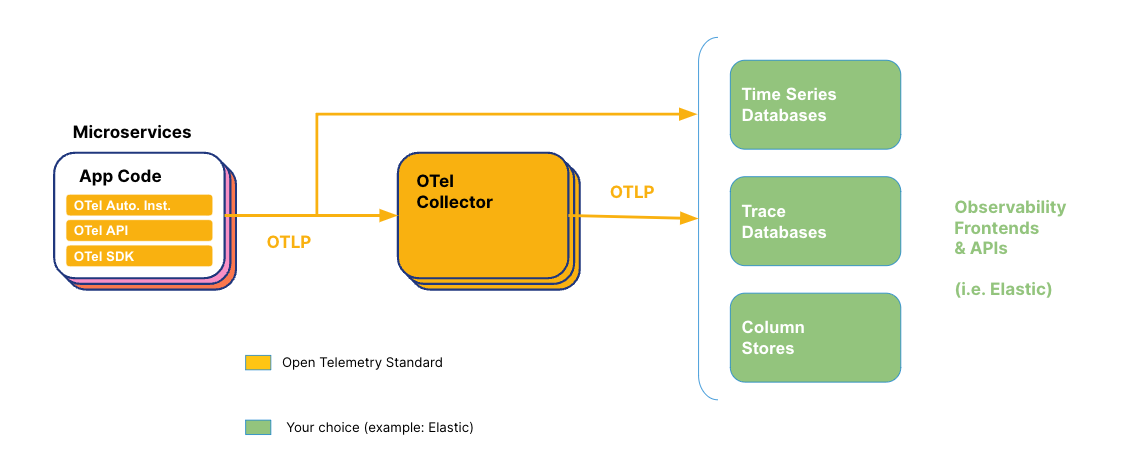
Elastic Observability natively supports OpenTelemetry and its OpenTelemetry protocol (OTLP) to ingest traces, metrics, and logs. All of Elastic Observability’s APM capabilities are available with OTel data. Hence the following capabilities (and more) are available for OTel data:
- Service maps
- Service details (latency, throughput, failed transactions)
- Dependencies between services
- Transactions (traces)
- ML correlations (specifically for latency)
- Service logs
In addition to Elastic’s APM and unified view of the telemetry data, you will now be able to use Elastic’s powerful machine learning capabilities to reduce the analysis, and alerting to help reduce MTTR.
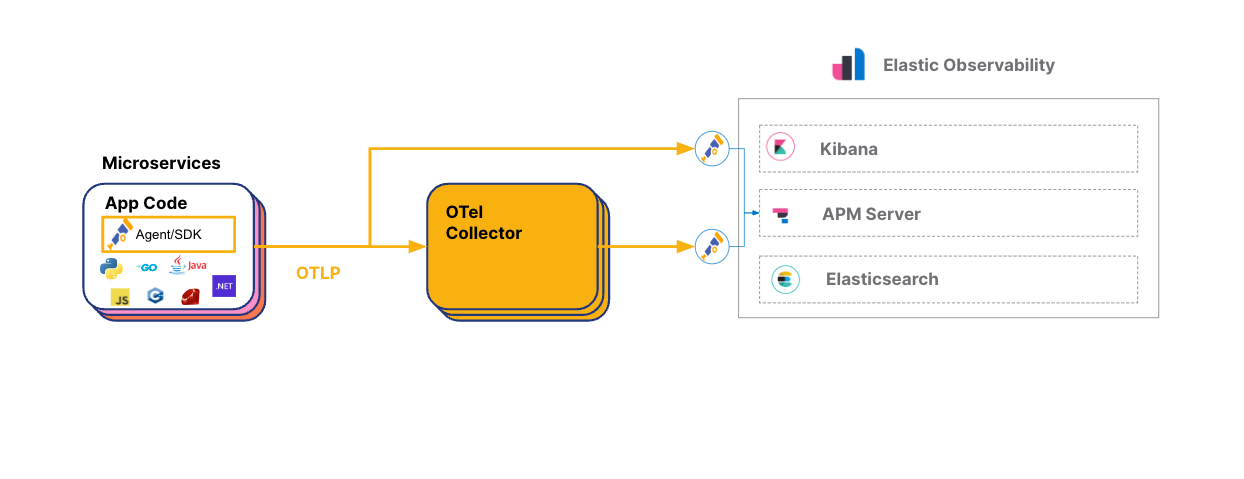
Given its open source heritage, Elastic also supports other CNCF based projects, such as Prometheus, Fluentd, Fluent Bit, Istio, Kubernetes (K8S), and many more.
This blog will show:
- How to get a popular OTel instrumented demo app (Hipster Shop) configured to ingest into Elastic Cloud through a few easy steps
- Highlight some of the Elastic APM capabilities and features around OTel data and what you can do with this data once it’s in Elastic
In follow-up blogs, we will detail how to use Elastic’s machine learning with OTel telemetry data, how to instrument OTel application metrics for specific languages, how we can support Prometheus ingest through the OTel collector, and more. Stay tuned!
Prerequisites and config
If you plan on following this blog, here are some of the components and details we used to set up the configuration:
- Ensure you have an account on Elastic Cloud and a deployed stack (see instructions here).
- We used the OpenTelemetry Demo. Directions for using Elastic with OpenTelemetry Demo are here.
- Make sure you have kubectl and helm also installed locally.
- Additionally, we are using an OTel manually instrumented version of the application. No OTel automatic instrumentation was used in this blog configuration.
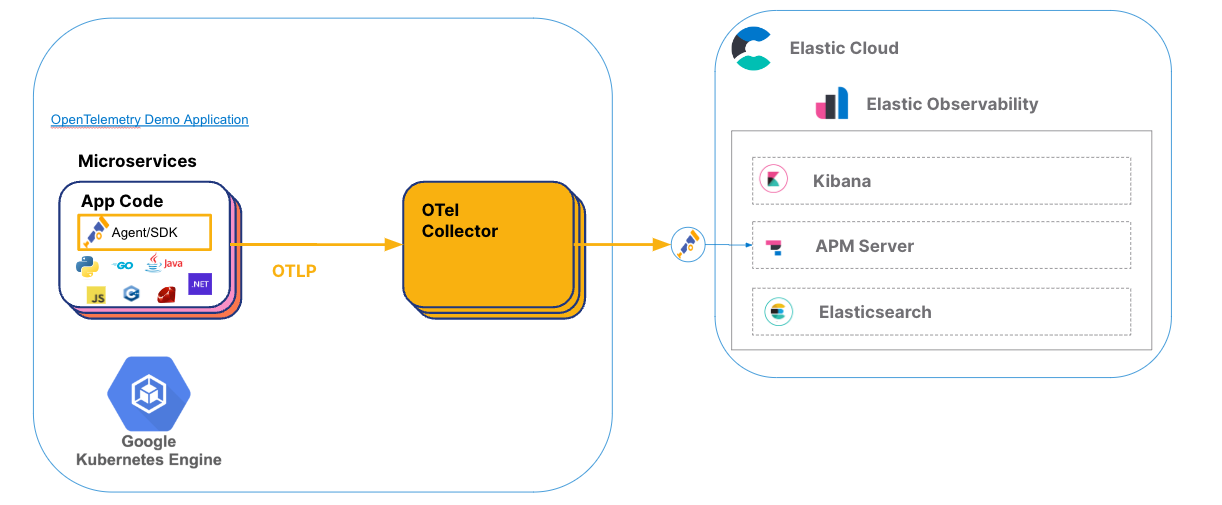
- Location of our clusters. While we used Google Kubernetes Engine (GKE), you can use any Kubernetes platform of your choice.
- While Elastic can ingest telemetry directly from OTel instrumented services, we will focus on the more traditional deployment, which uses the OpenTelemetry Collector.
- Prometheus and FluentD/Fluent Bit — traditionally used to pull all Kubernetes data — is not being used here versus Kubernetes Agents. Follow-up blogs will showcase this.
Here is the configuration we will get set up in this blog:
Setting it all up
Over the next few steps, I’ll walk through an Opentelemetry visualization:
- Getting an account on Elastic Cloud
- Bringing up a GKE cluster
- Bringing up the application
- Configuring Kubernetes OTel Collector configmap to point to Elastic Cloud
- Using Elastic Observability APM with OTel data for improved visibility
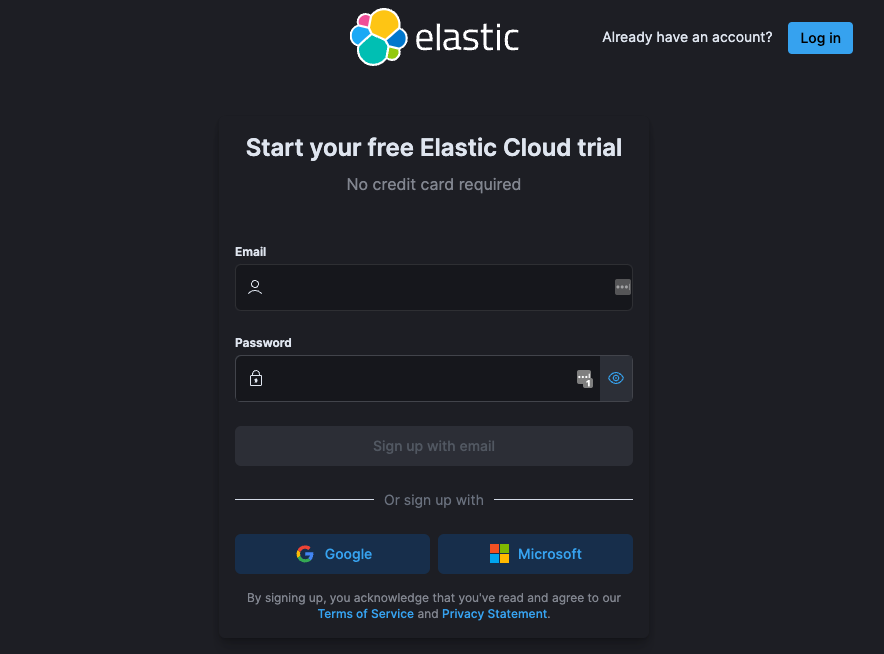
Step 0: Create an account on Elastic Cloud
Follow the instructions to get started on Elastic Cloud.
Step 1: Bring up a K8S cluster
We used Google Kubernetes Engine (GKE), but you can use any Kubernetes platform of your choice.
There are no special requirements for Elastic to collect OpenTelemetry data from a Kubernetes cluster. Any normal Kubernetes cluster on GKE, EKS, AKS, or Kubernetes compliant cluster (self-deployed and managed) works.
Step 2: Load the OpenTelemetry demo application on the cluster
Get your application on a Kubernetes cluster in your cloud service of choice or local Kubernetes platform. The application I am using is available here.
First clone the directory locally:
git clone https://github.com/elastic/opentelemetry-demo.git(Make sure you have kubectl and helm also installed locally.)
The instructions utilize a specific opentelemetry-collector configuration for Elastic. Essentially, the Elastic values.yaml file specified in the elastic/opentelemetry-demo configure the opentelemetry-collector to point to the Elastic APM Server using two main values:
OTEL_EXPORTER_OTLP_ENDPOINT is Elastic’s APM Server
OTEL_EXPORTER_OTLP_HEADERS Elastic Authorization
These two values can be found in the OpenTelemetry setup instructions under the APM integration instructions (Integrations->APM) in your Elastic cloud.
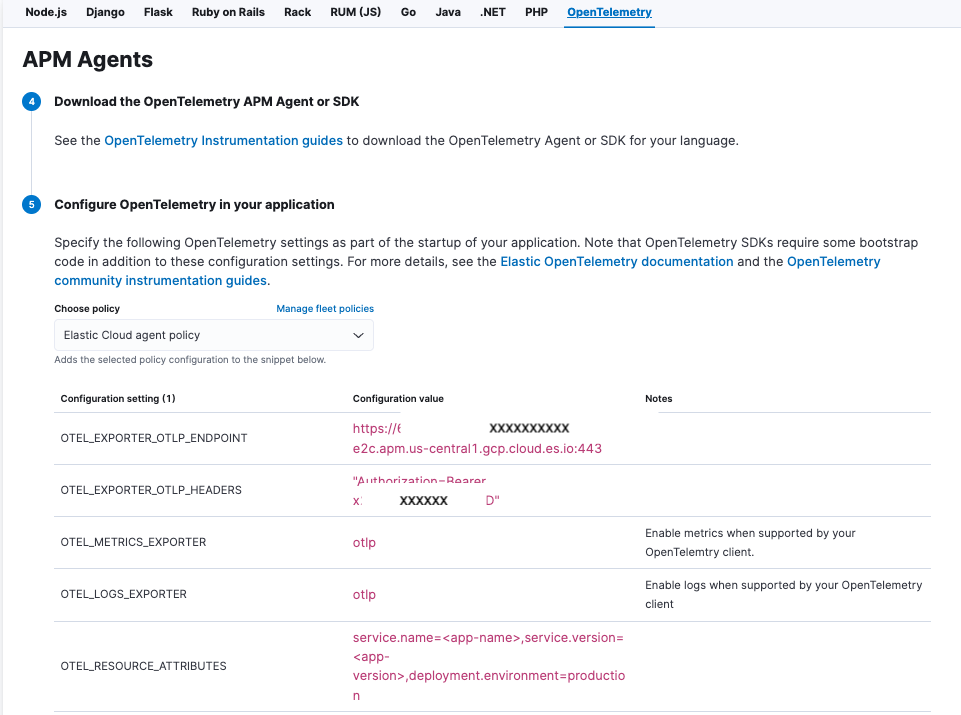
Once you obtain this, the first step is to create a secret key on the cluster with your Elastic APM server endpoint, and your APM Secret Token with the following instruction:
kubectl create secret generic elastic-secret \
  --from-literal=elastic_apm_endpoint='YOUR_APM_ENDPOINT_WITHOUT_HTTPS_PREFIX' \
--from-literal=elastic_apm_secret_token='YOUR_APM_SECRET_TOKEN'Don't forget to replace:
- YOUR_APM_ENDPOINT_WITHOUT_HTTPS_PREFIX: your Elastic APM endpoint (without https:// prefix) with OTEL_EXPORTER_OTLP_ENDPOINT
- YOUR_APM_SECRET_TOKEN: your Elastic APM secret token OTEL_EXPORTER_OTLP_HEADERS
Now execute the following commands:
# switch to the kubernetes/elastic-helm directory
cd kubernetes/elastic-helm

# add the open-telemetry Helm repostiroy
helm repo add open-telemetry https://open-telemetry.github.io/opentelemetry-helm-charts

# deploy the demo through helm install
helm install -f values.yaml my-otel-demo open-telemetry/opentelemetry-demoOnce your application is up on Kubernetes, you will have the following pods (or some variant) running on the default namespace.
kubectl get pods -n defaultOutput should be similar to the following:
NAME                                                  READY   STATUS    RESTARTS      AGE
my-otel-demo-accountingservice-5c77754b4f-vwph6       1/1     Running   0             5d4h
my-otel-demo-adservice-6b8b7c7dc5-mb7j5               1/1     Running   0             5d4h
my-otel-demo-cartservice-76d94b7dcd-2g4lf             1/1     Running   0             5d4h
my-otel-demo-checkoutservice-988bbdb88-hmkrp          1/1     Running   0             5d4h
my-otel-demo-currencyservice-6cf4b5f9f6-vz9t2         1/1     Running   0             5d4h
my-otel-demo-emailservice-868c98fd4b-lpr7n            1/1     Running   6 (18h ago)   5d4h
my-otel-demo-featureflagservice-8446ff9c94-lzd4w      1/1     Running   0             5d4h
my-otel-demo-ffspostgres-867945d9cf-zzwd7             1/1     Running   0             5d4h
my-otel-demo-frauddetectionservice-5c97c589b9-z8fhz   1/1     Running   0             5d4h
my-otel-demo-frontend-d85ccf677-zg9fp                 1/1     Running   0             5d4h
my-otel-demo-frontendproxy-6c5c4fccf6-qmldp           1/1     Running   0             5d4h
my-otel-demo-kafka-68bcc66794-dsbr6                   1/1     Running   0             5d4h
my-otel-demo-loadgenerator-64c545b974-xfccq           1/1     Running   1 (36h ago)   5d4h
my-otel-demo-otelcol-fdfd9c7cf-6lr2w                  1/1     Running   0             5d4h
my-otel-demo-paymentservice-7955c68859-ff7zg          1/1     Running   0             5d4h
my-otel-demo-productcatalogservice-67c879657b-wn2wj   1/1     Running   0             5d4h
my-otel-demo-quoteservice-748d754ffc-qcwm4            1/1     Running   0             5d4h
my-otel-demo-recommendationservice-df78894c7-lwm5v    1/1     Running   0             5d4h
my-otel-demo-redis-7d48567546-h4p4t                   1/1     Running   0             5d4h
my-otel-demo-shippingservice-f6fc76ddd-2v7qv          1/1     Running   0             5d4h
Step 3: Open Kibana and use the APM Service Map to view your OTel instrumented Services
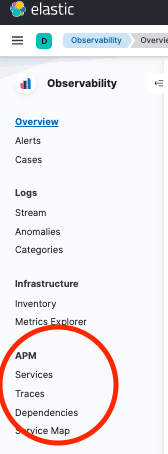
In the Elastic Observability UI under APM, select servicemap to see your services.
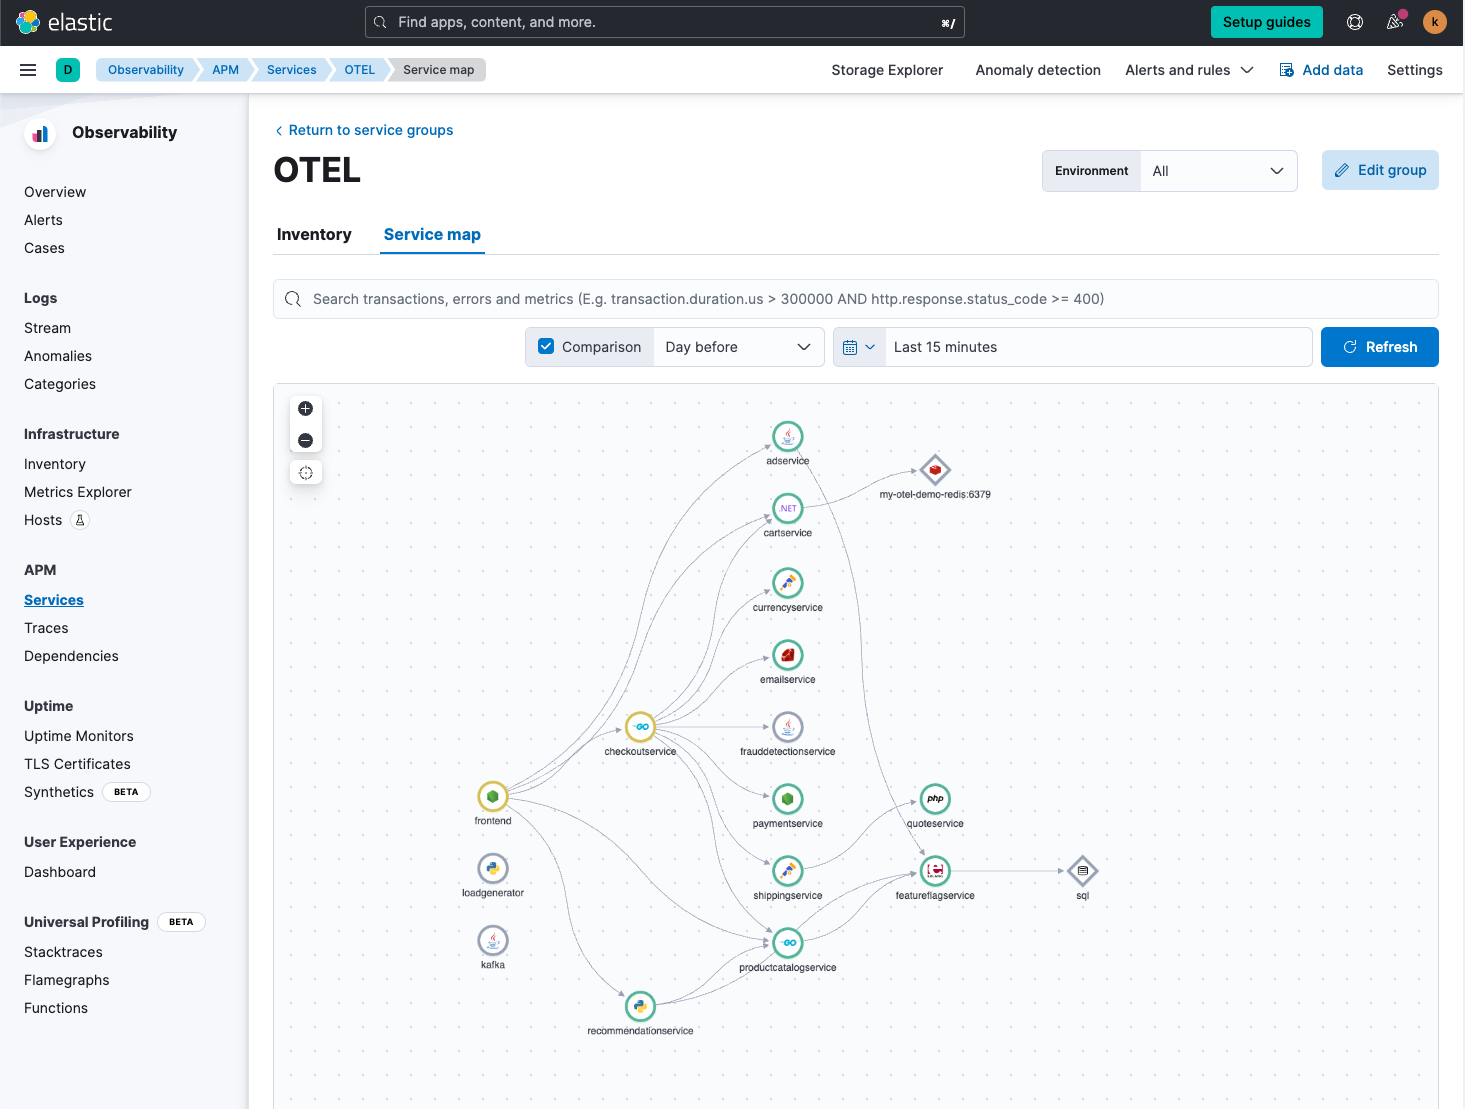
If you are seeing this, then the OpenTelemetry Collector is sending data into Elastic:
Congratulations, you've instrumented the OpenTelemetry demo application using and successfully ingested the telemetry data into the Elastic!
Step 4: What can Elastic show me?
Now that the OpenTelemetry data is ingested into Elastic, what can you do?
First, you can view the APM service map (as shown in the previous step) — this will give you a full view of all the services and the transaction flows between services.
Next, you can now check out individual services and the transactions being collected.
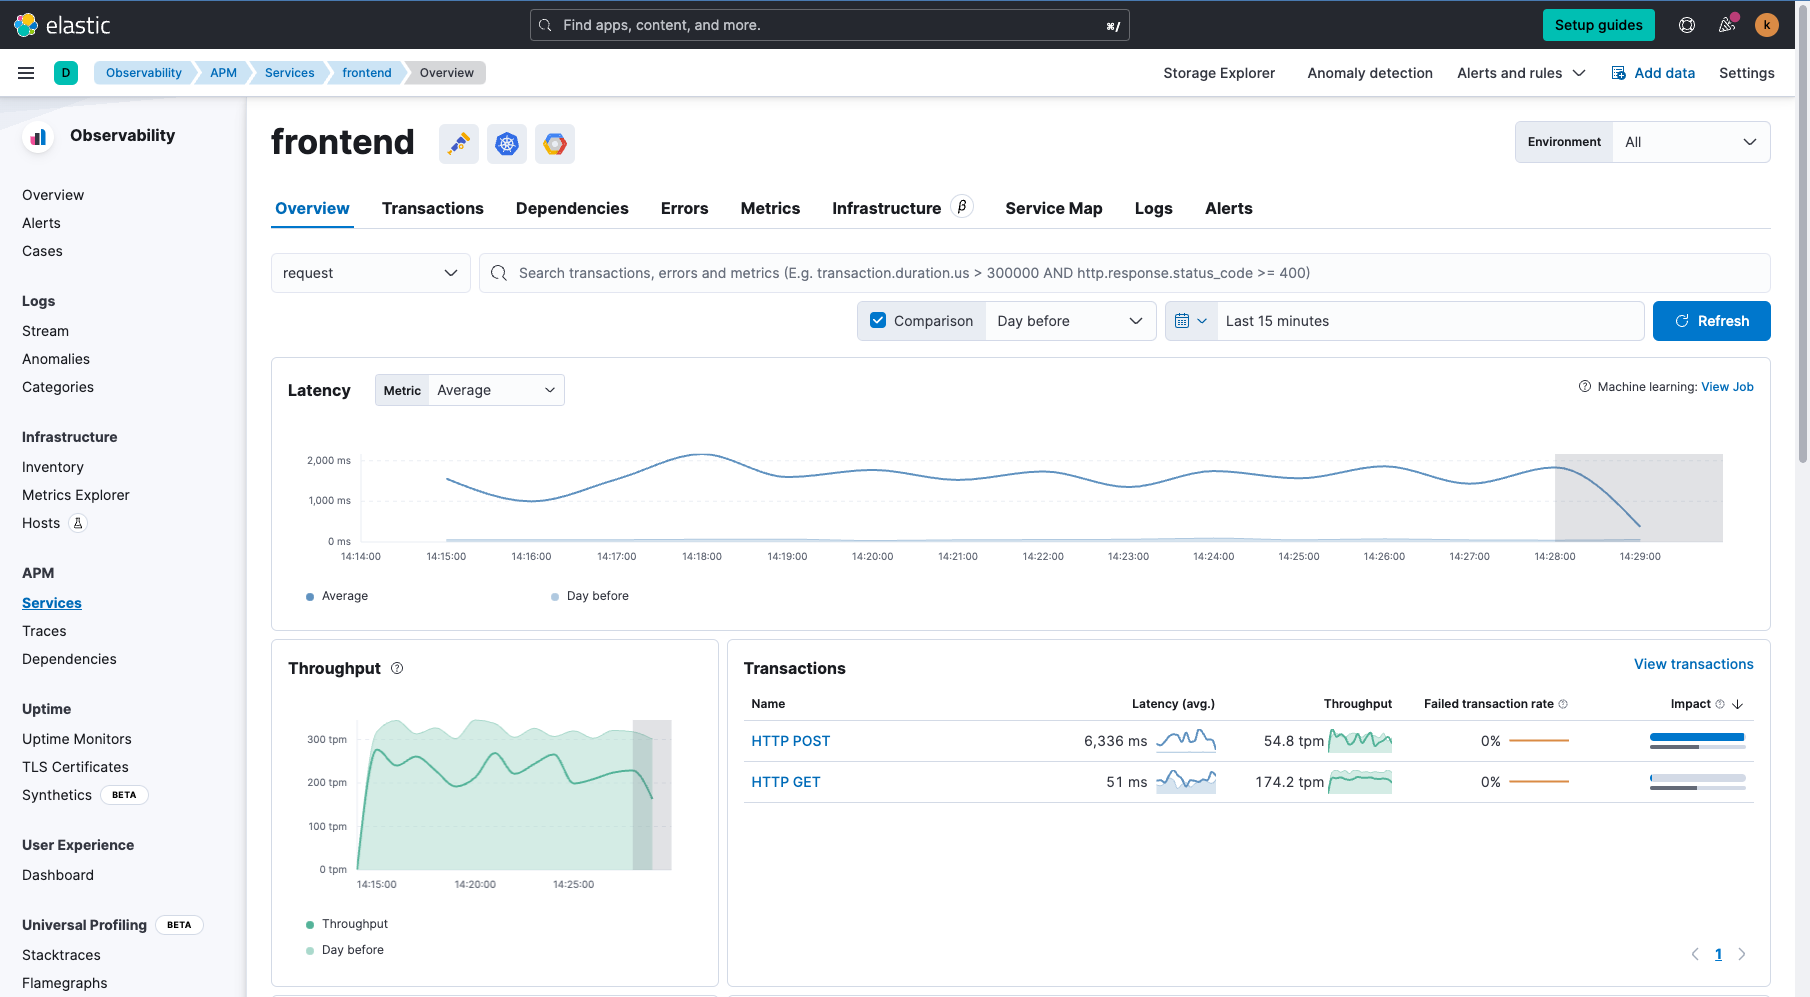
As you can see, the frontend details are listed. Everything from:
- Average service latency
- Throughput
- Main transactions
- Failed traction rate
- Errors
- Dependencies
Let’s get to the trace. In the Transactions tab, you can review all the types of transactions related to the frontend service:
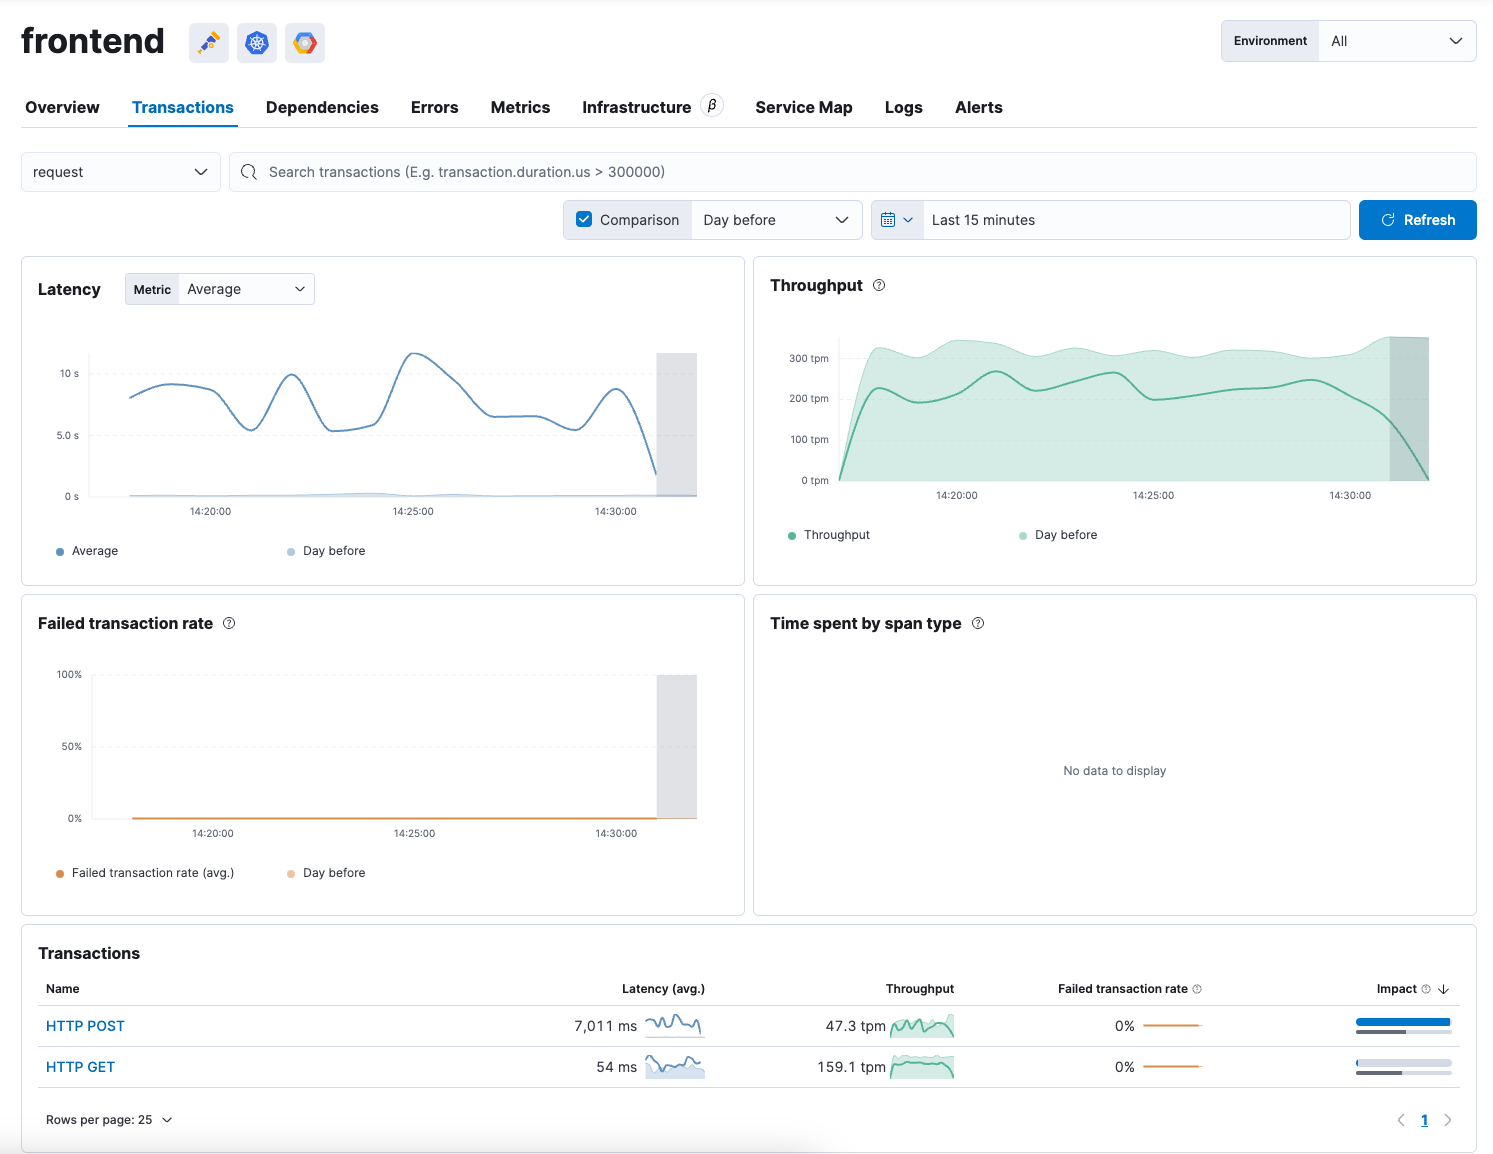
Selecting the HTTP POST transaction, we can see the full trace with all the spans:
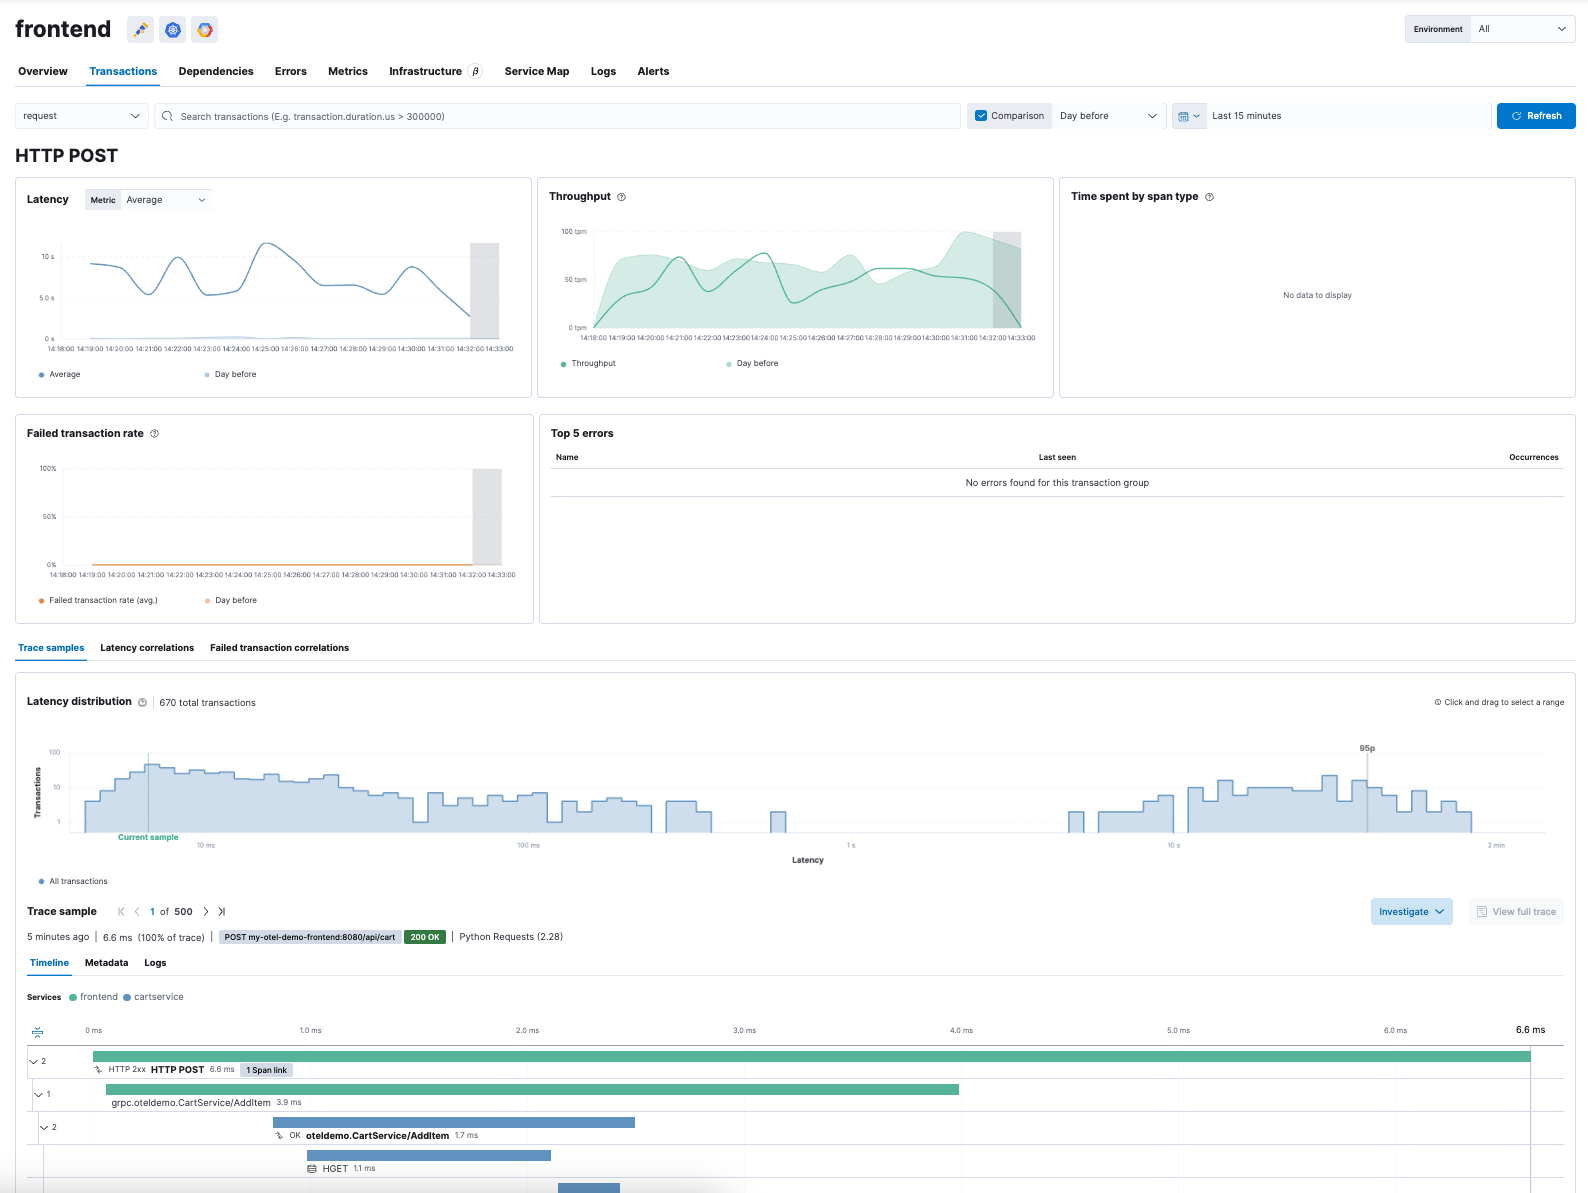
Not only can you review the trace but you can also analyze what is related to higher than normal latency for HTTP POST .
Elastic uses machine learning to help identify any potential latency issues across the services from the trace. It’s as simple as selecting the Latency Correlations tab and running the correlation.
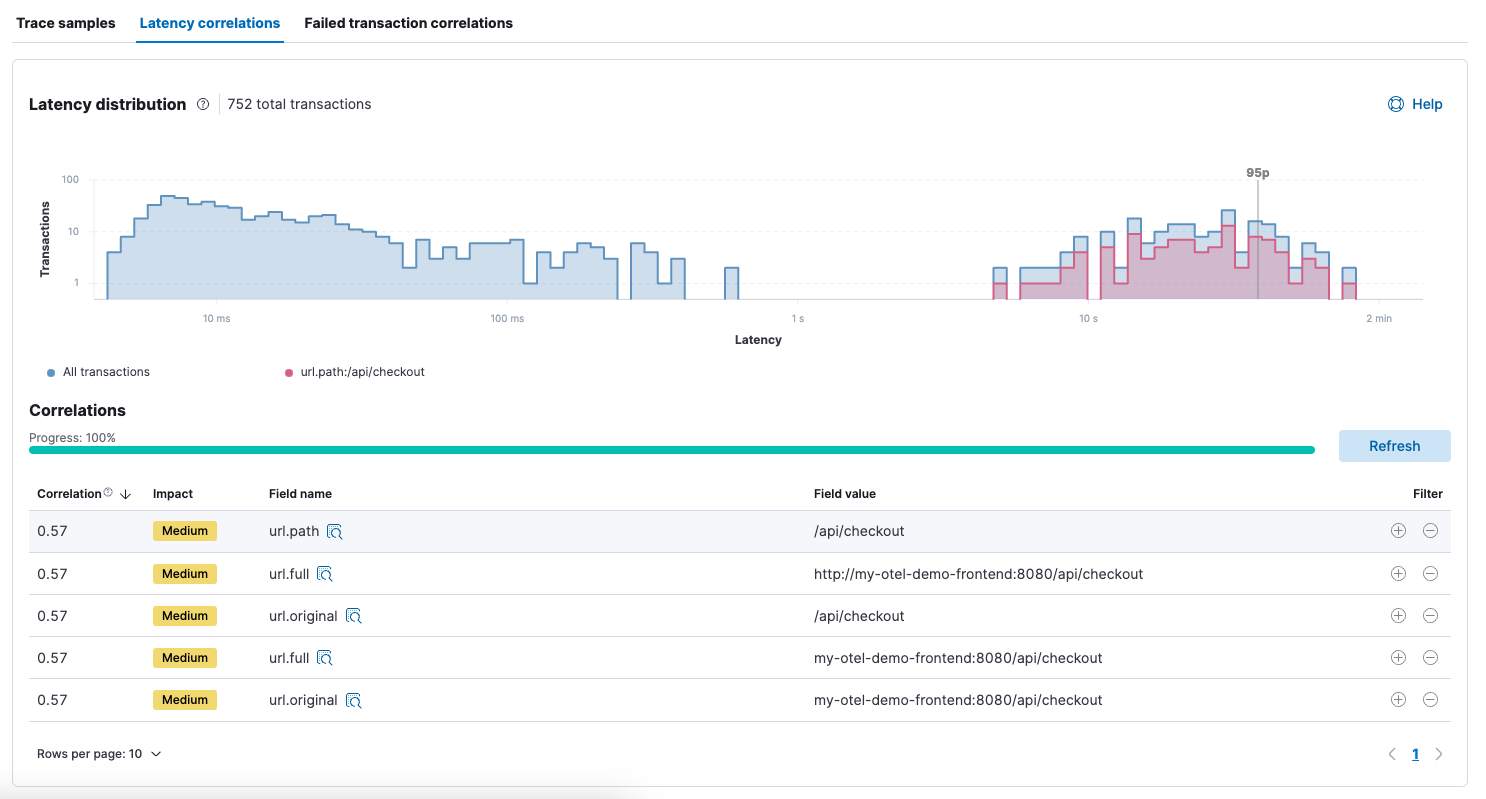
This shows that the high latency transactions are occurring in checkout service with a medium correlation.
You can then drill down into logs directly from the trace view and review the logs associated with the trace to help identify and pinpoint potential issues.
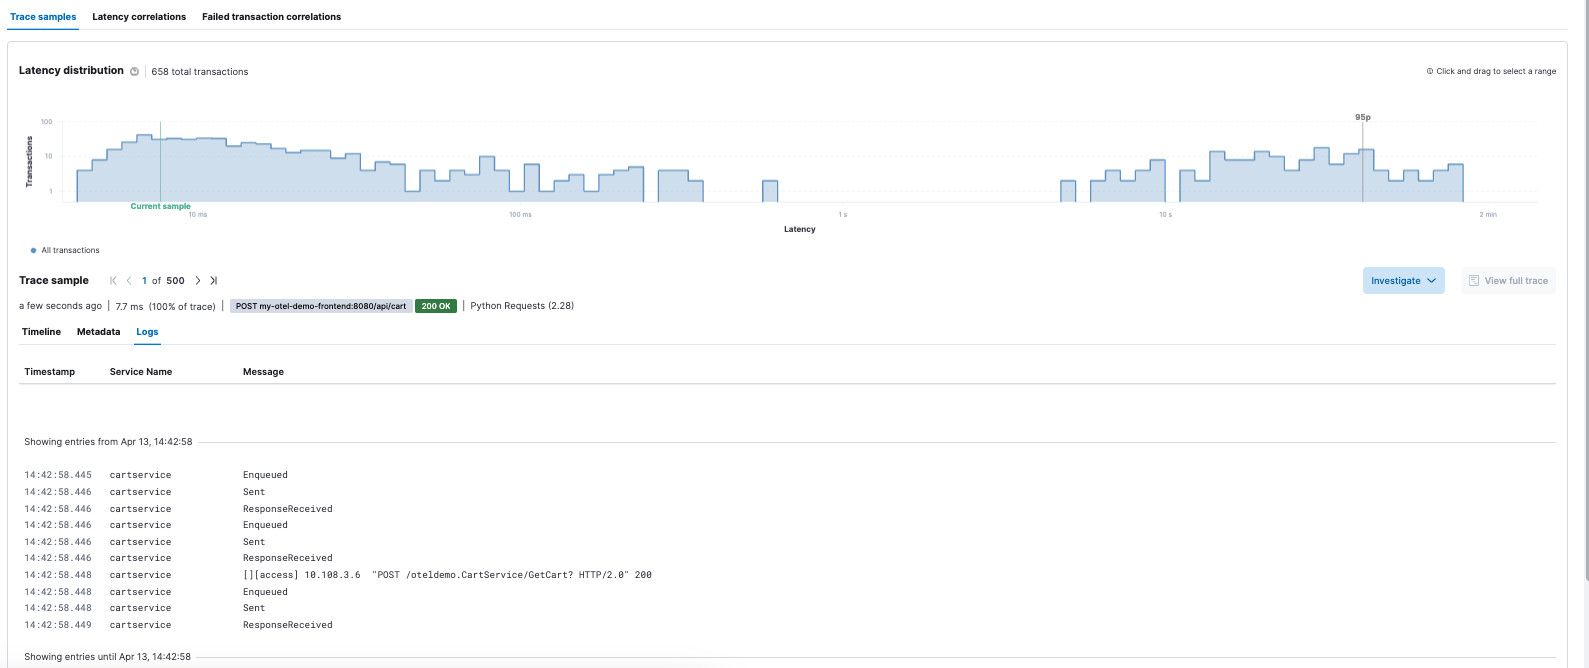
Analyze your data with Elastic machine learning (ML)
Once OpenTelemetry metrics are in Elastic, start analyzing your data through Elastic’s ML capabilities.
A great review of these features can be found here: Correlating APM telemetry to determine root causes in transactions. And there are many more videos and blogs on Elastic’s Blog. We’ll follow up with additional blogs on leveraging Elastic’s machine learning capabilities for OpenTelemetry data.
Conclusion
I hope you’ve gotten an appreciation for how Elastic Observability can help you ingest and analyze OpenTelemetry data with Elastic’s APM capabilities.
A quick recap of lessons and more specifically learned:
- How to get a popular OTel instrumented demo app (Hipster Shop) configured to ingest into Elastic Cloud, through a few easy steps
- Highlight some of the Elastic APM capabilities and features around OTel data and what you can do with this once it’s in Elastic
Ready to get started? Sign up for Elastic Cloud and try out the features and capabilities I’ve outlined above to get the most value and visibility out of your OpenTelemetry data.

