Easily analyze AWS VPC Flow Logs with Elastic Observability

Elastic Observability provides a full-stack observability solution, by supporting metrics, traces, and logs for applications and infrastructure. In a previous blog, I showed you an AWS monitoring infrastructure running a three-tier application. Specifically we reviewed metrics ingest and analysis on Elastic Observability for EC2, VPC, ELB, and RDS. In this blog, we will cover how to ingest logs from AWS, and more specifically, we will review how to get VPC Flow Logs into Elastic and what you can do with this data.
Logging is an important part of observability, for which we generally think of metrics and/or tracing. However, the amount of logs an application or the underlying infrastructure output can be significantly daunting.
With Elastic Observability, there are three main mechanisms to ingest logs:
- The new Elastic Agent pulls metrics and logs from CloudWatch and S3 where logs are generally pushed from a service (for example, EC2, ELB, WAF, Route53, etc ). We reviewed Elastic agent metrics configuration for EC2, RDS (Aurora), ELB, and NAT metrics in this blog.
- Using Elastic’s Serverless Forwarder (runs on Lambda and available in AWS SAR) to send logs from Firehose, S3, CloudWatch, and other AWS services into Elastic.
- Beta feature (contact your Elastic account team): Using AWS Firehose to directly insert logs from AWS into Elastic — specifically if you are running the Elastic stack on AWS infrastructure.
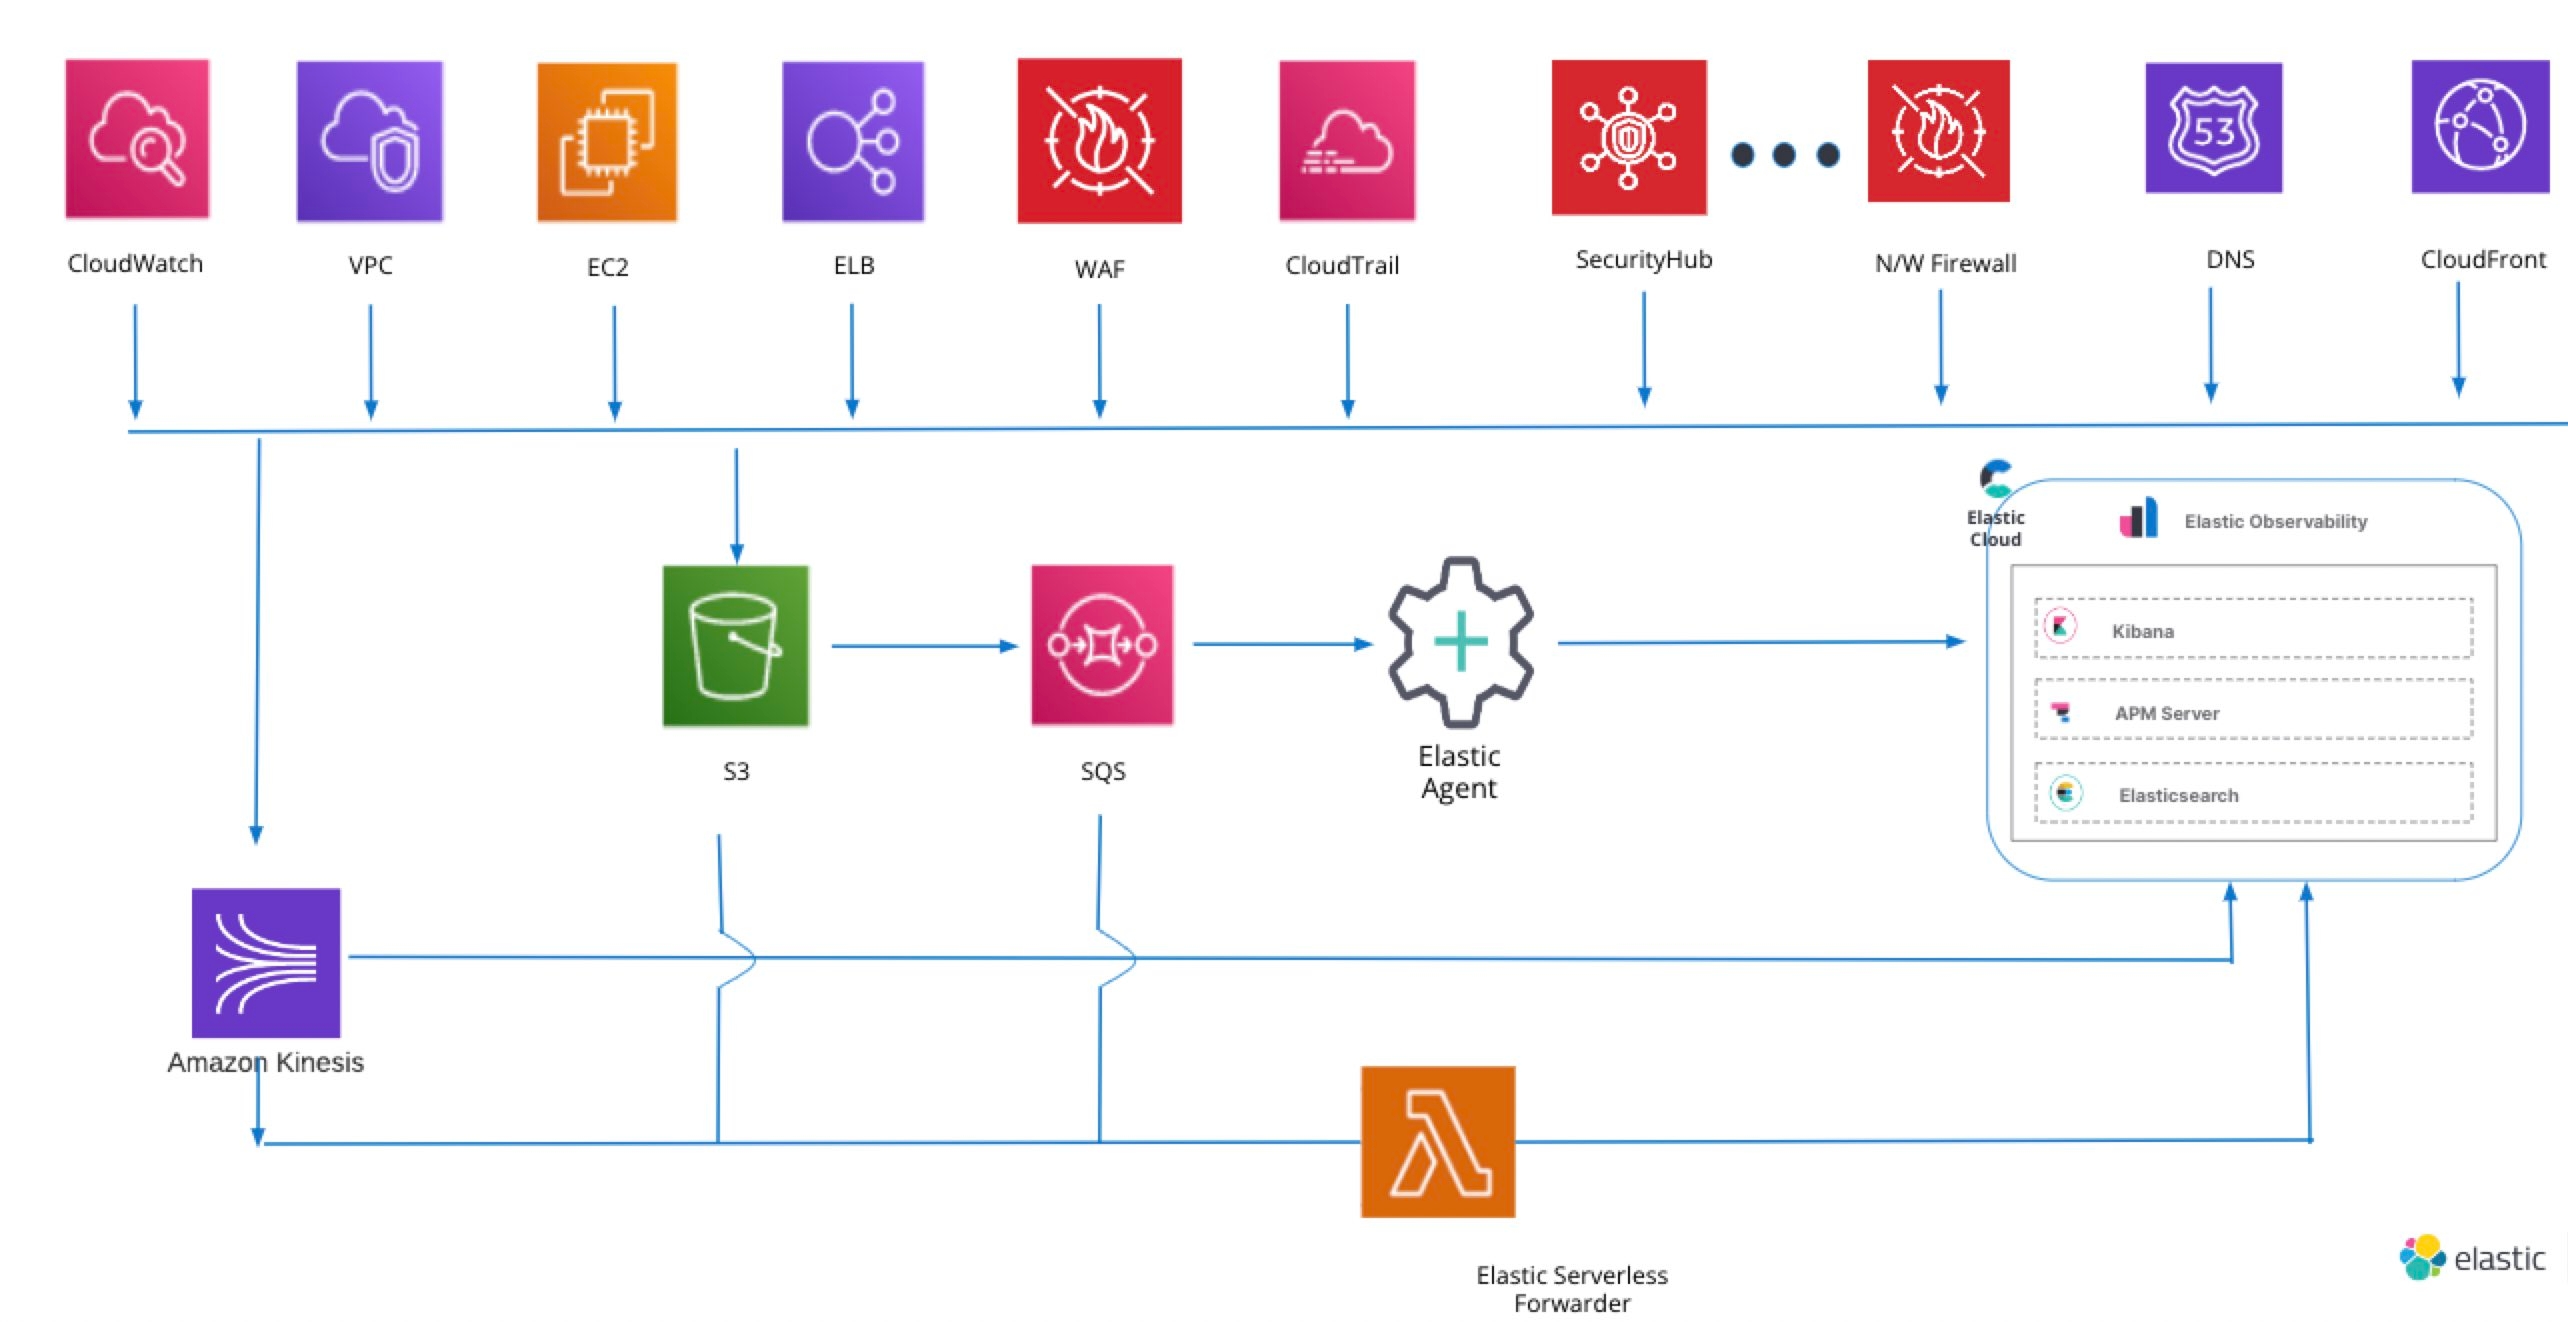
In this blog we will provide an overview of the second option, Elastic’s serverless forwarder collecting VPC Flow Logs from an application deployed on EC2 instances. Here’s what we'll cover:
- A walk-through on how to analyze VPC Flow Log info with Elastic’s Discover, dashboard, and ML analysis.
- A detailed step-by-step overview and setup of the Elastic serverless forwarder on AWS as a pipeline for VPC Flow Logs into Elastic Cloud.
Elastic’s serverless forwarder on AWS Lambda
AWS users can quickly ingest logs stored in Amazon S3, CloudWatch, or Kinesis with the Elastic serverless forwarder, an AWS Lambda application, and view them in the Elastic Stack alongside other logs and metrics for centralized analytics. Once the AWS serverless forwarder is configured and deployed from AWS, Serverless Application Registry (SAR) logs will be ingested and available in Elastic for analysis. See the following links for further configuration guidance:
- Elastic’s serverless forwarder (runs Lambda and available in AWS SAR)
- Serverless forwarder GitHub repo
In our configuration we will ingest VPC Flow Logs into Elastic for the three-tier app deployed in the previous blog.
There are three different configurations with the Elastic serverless forwarder:
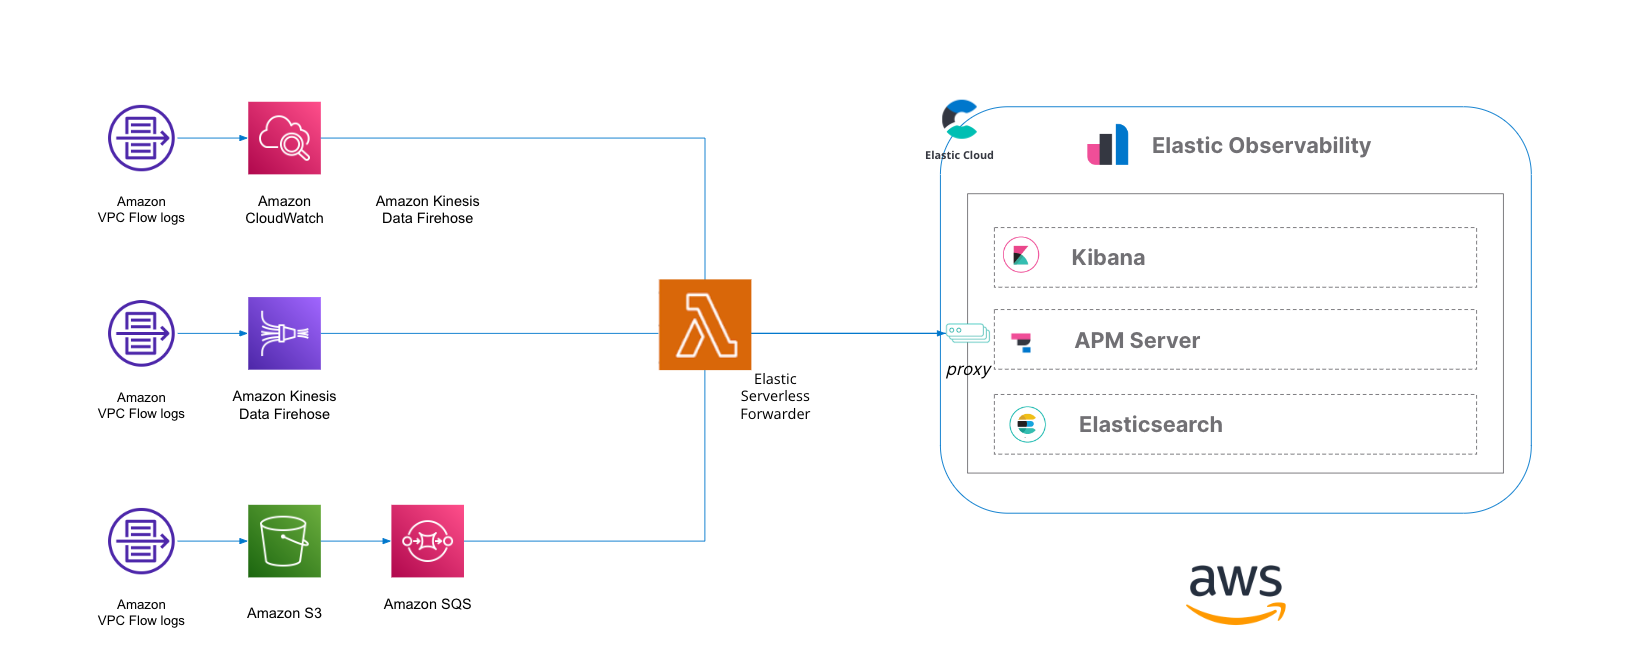
Logs can be directly ingested from:
- Amazon CloudWatch: Elastic serverless forwarder can pull VPC Flow Logs directly from an Amazon CloudWatch log group, which is a commonly used endpoint to store VPC Flow Logs in AWS.
- Amazon Kinesis: Elastic serverless forwarder can pull VPC Flow Logs directly from Kinesis, which is another location to publish VPC Flow Logs.
- Amazon S3: Elastic serverless forwarder can pull VPC Flow Logs from Amazon S3 via SQS event notifications, which is a common endpoint to publish VPC Flow Logs in AWS.
We will review how to utilize a common configuration, which is to send VPC Flow Logs to Amazon S3 and into Elastic Cloud in the second half of this blog.
But first let's review how to analyze VPC Flow Logs on Elastic.
Analyzing VPC Flow Logs in Elastic
Now that you have VPC Flow Logs in Elastic Cloud, how can you analyze them?
There are several analyses you can perform on the VPC Flow Log data:
- Use Elastic’s Analytics Discover capabilities to manually analyze the data.
- Use Elastic Observability’s anomaly feature to identify anomalies in the logs.
- Use an out-of-the-box (OOTB) dashboard to further analyze data.
Using Elastic Discover
In Elastic analytics, you can search and filter your data, get information about the structure of the fields, and display your findings in a visualization. You can also customize and save your searches and place them on a dashboard. With Discover, you can:
- View logs in bulk, within specific time frames
- Look at individual details of each entry (document)
- Filter for specific values
- Analyze fields
- Create and save searches
- Build visualizations
For a complete understanding of Discover and all of Elastic’s analytics capabilities, look at Elastic documentation.
For VPC Flow Logs, an important stat is to understand:
- How many logs were accepted/rejected
- Where potential security violations are occur (for example, source IPs from outside the VPC)
- What port is generally being queried
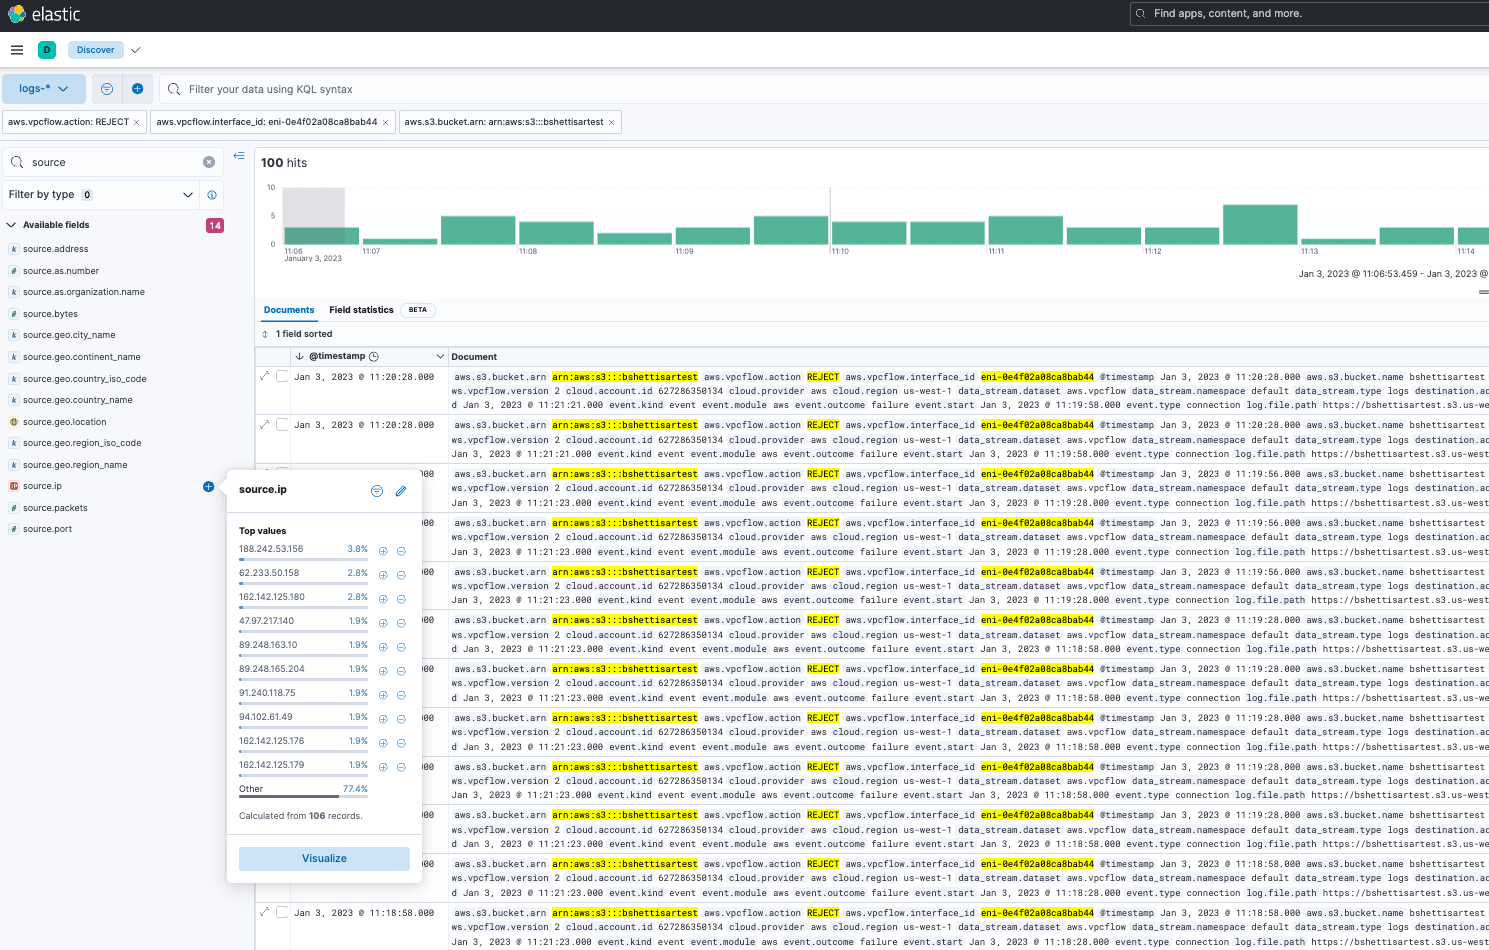
I’ve filtered the logs on the following:
- Amazon S3: bshettisartest
- VPC Flow Log action: REJECT
- VPC Network Interface: Webserver 1
We want to see what IP addresses are trying to hit our web servers.
From that, we want to understand which IP addresses we are getting the most REJECTS from, and we simply find the source.ip field. Then, we can quickly get a breakdown that shows 185.242.53.156 is the most rejected for the last 3+ hours we’ve turned on VPC Flow Logs.
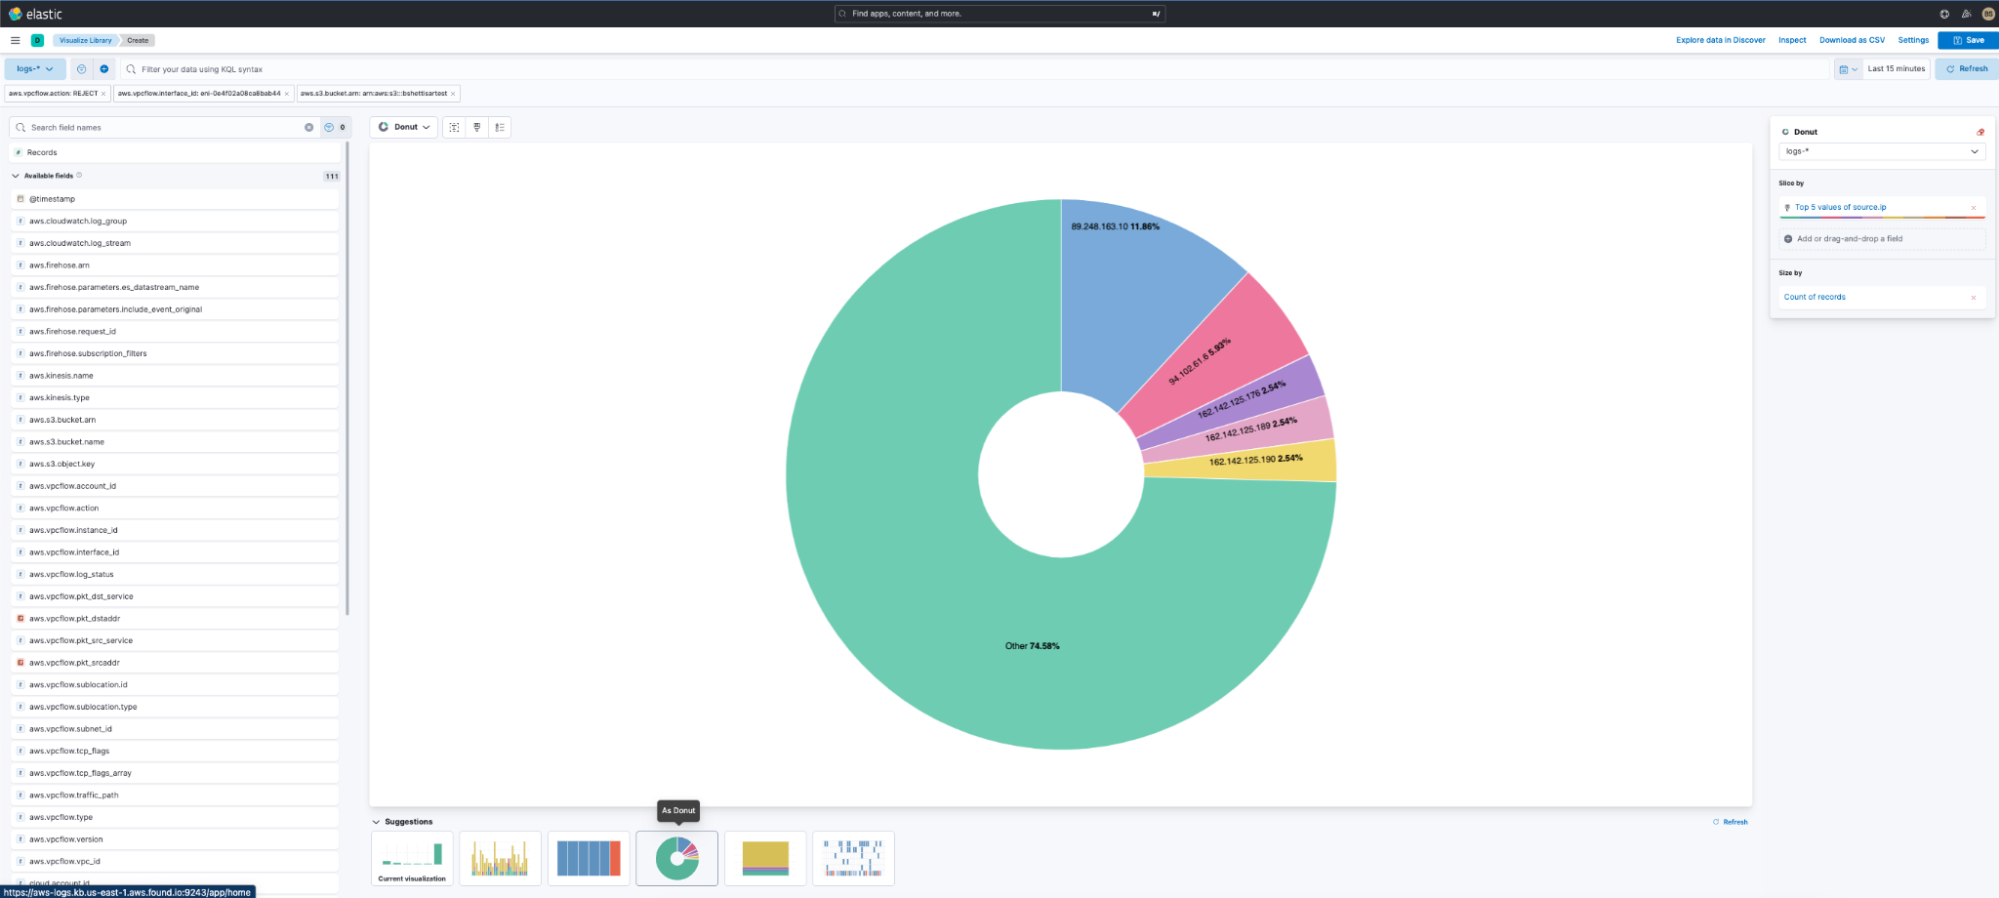
Additionally, I can see a visualization by selecting the “Visualize” button. We get the following, which we can add to a dashboard:
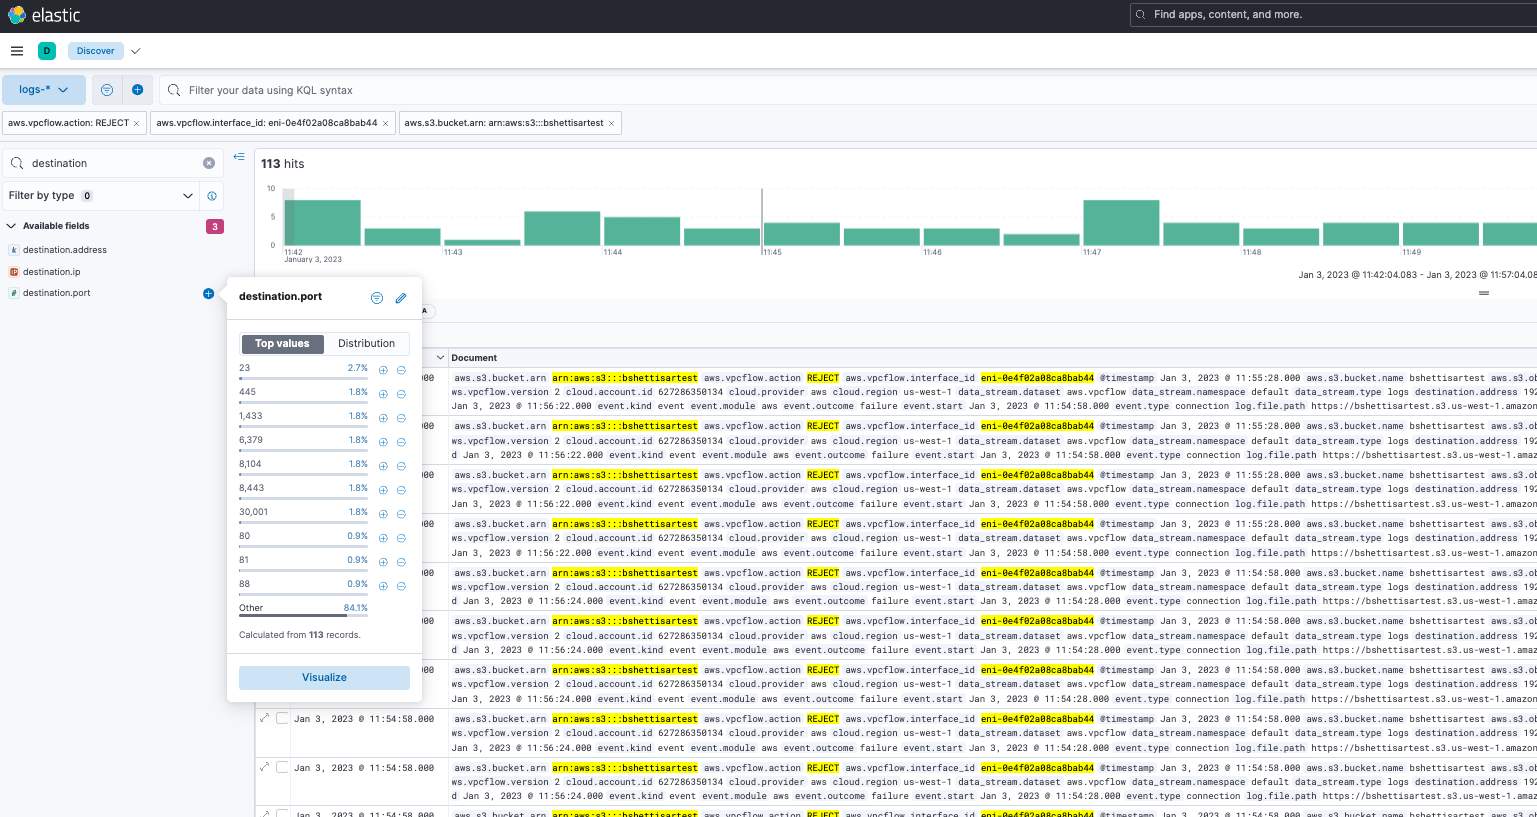
In addition to IP addresses, we want to also see what port is being hit on our web servers.
We select the destination port field, and the quick pop-up shows us a list of ports being targeted. We can see that port 23 is being targeted (this port is generally used for telnet), port 445 is being targeted (used for Microsoft Active Directory), and port 433 (used for https ssl). We also see these are all REJECT.
Anomaly detection in Elastic Observability logs
Addition to Discover, Elastic Observability provides the ability to detect anomalies on logs. In Elastic Observability -> logs -> anomalies you can turn on machine learning for:
- Log rate: automatically detects anomalous log entry rates
- Categorization: automatically categorizes log messages
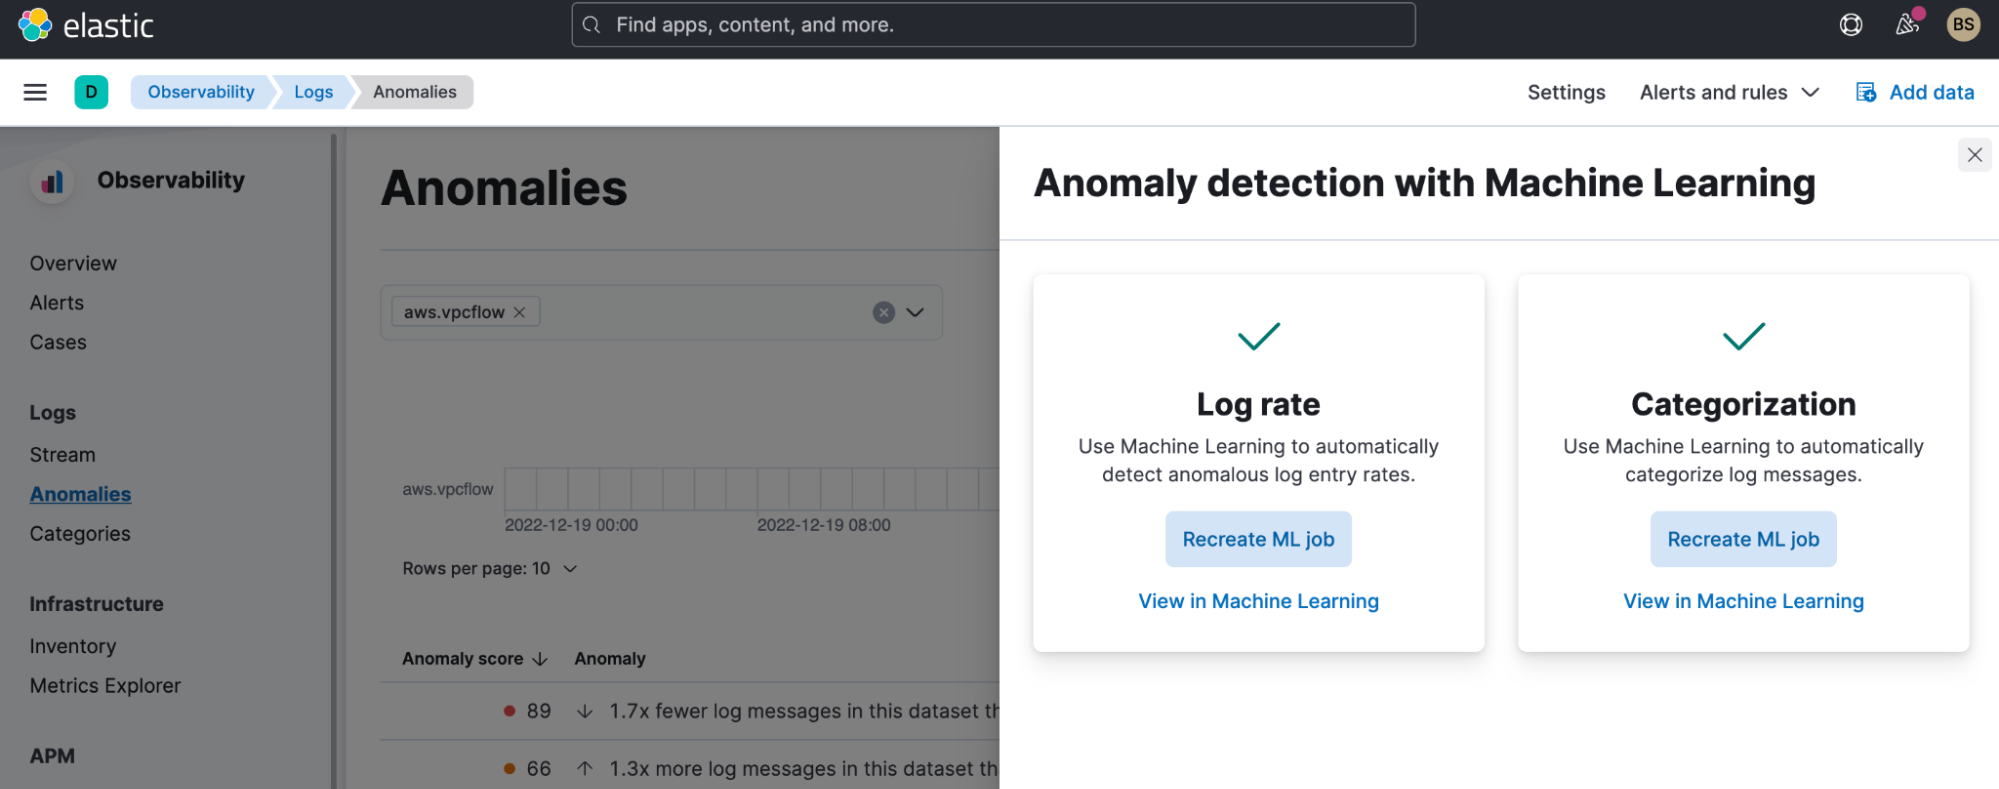
For our VPC Flow Log, we turned both on. And when we look at what has been detected for anomalous log entry rates, we see:
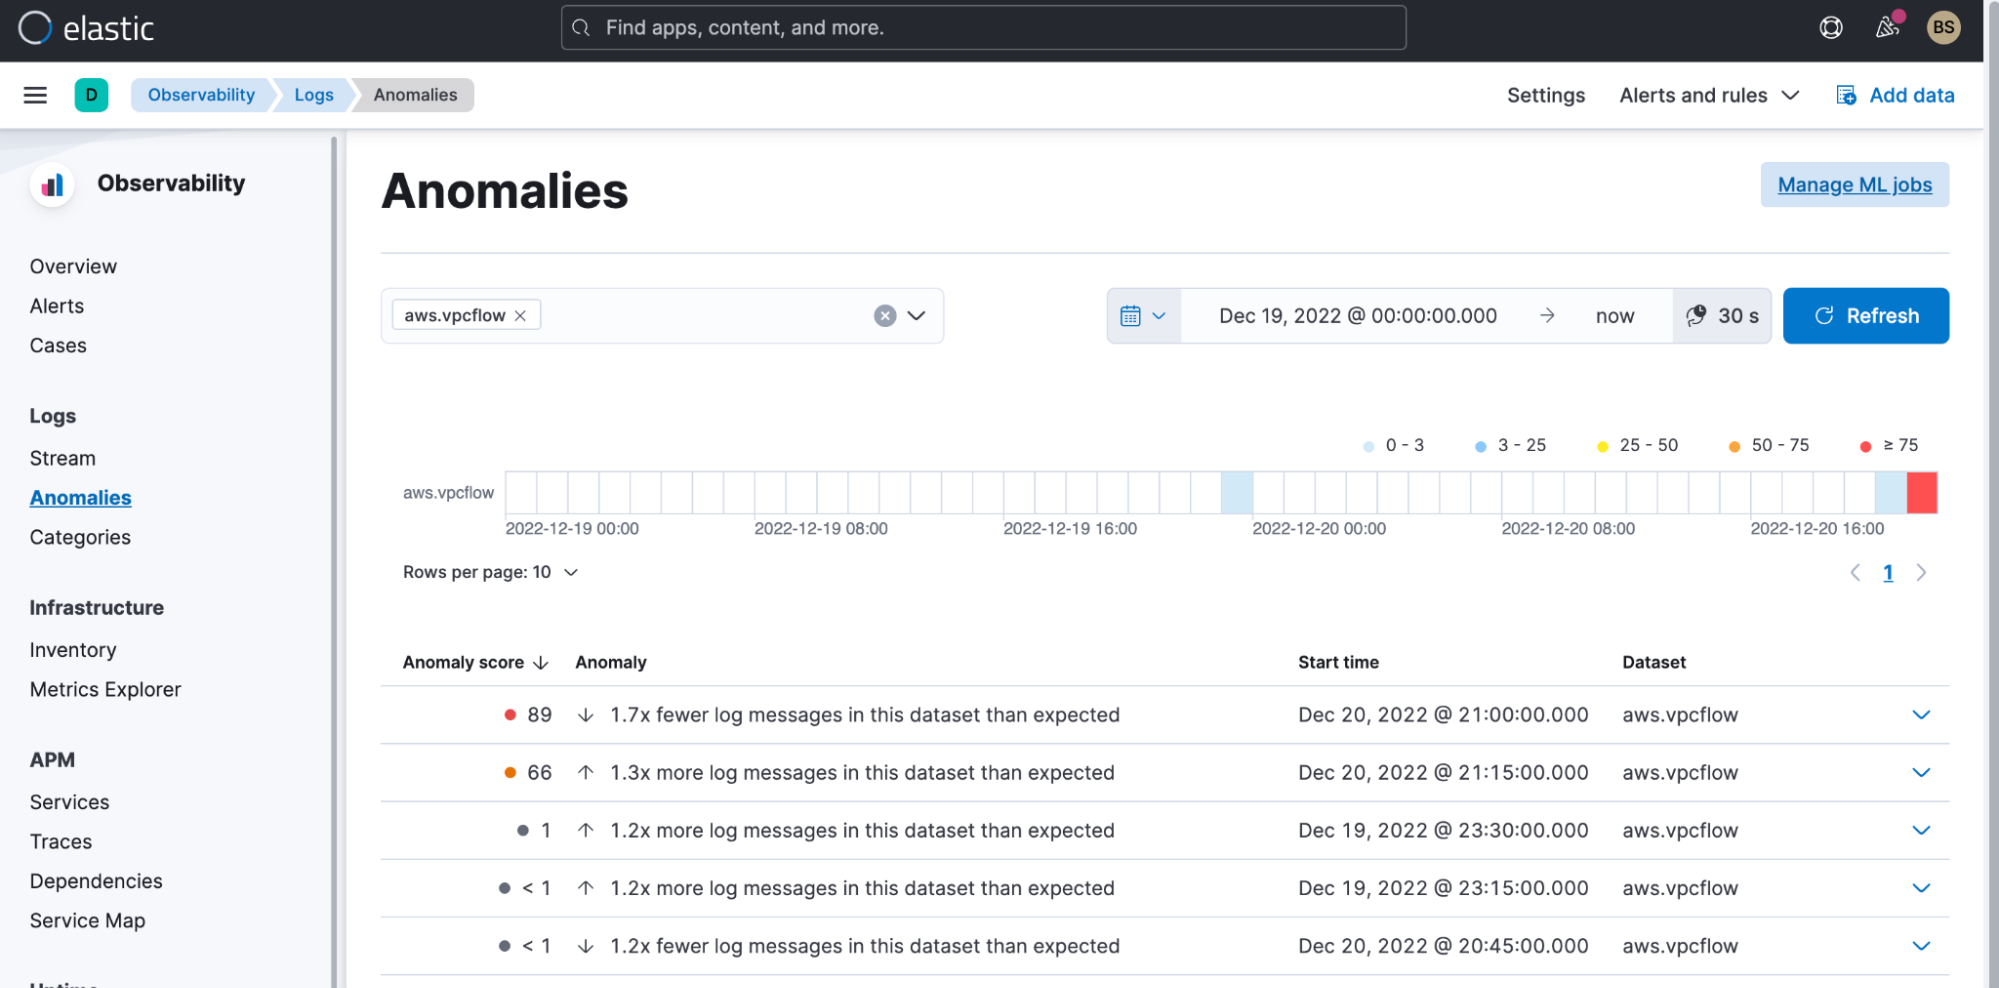
Elastic immediately detected a spike in logs when we turned on VPC Flow Logs for our application. The rate change is being detected because we’re also ingesting VPC Flow Logs from another application for a couple of days prior to adding the application in this blog.
We can further drill down into this anomaly with machine learning and analyze further.
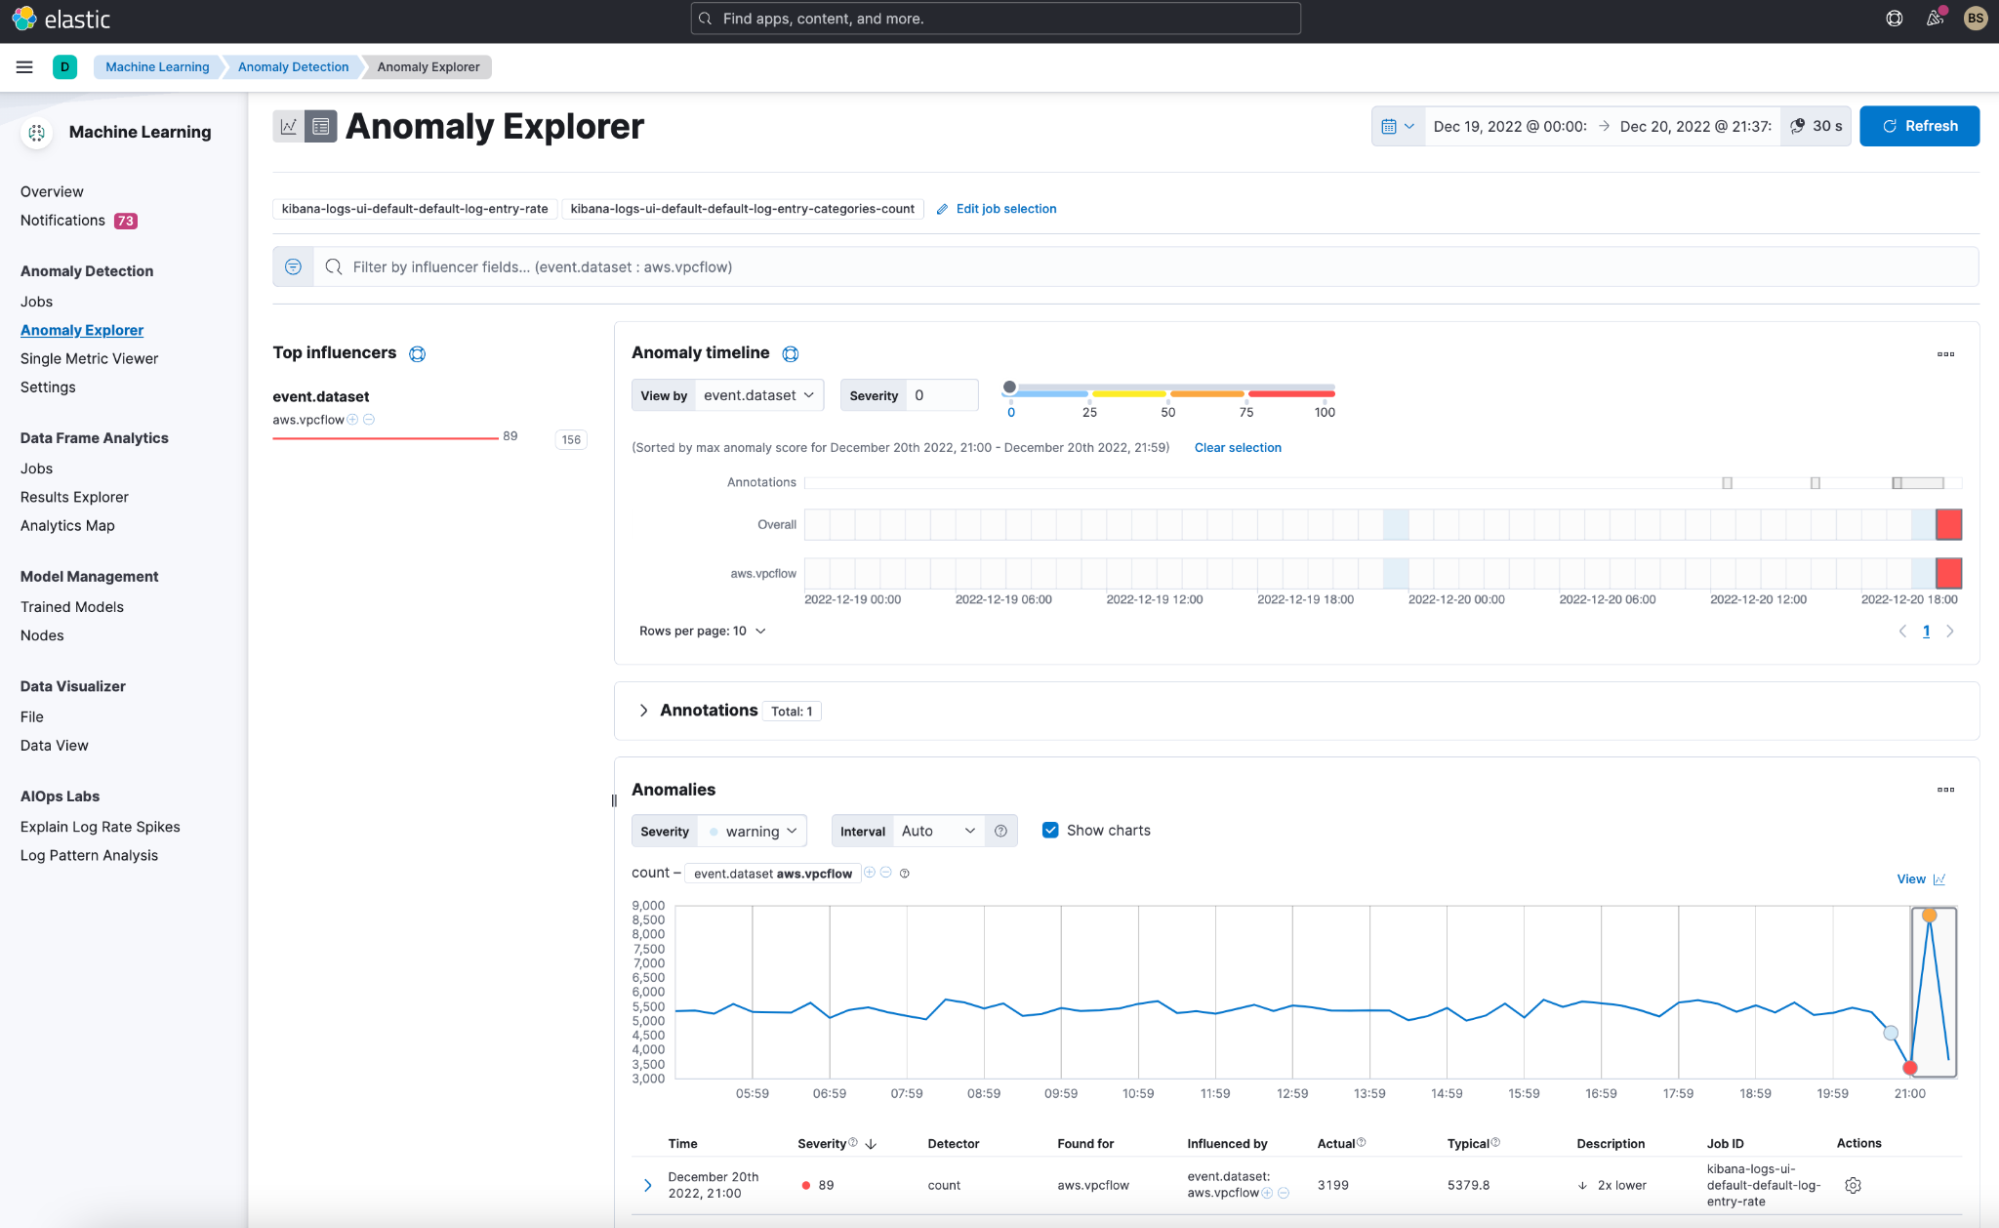
There is more machine learning analysis you can utilize with your logs — check out Elastic machine learning documentation.
Since we know that a spike exists, we can also use Elastic AIOps Labs Explain Log Rate Spikes capability in Machine Learning. Additionally, we’ve grouped them to see what is causing some of the spikes.
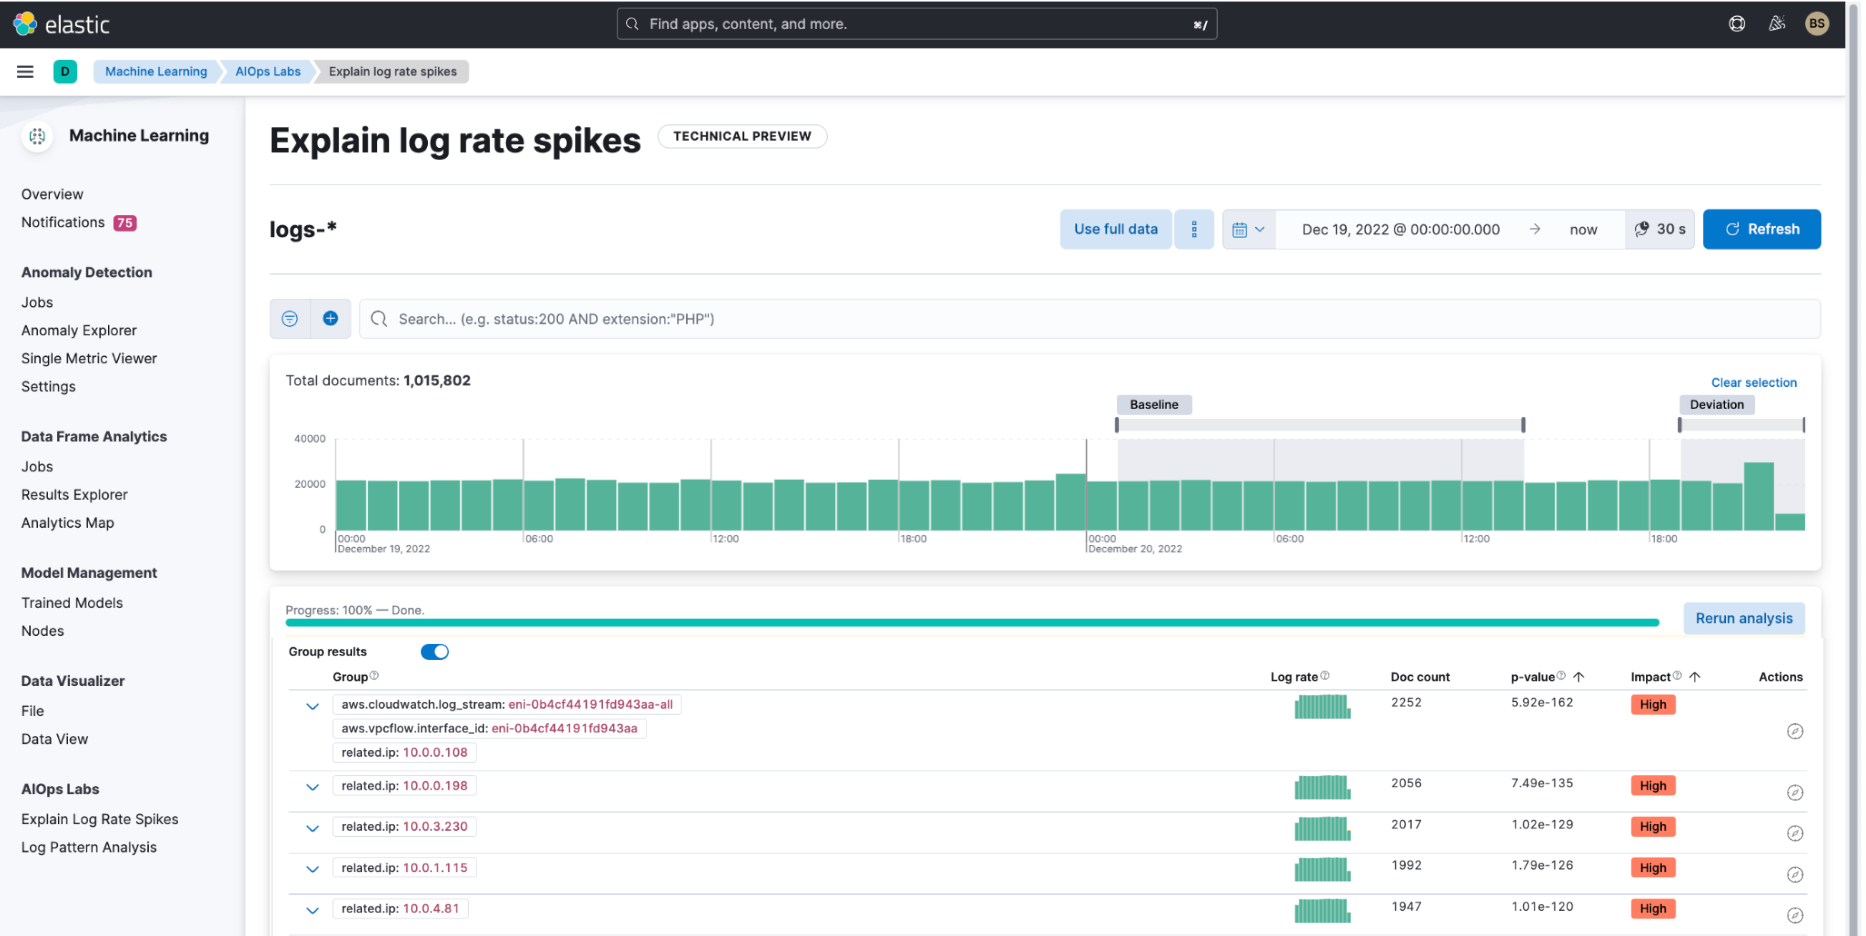
As we can see, a specific network interface is sending more VPC log flows than others. We can further drill down into this further in Discover.
VPC Flow Log dashboard on Elastic Observability
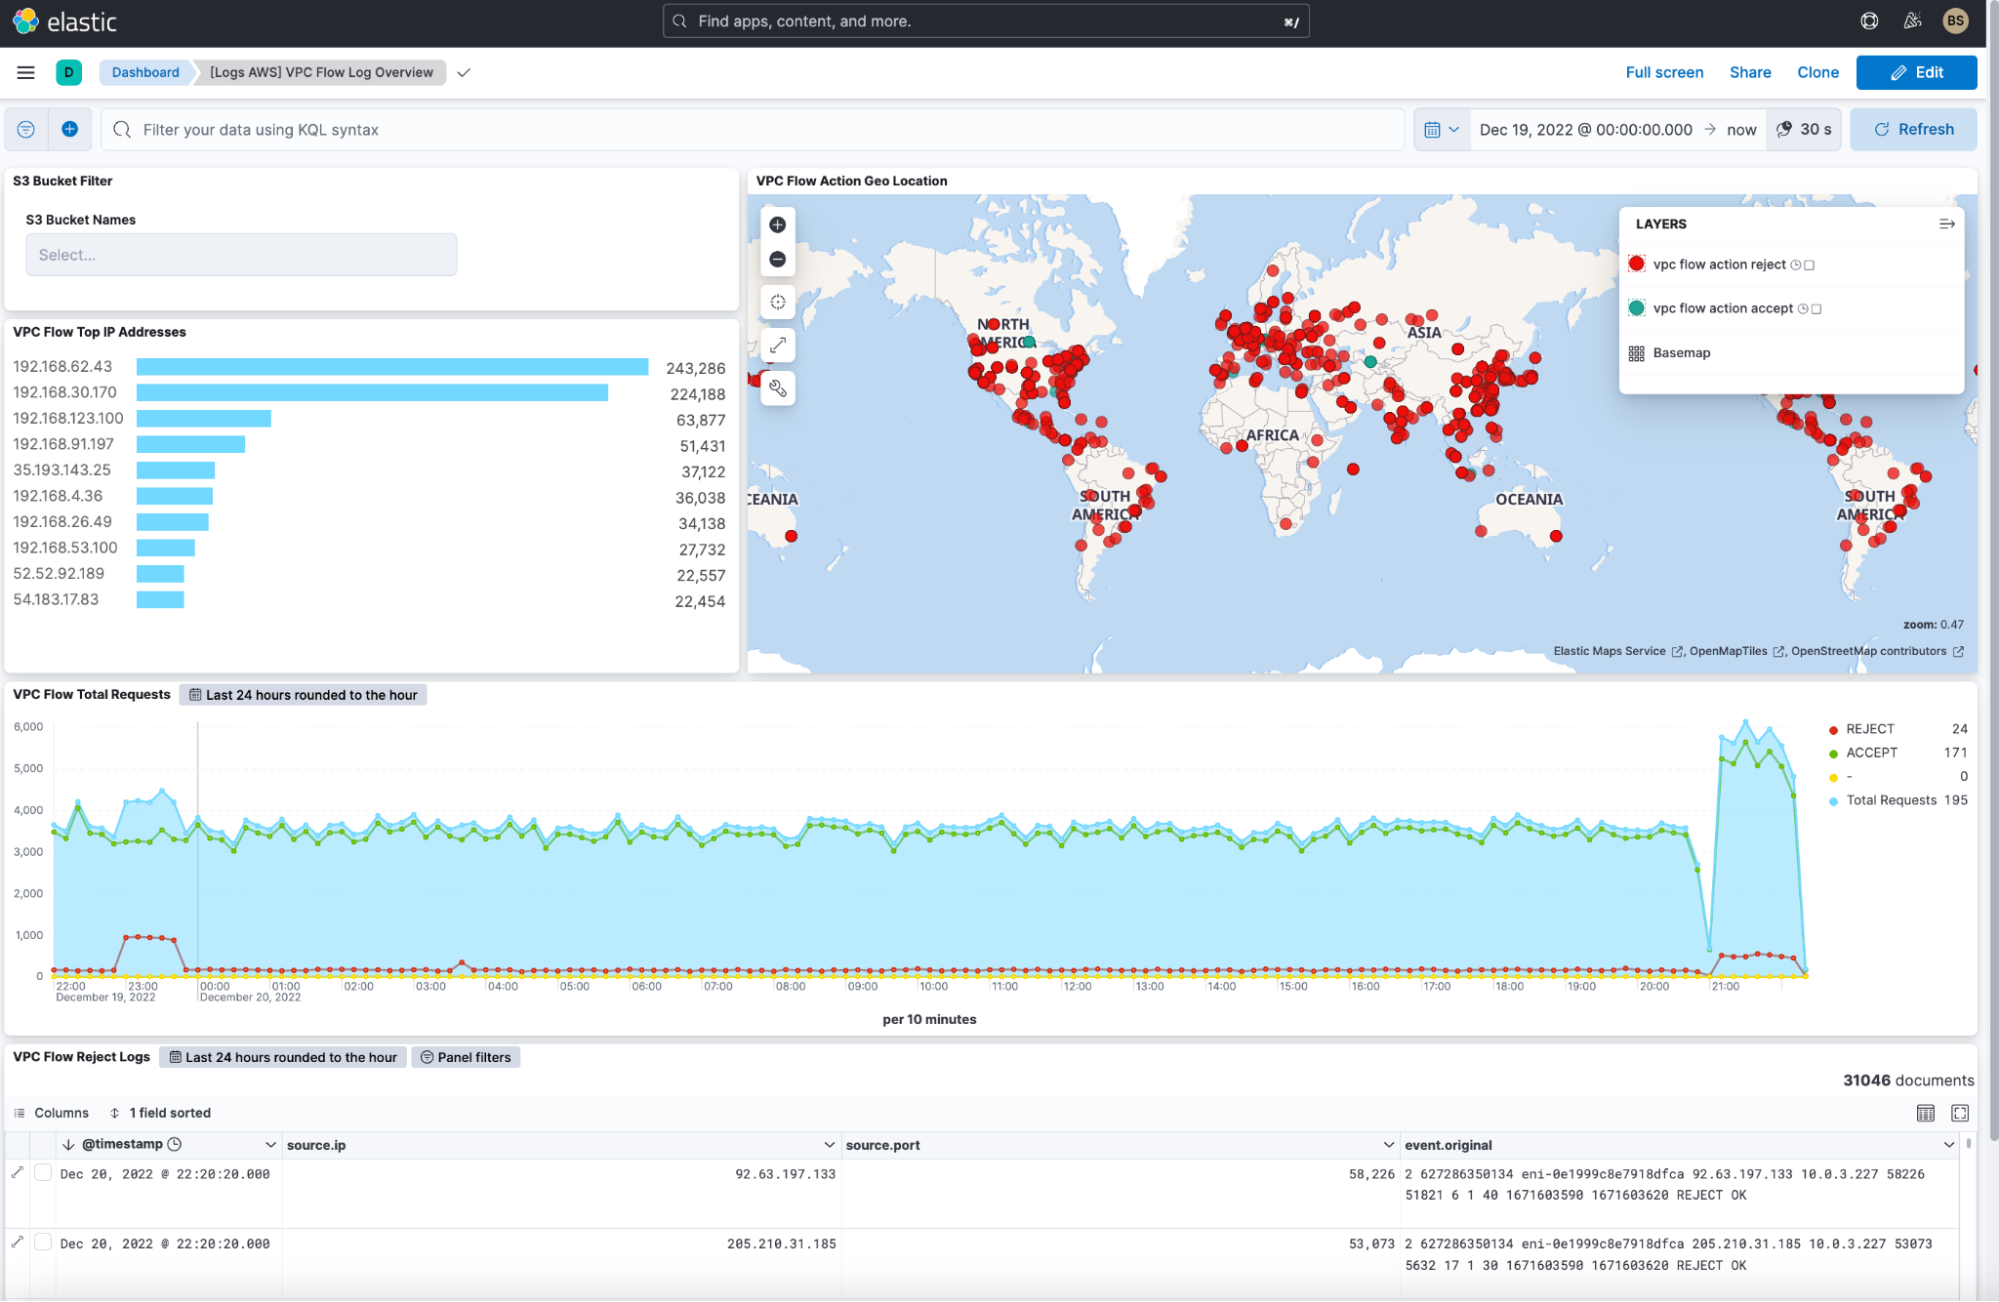
Finally, Elastic also provides an OOTB dashboard to showing the top IP addresses hitting your VPC, geographically where they are coming from, the time series of the flows, and a summary of VPC Flow Log rejects within the time frame.
This is a baseline dashboard that can be enhanced with visualizations you find in Discover, as we reviewed in option 1 (Using Elastic’s Analytics Discover capabilities) above.
Setting it all up
Let’s walk through the details of configuring Amazon Kinesis Data Firehose and Elastic Observability to ingest data.
Prerequisites and config
If you plan on following steps, here are some of the components and details we used to set up this demonstration:
- Ensure you have an account on Elastic Cloud and a deployed stack (see instructions here) on AWS. Deploying this on AWS is required for Elastic Serverless Forwarder.
- Ensure you have an AWS account with permissions to pull the necessary data from AWS. Specifically, ensure you can configure the agent to pull data from AWS as needed. Please look at the documentation for details.
- We used AWS’s three-tier app and installed it as instructed in GitHub. (See blog on ingesting metrics from the AWS services supporting this app.)
- Configure and install Elastic’s Serverless Forwarder.
- Ensure you turn on VPC Flow Logs for the VPC where the application is deployed and send logs to AWS Firehose.
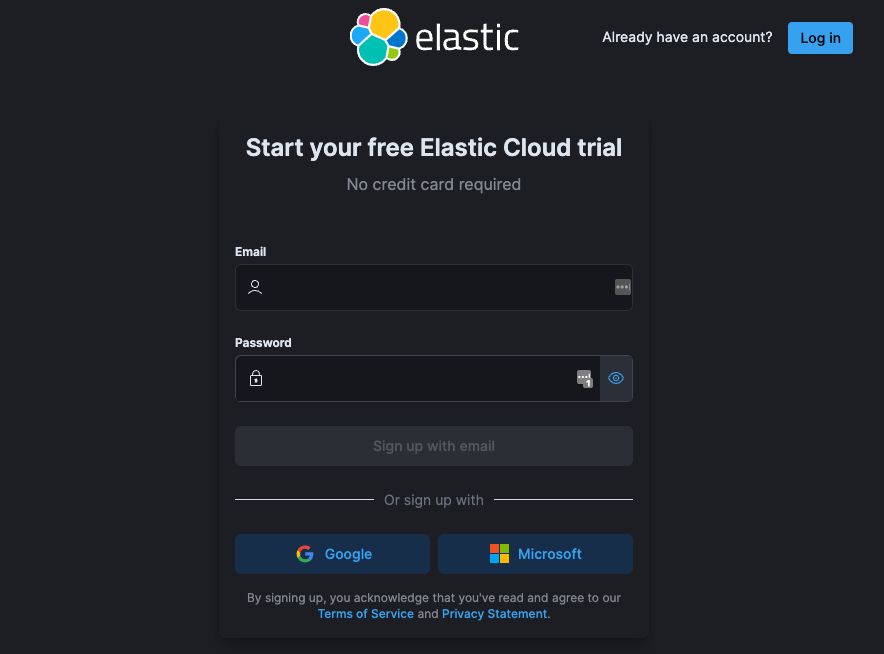
Step 0: Get an account on Elastic Cloud
Follow the instructions to get started on Elastic Cloud.
Step 1: Deploy Elastic on AWS
Once logged in to Elastic Cloud, create a deployment on AWS. It’s important to ensure that the deployment is on AWS. The Amazon Kinesis Data Firehose connects specifically to an endpoint that needs to be on AWS.
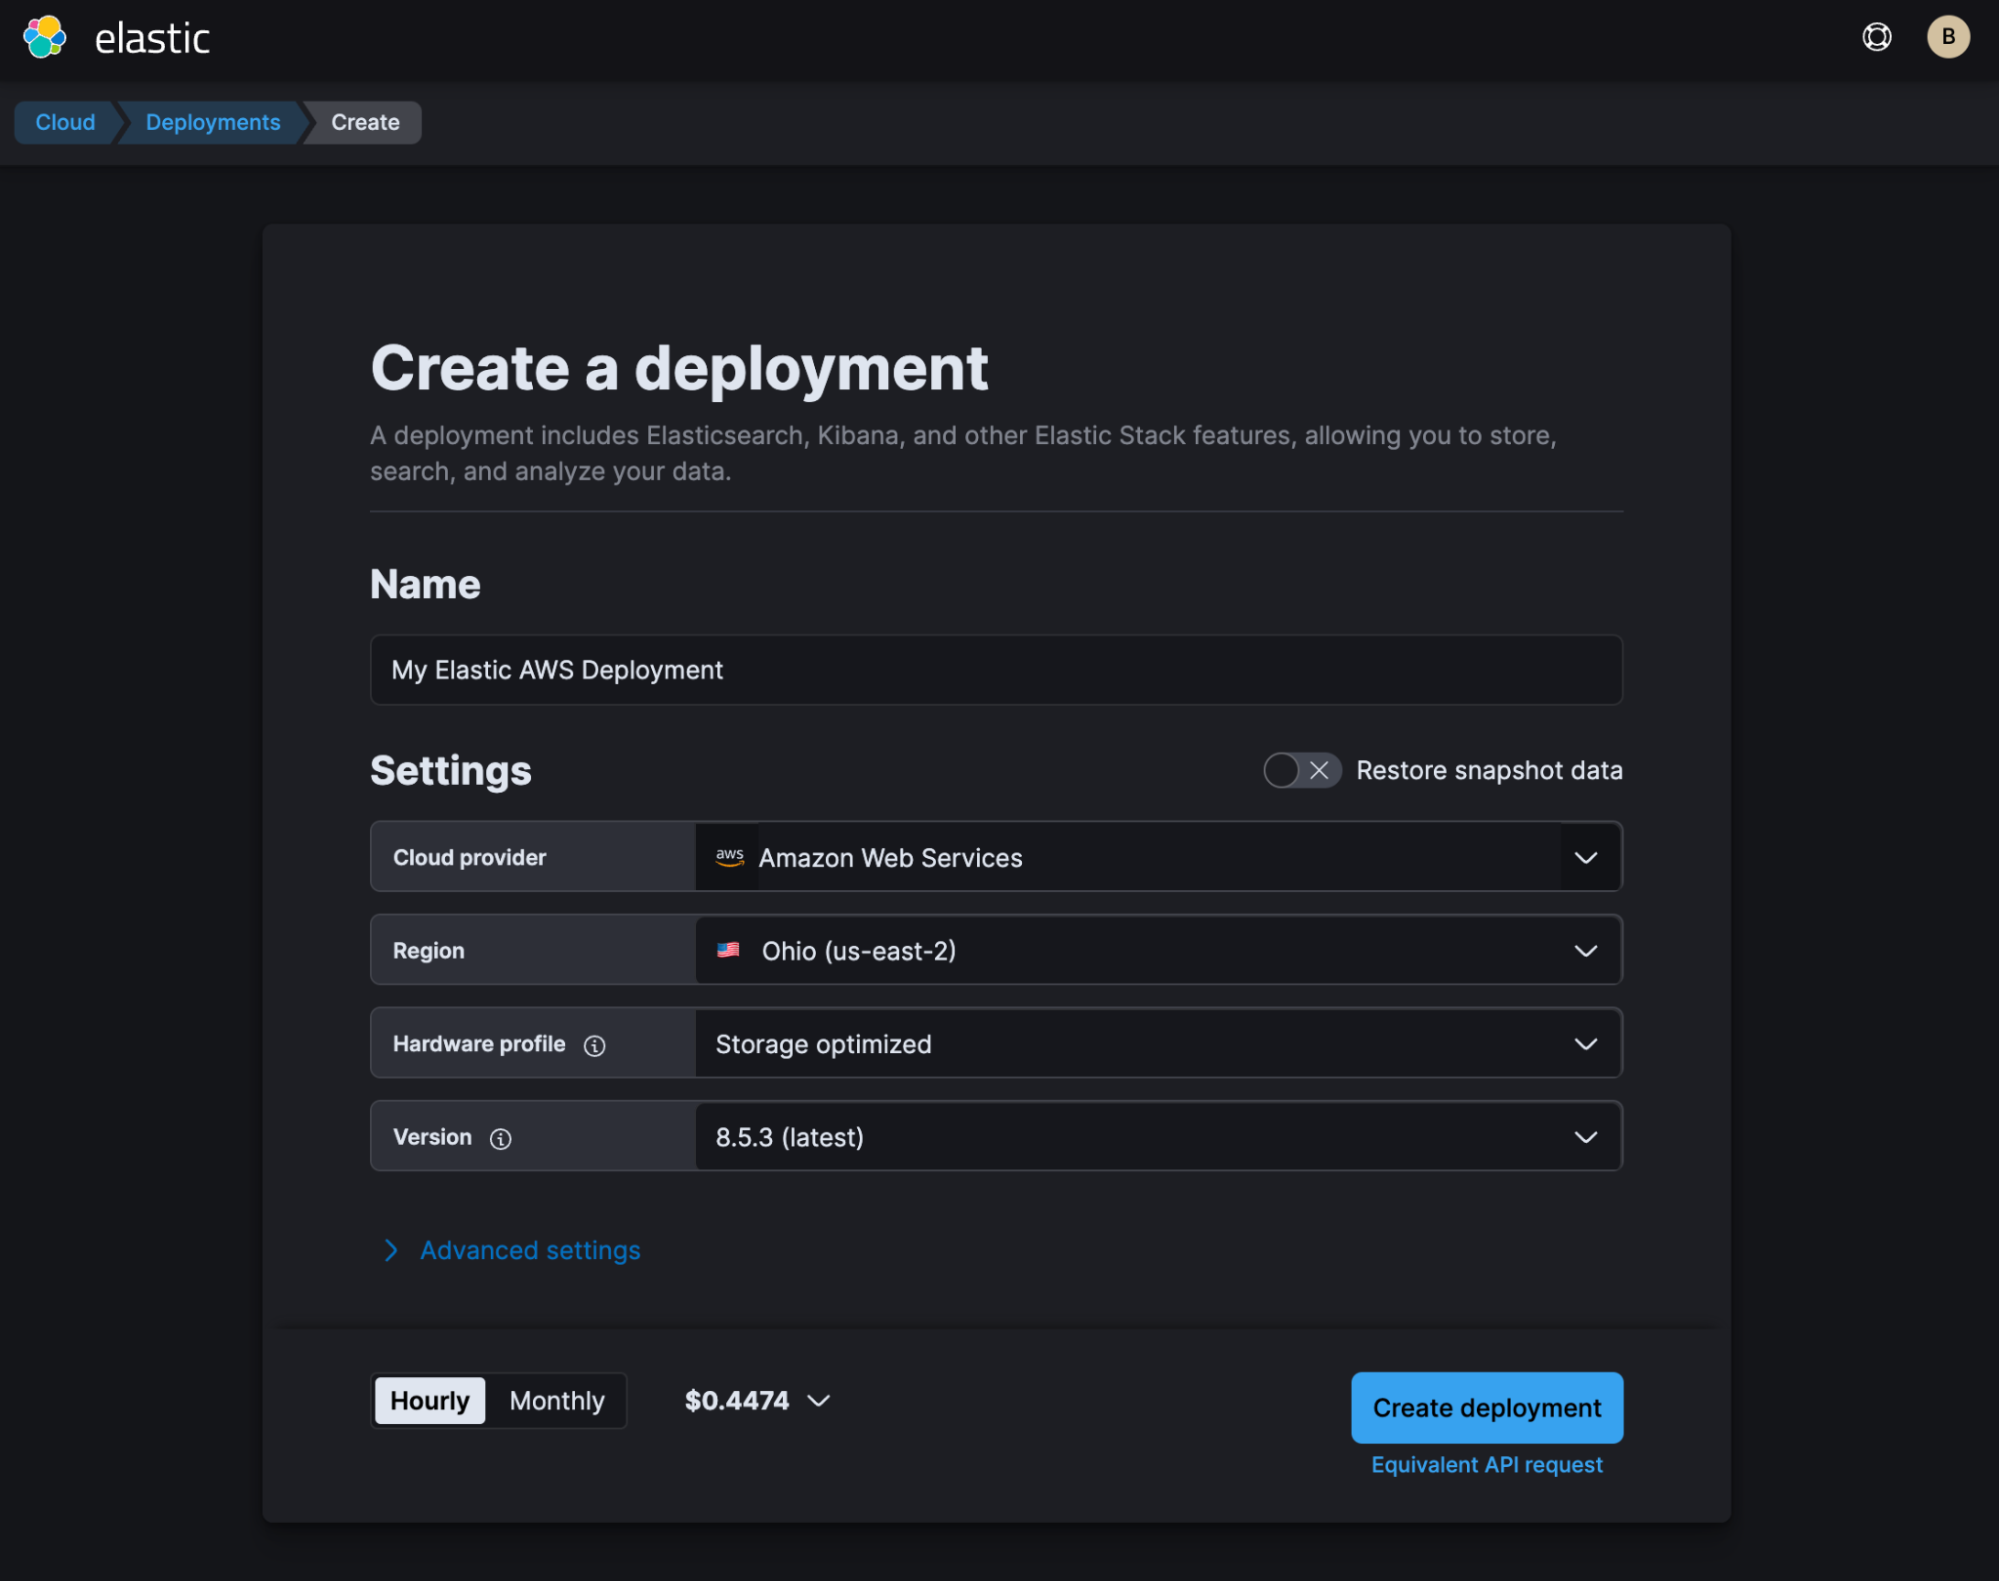
Once your deployment is created, make sure you copy the Elasticsearch endpoint.
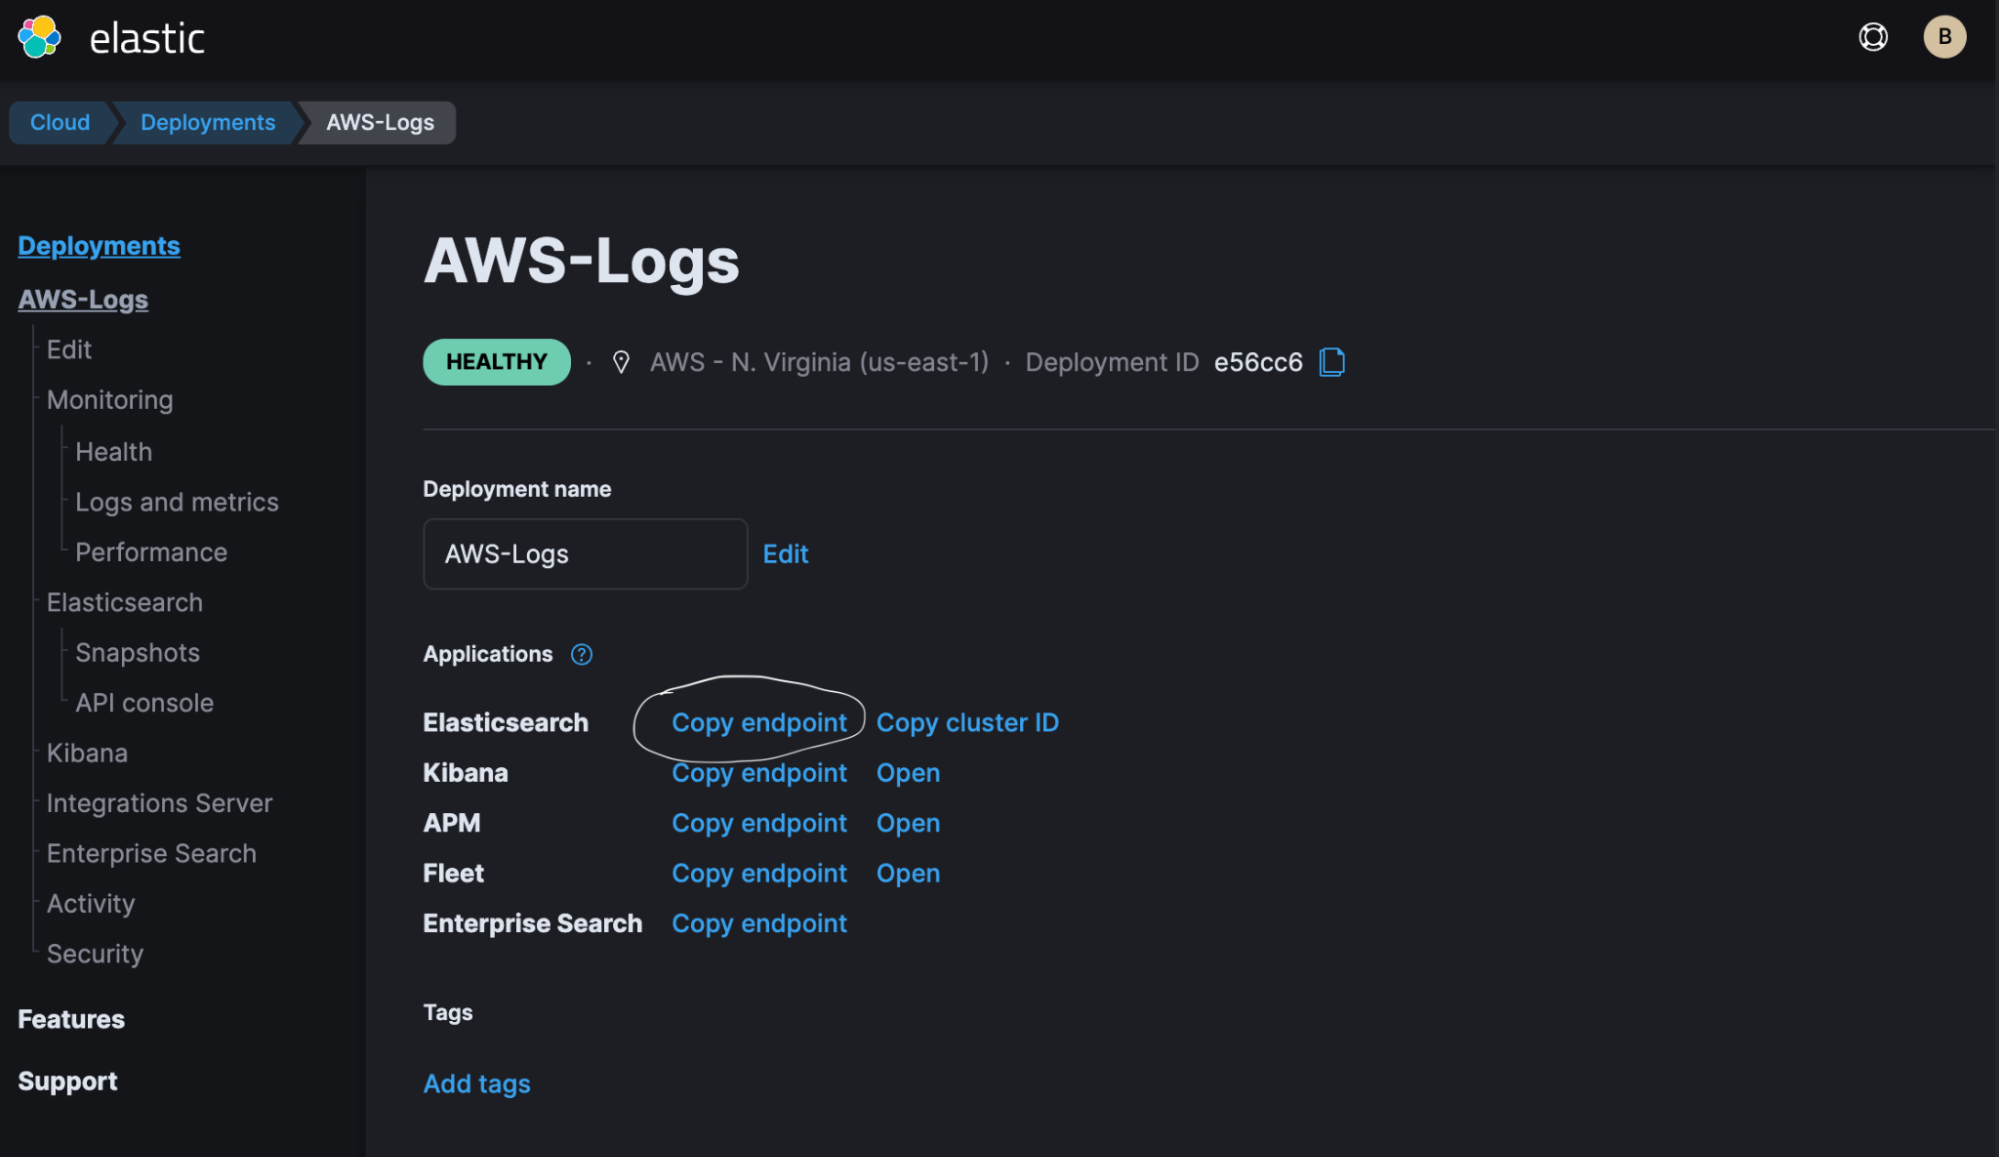
The endpoint should be an AWS endpoint, such as:
https://aws-logs.es.us-east-1.aws.found.ioStep 2: Turn on Elastic’s AWS Integrations on AWS
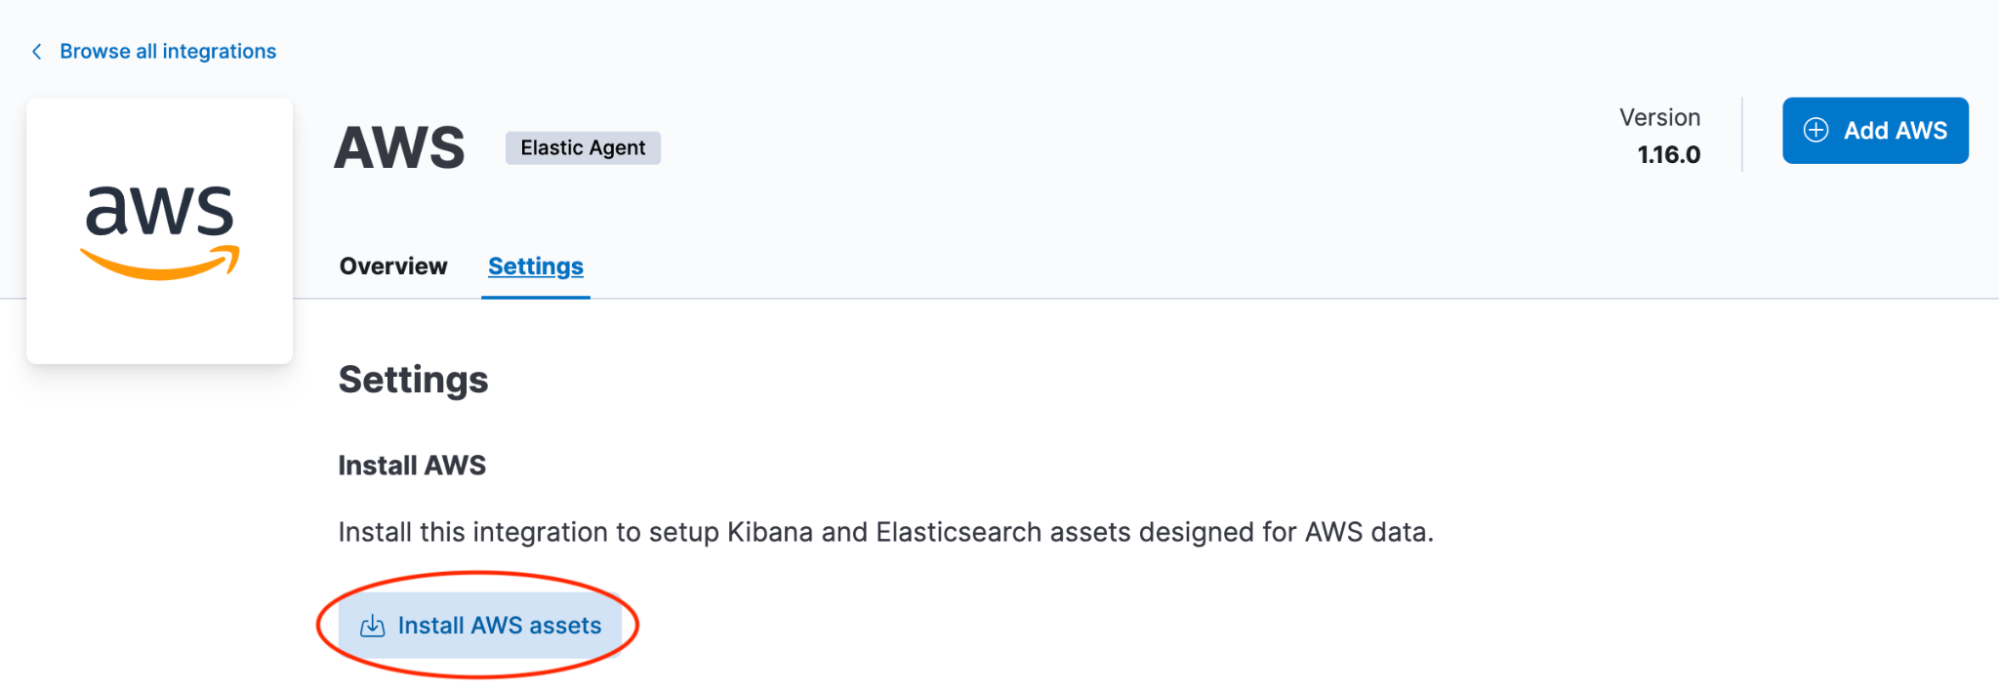
In your deployment’s Elastic Integration section, go to the AWS integration and select Install AWS assets.
Step 3: Deploy your application
Follow the instructions listed out in AWS’s Three-Tier app and instructions in the workshop link on GitHub. The workshop is listed here.
Once you’ve installed the app, get credentials from AWS. This will be needed for Elastic’s AWS integration.
There are several options for credentials:
- Use access keys directly
- Use temporary security credentials
- Use a shared credentials file
- Use an IAM role Amazon Resource Name (ARN)
View more details on specifics around necessary credentials and permissions.
Step 4: Send VPC Flow Logs to Amazon S3 and set up Amazon SQS
In the VPC for the application deployed in Step 3, you will need to configure VPC Flow Logs and point them to an Amazon S3 bucket. Specifically, you will want to keep it as AWS default format.
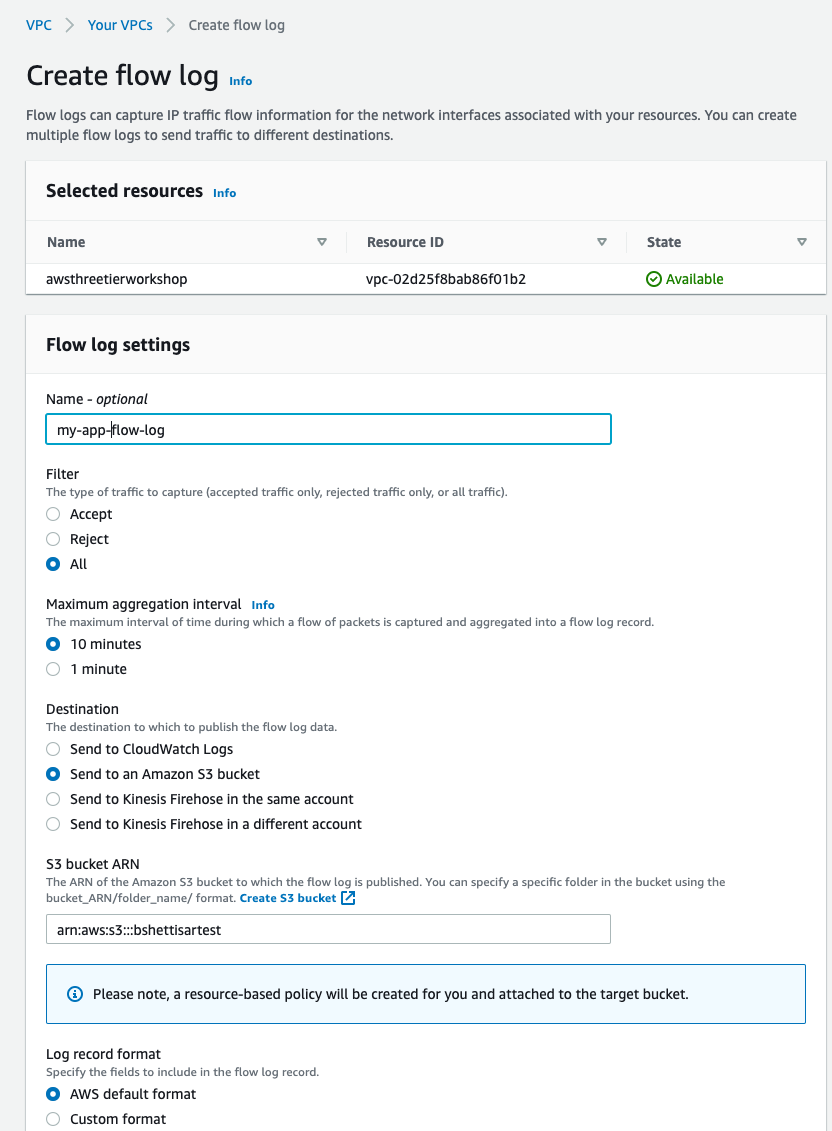
Create the VPC Flow log.
Next:
Step 5: Set up Elastic Serverless Forwarder on AWS
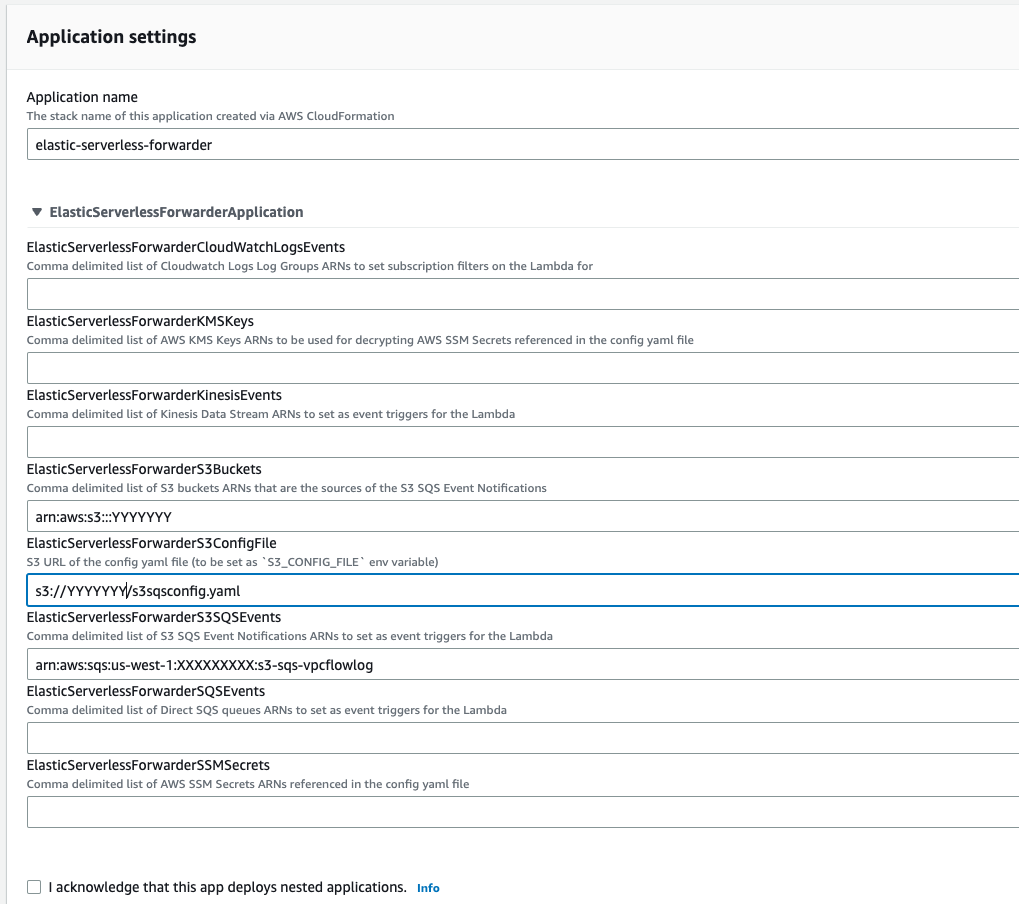
Follow instructions listed in Elastic’s documentation and refer to the previous blog providing an overview. The important bits during the configuration in Lambda’s application repository are to ensure you:
- Specify the S3 Bucket in ElasticServerlessForwarderS3Buckets where the VPC Flow Logs are being sent. The value is the ARN of the S3 Bucket you created in Step 4.
- Specify the configuration file path in ElasticServerlessForwarderS3ConfigFile. The value is the S3 url in the format "s3://bucket-name/config-file-name" pointing to the configuration file (sarconfig.yaml).
- Specify the S3 SQS Notifications queue used as the trigger of the Lambda function in ElasticServerlessForwarderS3SQSEvents. The value is the ARN of the SQS Queue you set up in Step 4.
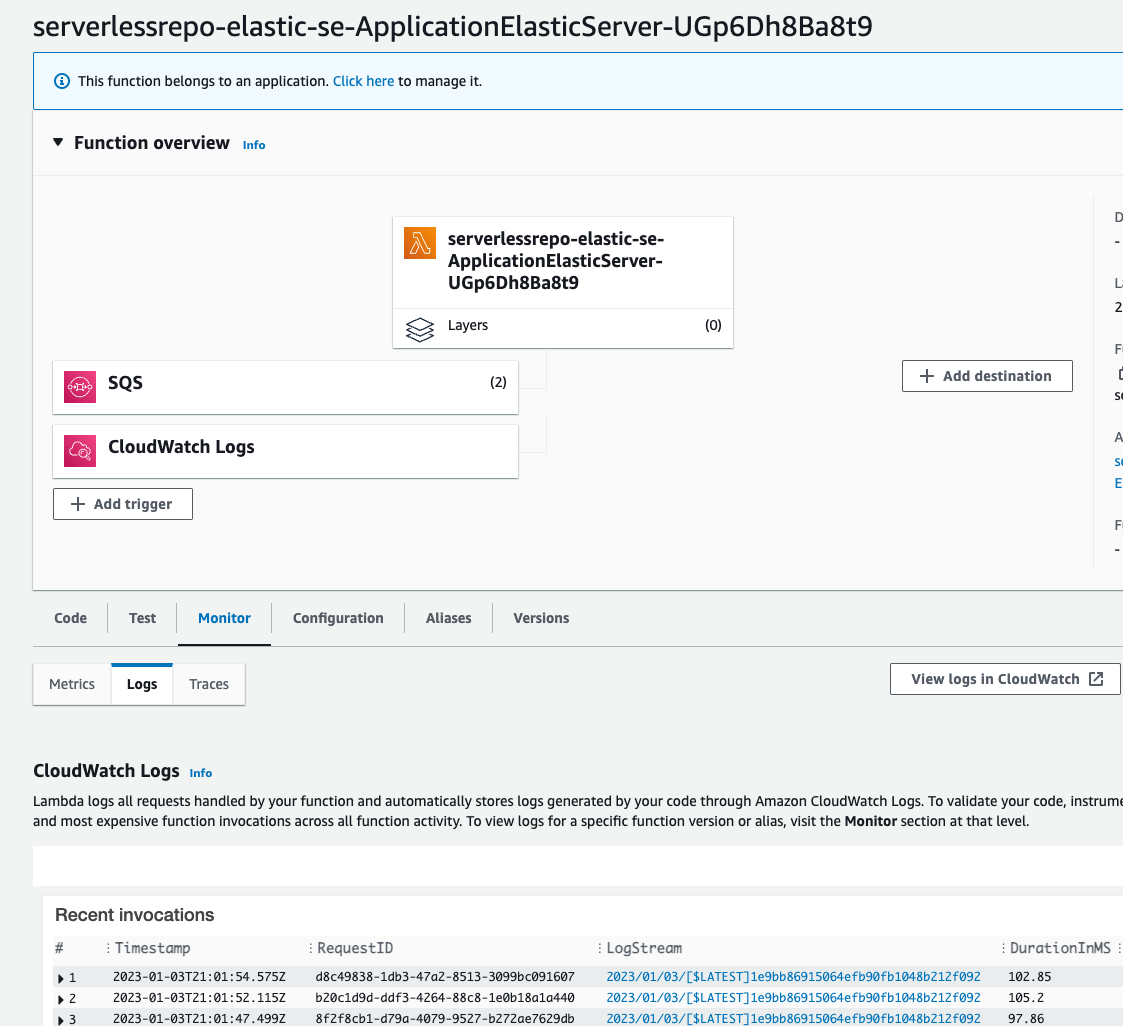
Once Amazon CloudFormation finishes setting up Elastic serverless forwarder, you should see two Amazon Lambda functions:

In order to check if logs are coming in, go to the function with “ApplicationElasticServer” in the name, and go to monitor and look at logs. You should see the logs being pulled from S3.
Step 6: Check and ensure you have logs in Elastic
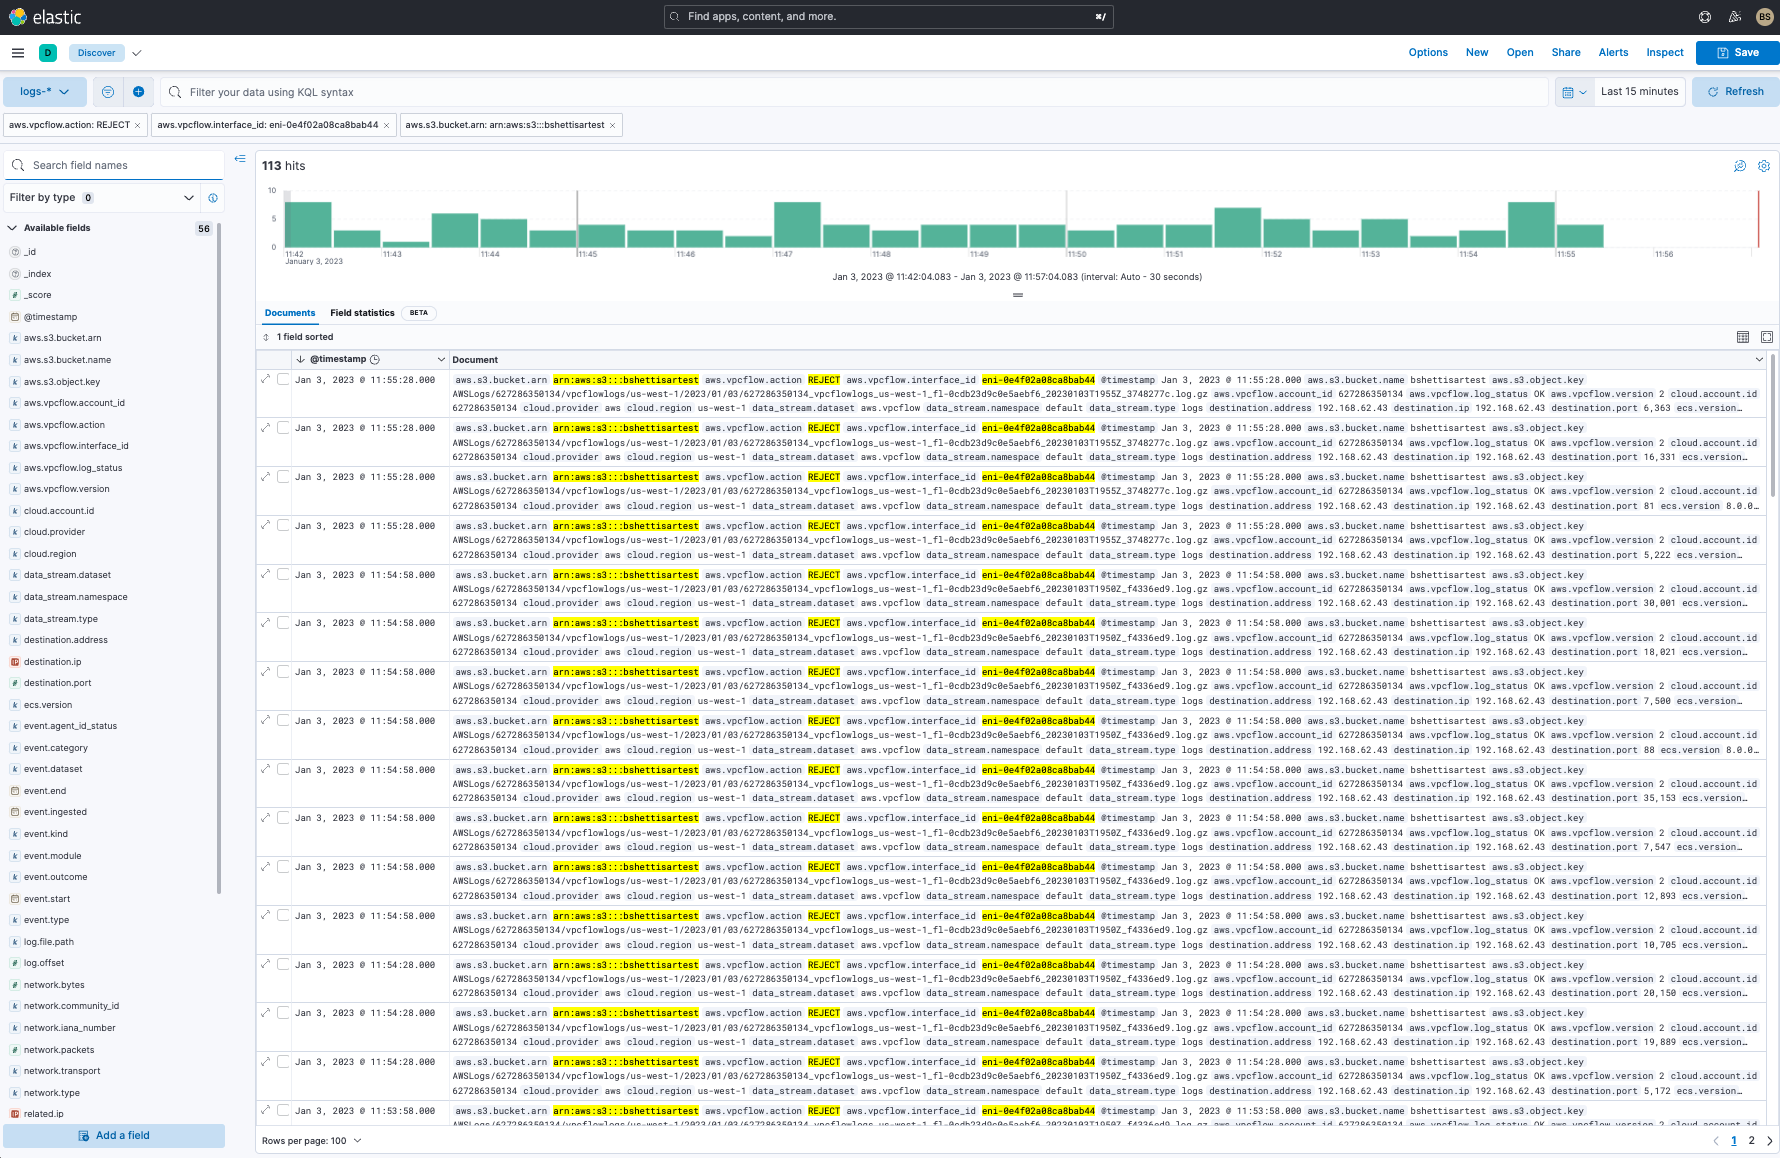
Now that steps 1–4 are complete, you can go to Elastic’s Discover capability and you should see VPC Flow Logs coming in. In the image below, we’ve filtered by Amazon S3 bucket bshettisartest.
Conclusion: Elastic Observability easily integrates with VPC Flow Logs for analytics, alerting, and insights
I hope you’ve gotten an appreciation for how Elastic Observability can help you manage AWS VPC Flow Logs. Here’s a quick recap of lessons and what you learned:
- A walk-through of how Elastic Observability provides enhanced analysis for VPC Flow Logs:
- Using Elastic’s Analytics Discover capabilities to manually analyze the data
- Leveraging Elastic Observability’s anomaly features to:
- Identify anomalies in the VPC flow logs
- Detects anomalous log entry rates
- Automatically categorizes log messages
- Using an OOTB dashboard to further analyze data
- A more detailed walk-through of how to set up the Elastic Serverless Forwarder
Start your own 7-day free trial by signing up via AWS Marketplace and quickly spin up a deployment in minutes on any of the Elastic Cloud regions on AWS around the world. Your AWS Marketplace purchase of Elastic will be included in your monthly consolidated billing statement and will draw against your committed spend with AWS.
Additional logging resources:
- Getting started with logging on Elastic (quickstart)
- Ingesting common known logs via integrations (compute node example)
- List of integrations
- Ingesting custom application logs into Elastic
- Enriching logs in Elastic
- Analyzing Logs with Anomaly Detection (ML) and AIOps

