Accelerate app development and defend against novel attacks with Elastic 8.1

Today, we are pleased to announce the latest iteration of the world’s leading platform for search-powered solutions with the general availability of Elastic 8.1.
Elastic 8.1 enables our customers and community to further accelerate software development lifecycles with deeper visibility into both serverless architectures and CI/CD pipelines. In addition, Elastic 8.1 includes new prebuilt detections, malicious behavior protections, and data source integrations to help organizations more efficiently stop advanced adversaries before they are able to cause harm.
And, across use cases, with each of Elastic’s search-powered solutions built on one stack — the Elastic Stack — users who upgrade to Elastic 8.1 will be able to enjoy 20% faster indexing speeds, 20% lower data storage requirements, and a streamlined journey from question to answer.
Whether it’s connecting people and teams with content that matters, optimizing mission-critical applications and infrastructure, or protecting your digital ecosystem from cyber threats, Elastic 8.1 is available to help everyone reach new levels of success.
Accelerate application development with deeper visibility into AWS Lambda and CI/CD pipelines
Serverless computing and CI/CD automation tools give teams a competitive edge by enabling faster software development lifecycles (SDLCs) and lower cost software deployments. Armed with these technologies, development teams can deploy more frequently and innovate more quickly by eliminating the need to manage or provision servers, while automating repetitive tasks.
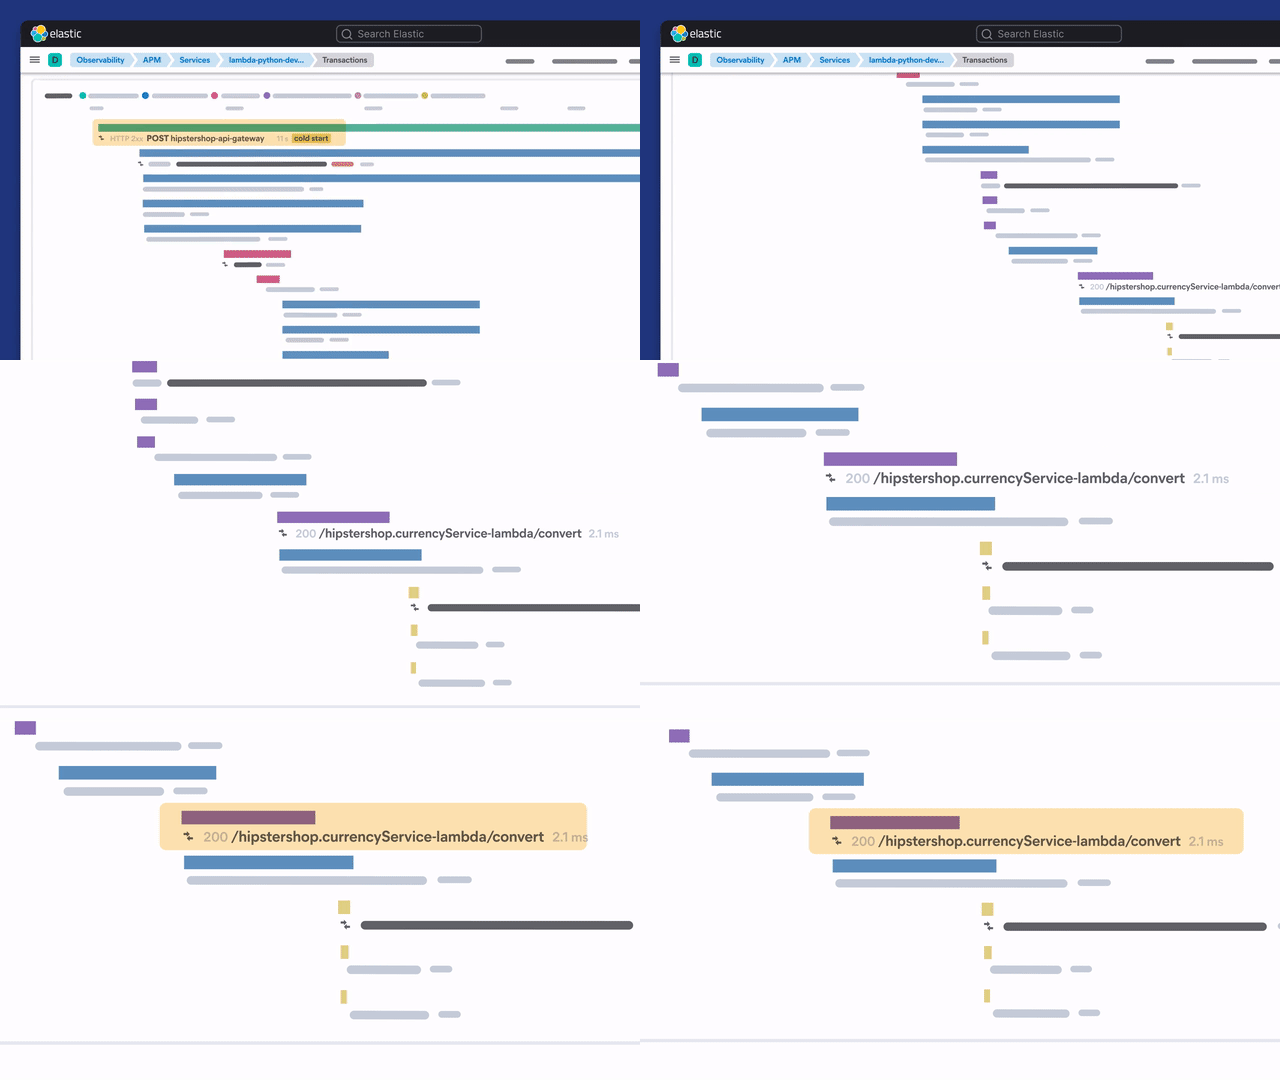
With Elastic 8.1, DevOps and site reliability engineering (SRE) teams can seamlessly collect application traces from AWS Lambda functions written in Node.js, Python, and Java (in beta). This capability bolsters end-to-end application performance monitoring (APM) visibility and helps users correlate Lambda traces with other Elastic Observability data for faster and more comprehensive root cause analysis.

Also new with Elastic 8.1, Elastic Observability users can now ingest OpenTelemetry logs. Organizations that use OpenTelemetry for traces and metrics can now standardize data collection across all data types. Support for OpenTelemetry logs offers DevOps teams a compelling opportunity to roll-out a standardized, vendor-neutral observability architecture without losing correlation between signal types and layers. Building on this feature, Elastic 8.1offers the ability to improve the traceability of the software supply chain process with detailed visibility into Jenkins errors and build execution details.
To learn more about how Elastic Observability is helping teams get enhanced visibility and streamline investigative workflows with efficient contextual troubleshooting, check out the Elastic Observability 8.1 blog.
Stop novel attacks and extend visibility across your organization
Elastic Security research engineers equip SecOps teams to stop complex attacks based upon emerging exploits like Log4Shell and previously unseen attack tools like BLISTER. Elastic continually builds, tests, and shares detection rules and malicious behavior protections, helping organizations mitigate risk without diminishing visibility.
With Elastic 8.1, companies can now use Elastic Agent to collect and normalize network activity from an unlimited number of Windows, macOS, and Linux systems. This data reveals traffic that firewalls can’t see, helping practitioners address malicious behavior within and beyond the network perimeter.
Elastic 8.1 also delivers our most substantial set of new data integrations to date.

So, whether you're consuming threat intelligence from Recorded Future, ThreatQuotient ThreatQ, or Cybersixgill, or analyzing logs from Auth0, Jira, or Zscaler — be sure to check out the Elastic Security 8.1 blog for all of the details.
Speed time to insights and lower total cost of ownership
Whether you’re working to drive mean time to resolution (MTTR) to zero or to accelerate threat detection and response, Elastic 8.1 enables you to benefit from up to 20% faster indexing speeds and 20% lower data storage requirements with doc-value-only fields.
How is this possible? Well, in simple terms, with doc-value-only fields enabled, you’re electing to not create inverted structures (like an inverted index) upon ingestion. And, yes, while not creating inverted structures will impact search performance — your time to insights and total cost of ownership can be dramatically reduced. Doc-value-only fields are another great tool to help you balance cost and performance.
You’ll be jazzed to learn that we’ve also integrated several new ad hoc analytics capabilities into Kibana Lens. When your DevOps team or security analysts need to answer complex questions and dive deeper into their datasets, they need a powerful suite of analytical tools. Elastic 8.1 delivers three new visualization types, a new capability to combine and compare multiple fields (think: drag and drop magic), and more.
If you want to double click on how doc-value-only fields work, try out the new Kibana visualization types, or to learn more about the new GeoHexGrid aggregation, we encourage you to visit the Elastic Stack 8.1 blog.
Get to the good stuff, faster
As these new features are best seen in action, it's time to begin (or continue) your Elastic journey. Elastic 8.1 is available now on Elastic Cloud — the only hosted Elasticsearch offering to include all of the new features in this latest release.
New to Elastic? Welcome aboard. You can get started today with a free 14-day trial of Elastic Cloud. Or, if the benefits of using a managed service have yet to win you over, you can always download a self-managed version of the Elastic Stack for free.
The release and timing of any features or functionality described in this post remain at Elastic's sole discretion. Any features or functionality not currently available may not be delivered on time or at all.

