- Kibana Guide: other versions:
- Introduction
- Set Up Kibana
- Getting Started
- Discover
- Visualize
- Dashboard
- Canvas
- Graph data connections
- Machine learning
- Maps
- Infrastructure
- Logs
- APM
- Uptime
- Dev Tools
- Monitoring
- Management
- Reporting from Kibana
- REST API
- Kibana plugins
- Limitations
- Release Highlights
- Breaking Changes
- Release Notes
- Developer guide
IMPORTANT: No additional bug fixes or documentation updates
will be released for this version. For the latest information, see the
current release documentation.
Building a Dashboard
editBuilding a Dashboard
editIf you haven’t yet indexed data into Elasticsearch or created an index pattern, you’ll be prompted to do so as you follow the steps for creating a dashboard. Or, you can use one of the prebuilt sample data sets, available from the Kibana home page.
- In the side navigation, click Dashboard.
- Click Create new dashboard.
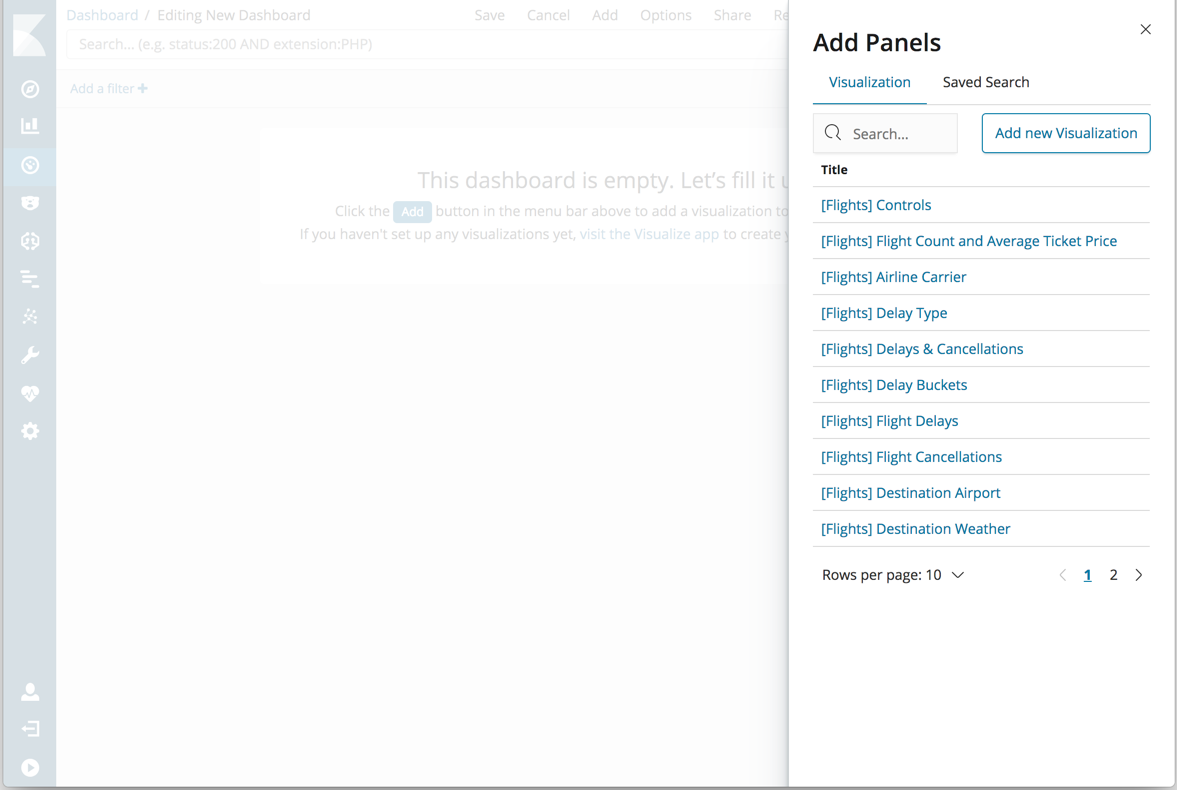
- Click Add.
-
Use Add Panels to add visualizations and saved searches to the dashboard. If you have a large number of visualizations, you can filter the lists.
- When you’re finished adding and arranging the panels, go to the menu bar and click Save.
- In Save Dashboard, enter a dashboard title and optionally a description.
- To store the time period specified in the time filter, enable Store time with dashboard.
- Click Save.
To import, export, and delete dashboards, see Managing Saved Objects.
Was this helpful?
Thank you for your feedback.