- Kibana Guide: other versions:
- Introduction
- Set Up Kibana
- Getting Started
- Discover
- Visualize
- Dashboard
- Canvas
- Graph data connections
- Machine learning
- Maps
- Infrastructure
- Logs
- APM
- Uptime
- Dev Tools
- Monitoring
- Management
- Reporting from Kibana
- REST API
- Kibana plugins
- Limitations
- Release Highlights
- Breaking Changes
- Release Notes
- Developer guide
IMPORTANT: No additional bug fixes or documentation updates
will be released for this version. For the latest information, see the
current release documentation.
Profiling queries and aggregations
editProfiling queries and aggregations
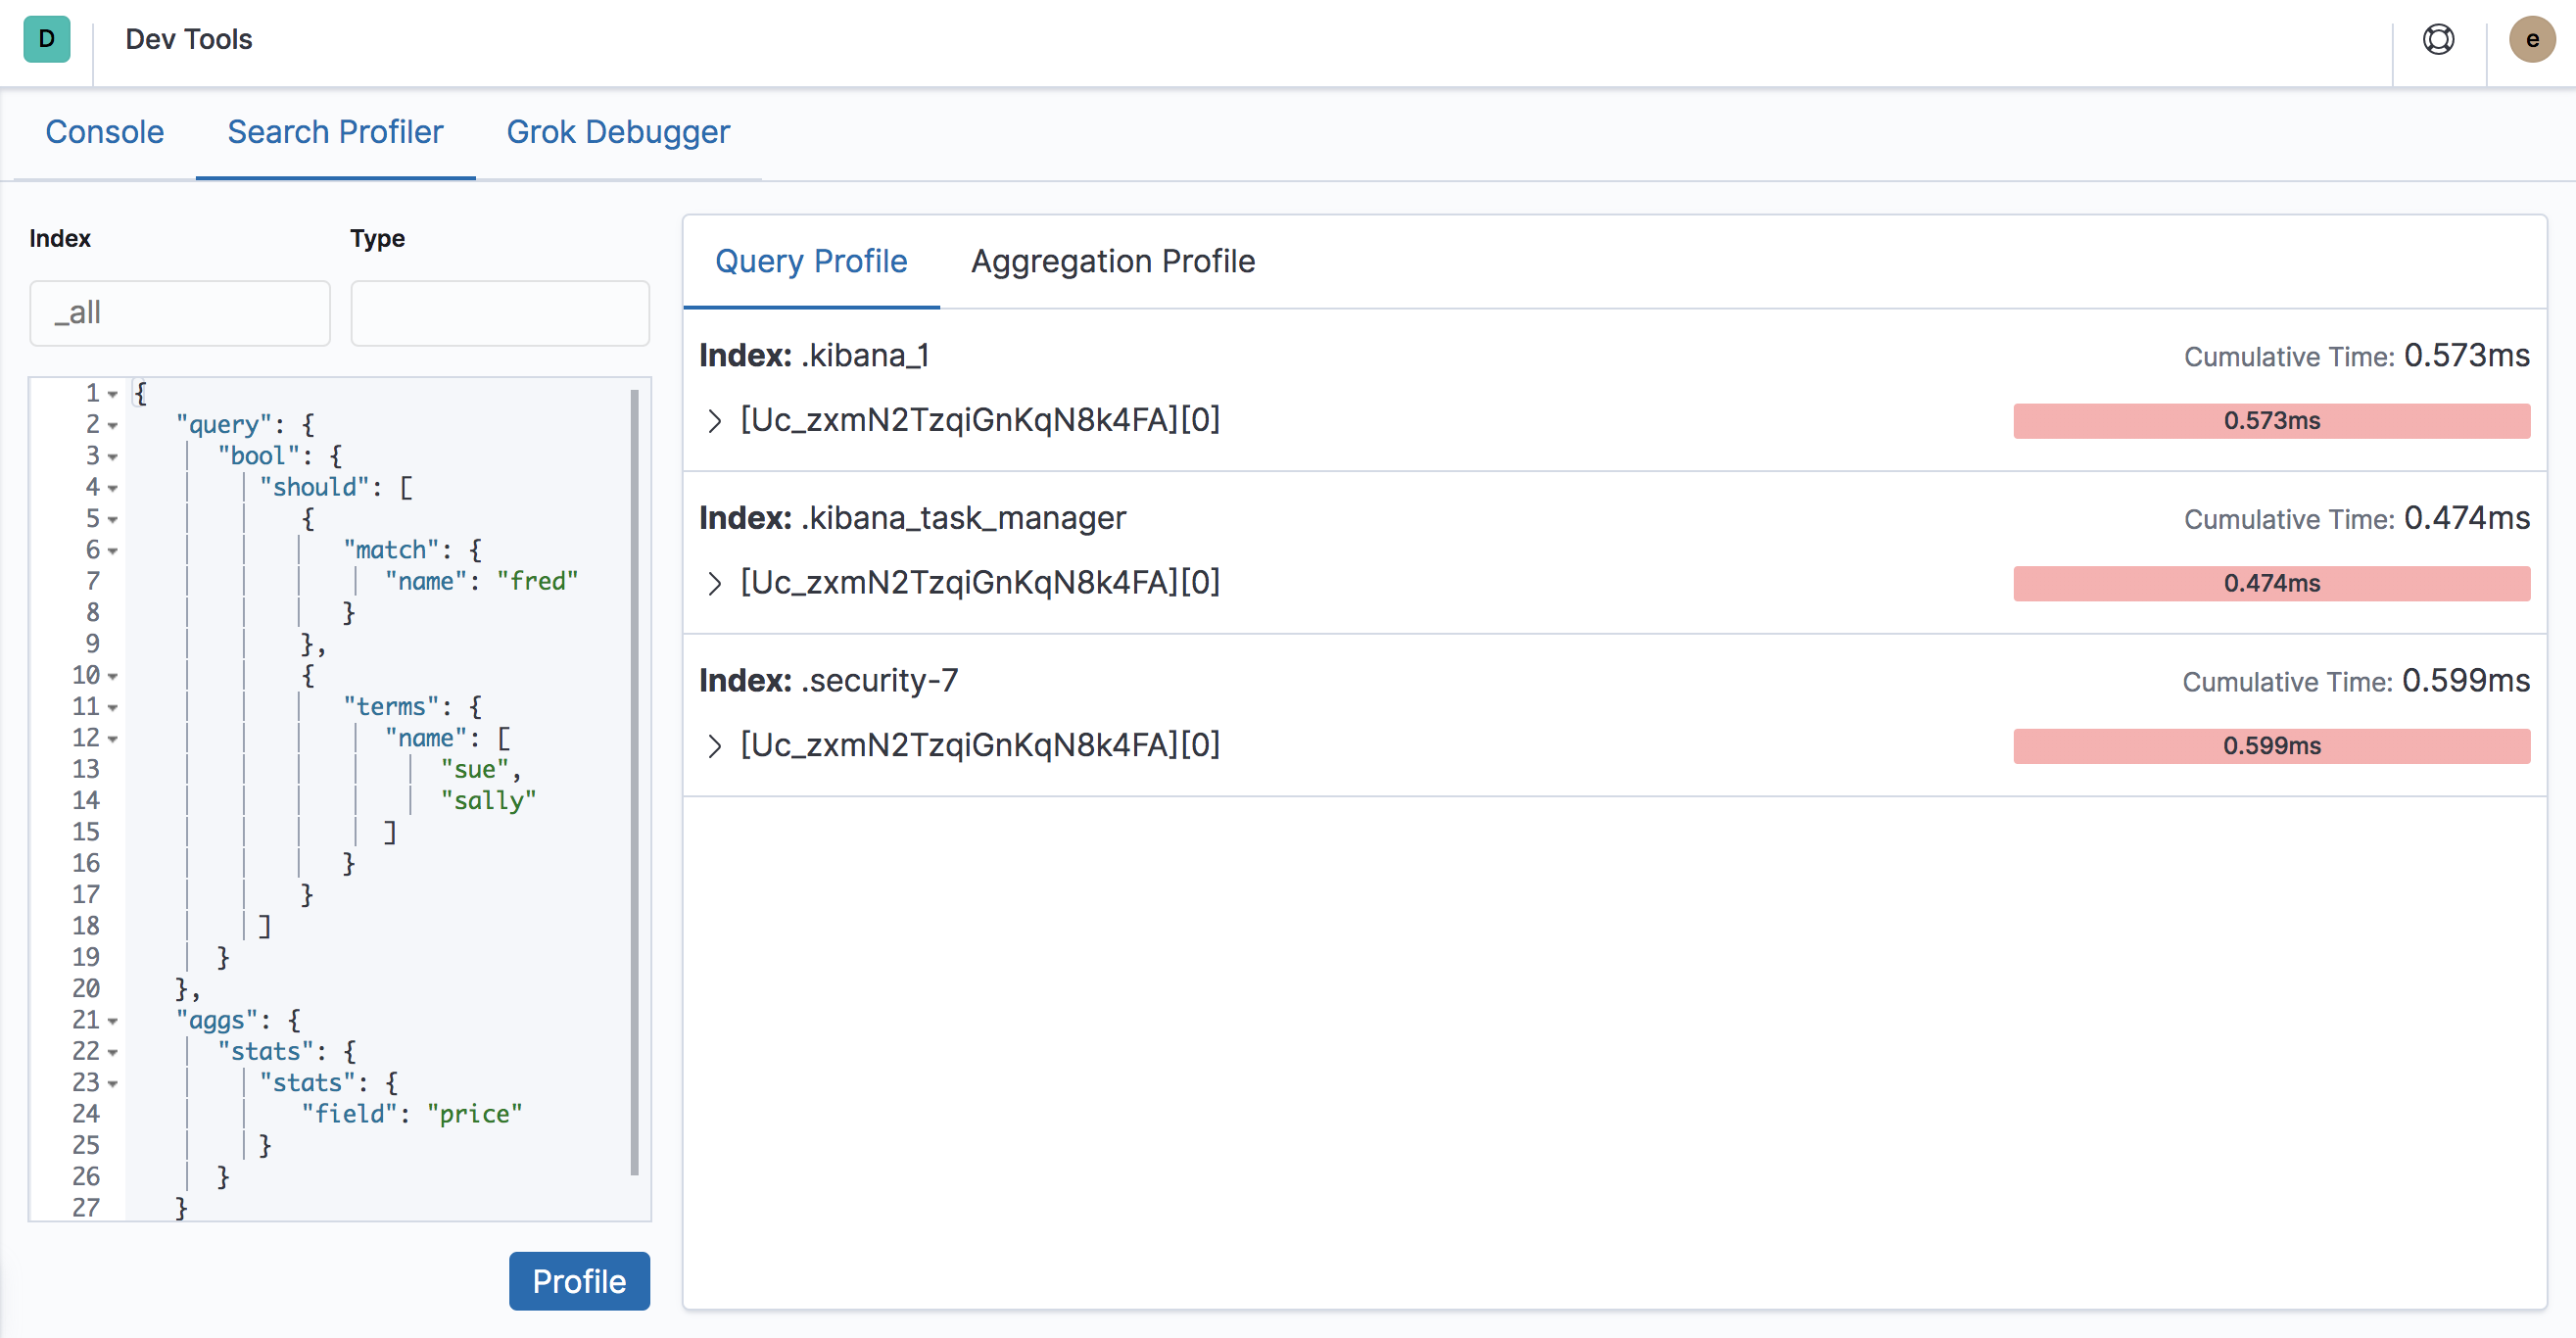
editElasticsearch has a powerful Profile API which can be used to inspect and analyze your search queries. The response returns a large JSON blob, which can be difficult to analyze manually.
The Search Profiler tool can transform this JSON output into a visualization that is easy to navigate, allowing you to diagnose and debug poorly performing queries much faster.
Was this helpful?
Thank you for your feedback.