- Kibana Guide: other versions:
- What is Kibana?
- What’s new in 8.7
- Kibana concepts
- Quick start
- Set up
- Install Kibana
- Configure Kibana
- Alerting and action settings
- APM settings
- Banners settings
- Enterprise Search settings
- Fleet settings
- i18n settings
- Logging settings
- Logs settings
- Metrics settings
- Monitoring settings
- Reporting settings
- Search sessions settings
- Secure settings
- Security settings
- Spaces settings
- Task Manager settings
- Telemetry settings
- URL drilldown settings
- Start and stop Kibana
- Access Kibana
- Securing access to Kibana
- Add data
- Upgrade Kibana
- Configure security
- Configure reporting
- Configure logging
- Configure monitoring
- Command line tools
- Production considerations
- Discover
- Dashboard and visualizations
- Canvas
- Maps
- Build a map to compare metrics by country or region
- Track, visualize, and alert on assets in real time
- Map custom regions with reverse geocoding
- Heat map layer
- Tile layer
- Vector layer
- Plot big data
- Search geographic data
- Configure map settings
- Connect to Elastic Maps Service
- Import geospatial data
- Troubleshoot
- Reporting and sharing
- Machine learning
- Graph
- Alerting
- Observability
- APM
- Security
- Dev Tools
- Fleet
- Osquery
- Stack Monitoring
- Stack Management
- REST API
- Get features API
- Kibana spaces APIs
- Kibana role management APIs
- User session management APIs
- Saved objects APIs
- Data views API
- Index patterns APIs
- Alerting APIs
- Action and connector APIs
- Cases APIs
- Add comment
- Create case
- Delete cases
- Delete comments
- Find case activity
- Find cases
- Find connectors
- Get alerts
- Get case activity
- Get case
- Get case status
- Get cases by alert
- Get comments
- Get configuration
- Get reporters
- Get tags
- Push case
- Set configuration
- Update cases
- Update comment
- Update configuration
- Import and export dashboard APIs
- Logstash configuration management APIs
- Machine learning APIs
- Osquery manager API
- Short URLs APIs
- Get Task Manager health
- Upgrade assistant APIs
- Kibana plugins
- Troubleshooting
- Accessibility
- Release notes
- Developer guide
AIOps Labs
editAIOps Labs
editAIOps Labs is a part of Machine Learning in Kibana which provides features that use advanced statistical methods to help you interpret your data and its behavior.
Explain log rate spikes
editThis functionality is in technical preview and may be changed or removed in a future release. Elastic will work to fix any issues, but features in technical preview are not subject to the support SLA of official GA features.
Explain log rate spikes is a feature that uses advanced statistical methods to identify reasons for increases in log rates. It makes it easy to find and investigate causes of unusual spikes by using the analysis workflow view. Examine the histogram chart of the log rates for a given data view, and find the reason behind a particular change possibly in millions of log events across multiple fields and values.
You can find explain log rate spikes under Machine Learning > AIOps Labs where you can select the data view or saved search that you want to analyze.
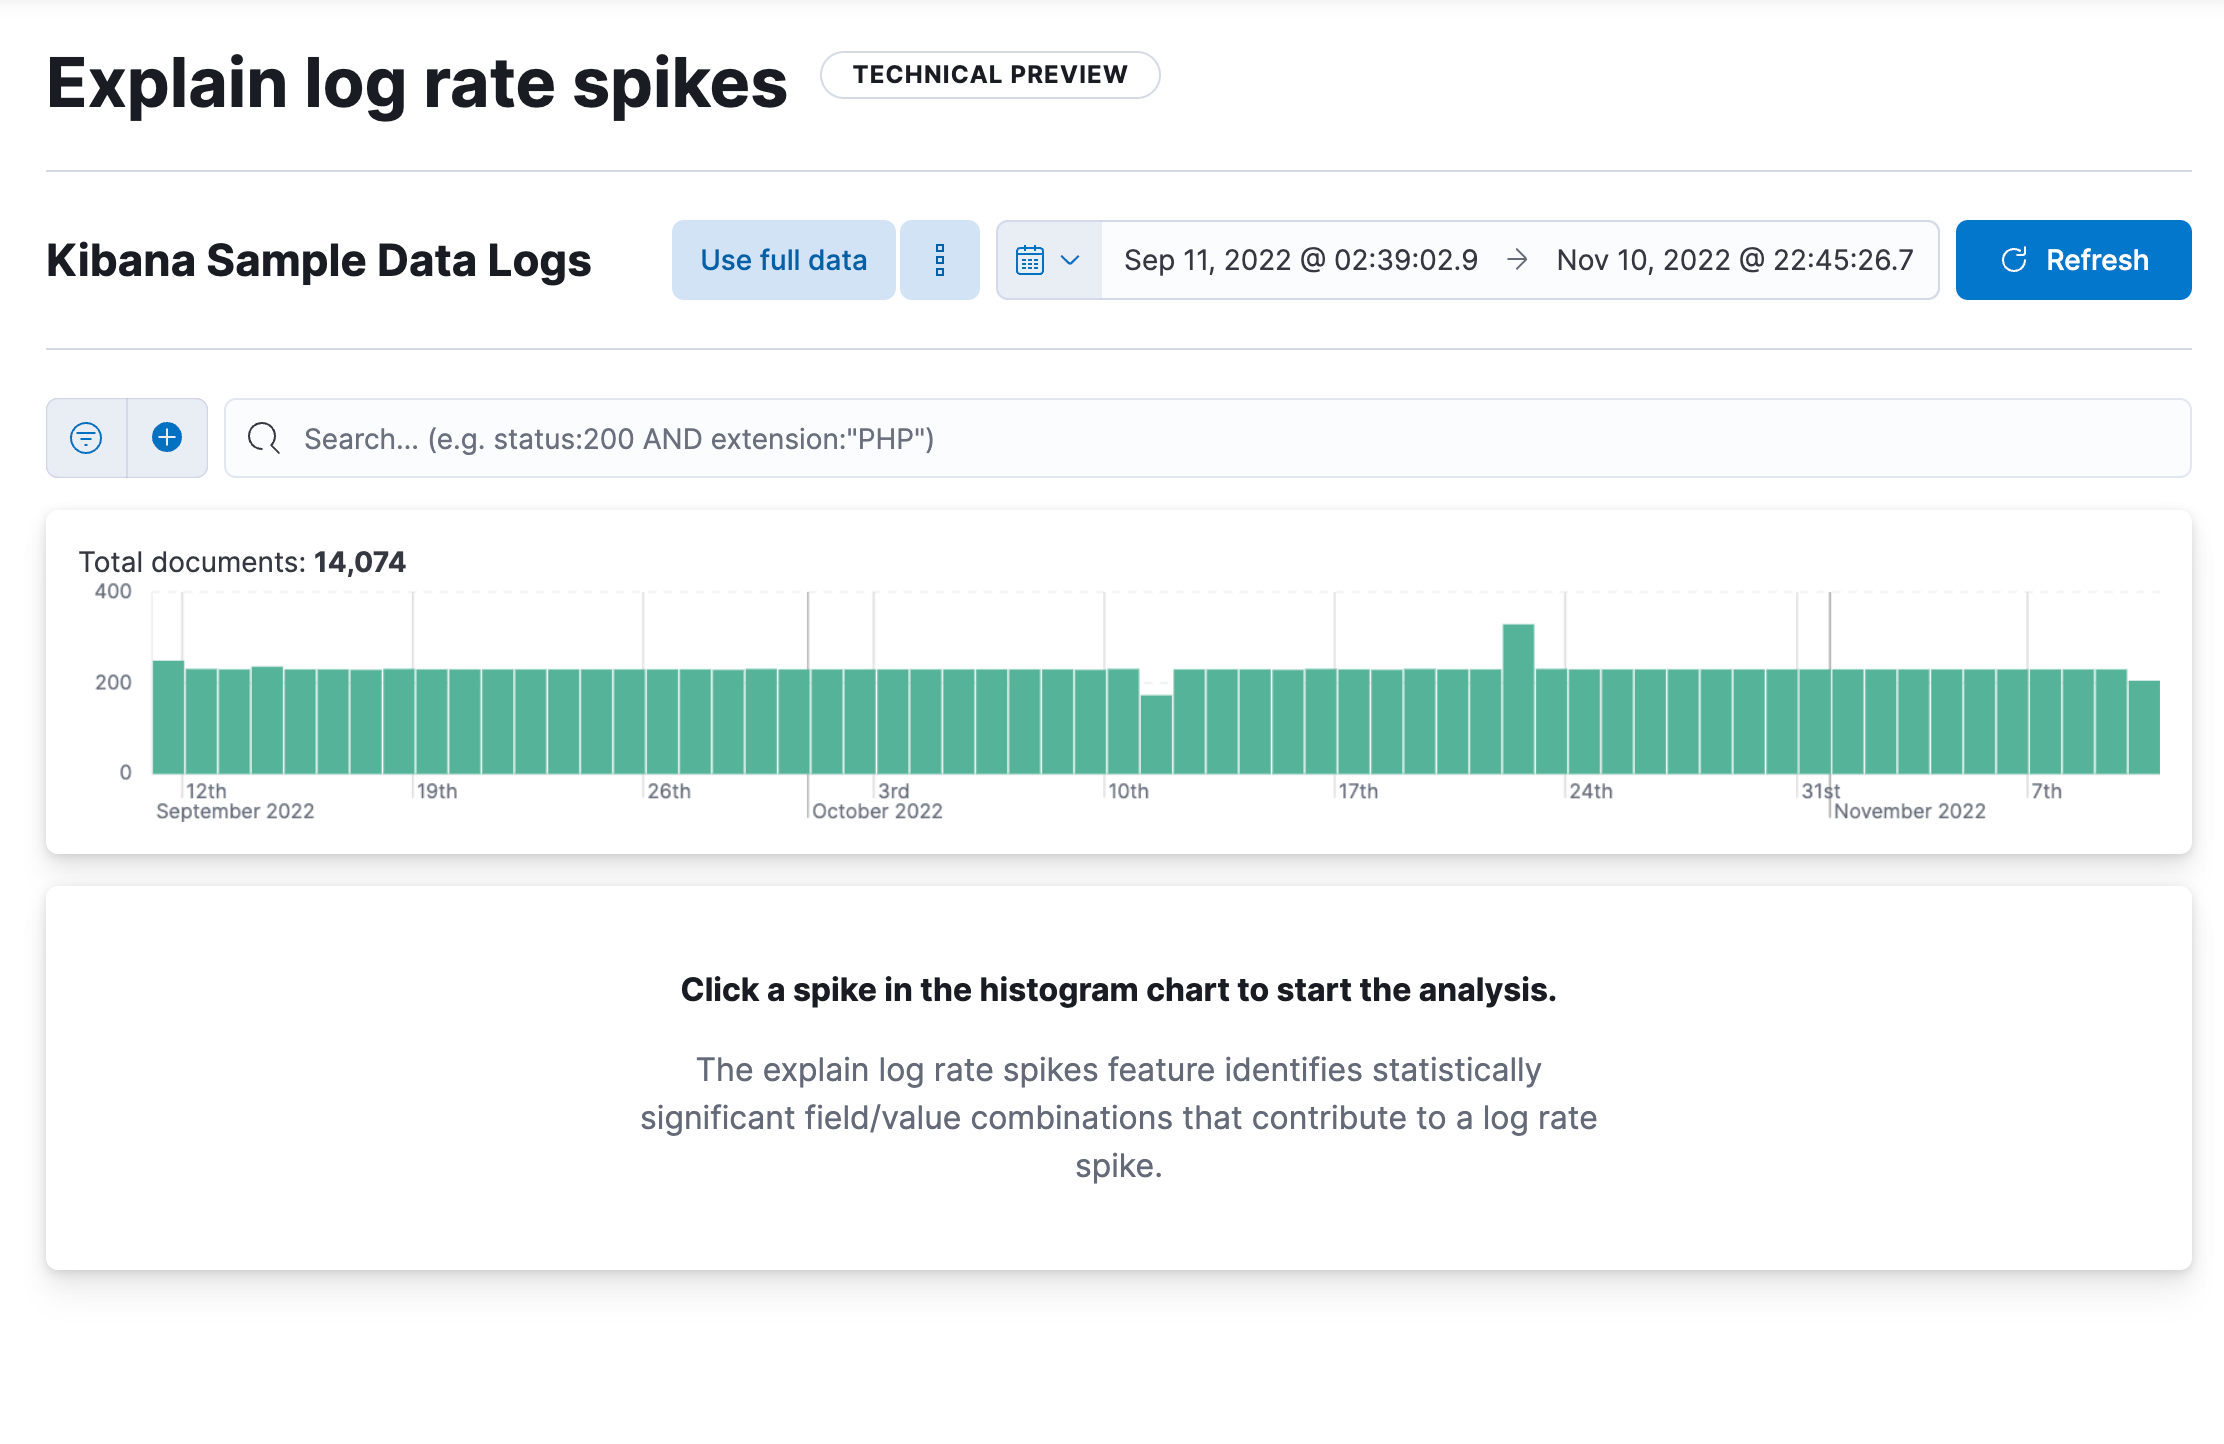
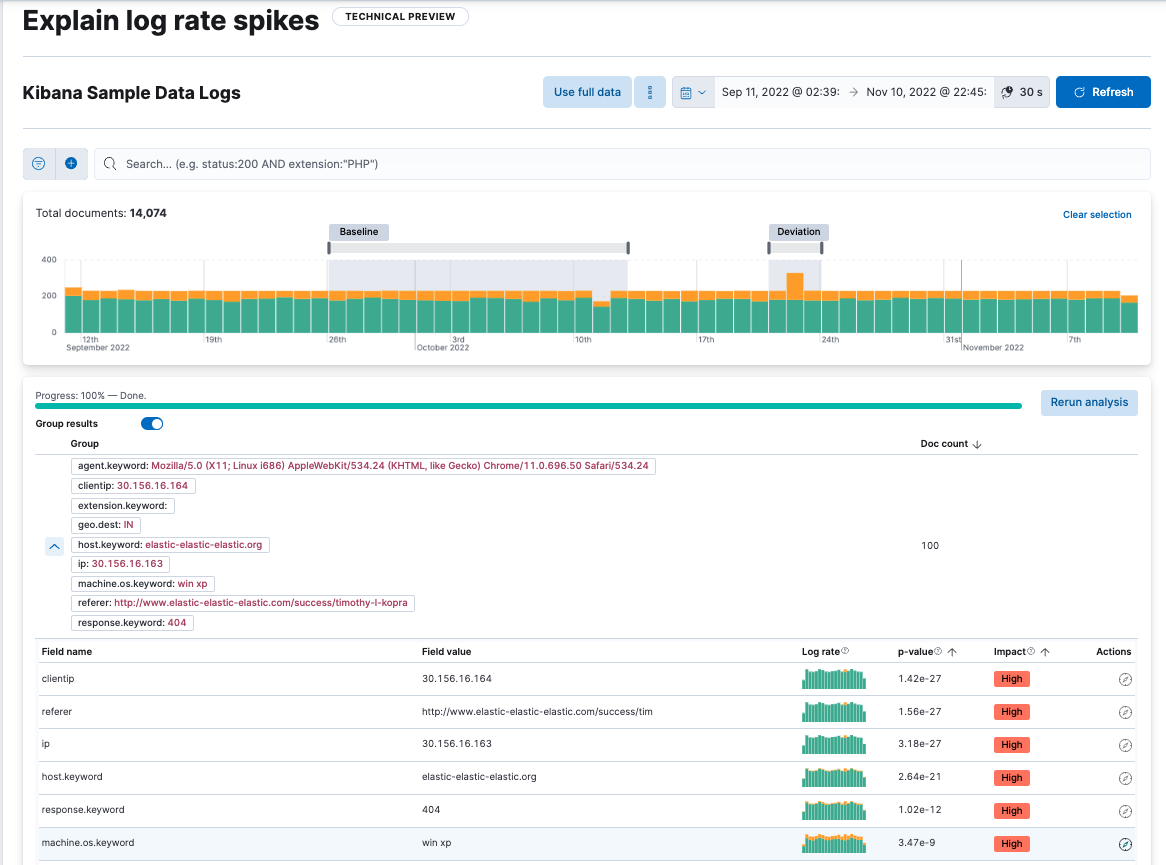
Select a spike in the log event histogram chart to start the analysis. It identifies statistically significant field-value combinations that contribute to the spike and displays them in a table. You can optionally choose to summarize the results into groups. The table also shows an indicator of the level of impact and a sparkline showing the shape of the impact in the chart. Hovering over a row displays the impact on the histogram chart in more detail. You can inspect a field in Discover by selecting this option under the Actions column. You can also pin a table row by clicking on it then move the cursor to the histogram chart. It displays a tooltip with exact count values for the pinned field which enables closer investigation.
Brushes in the chart show the baseline time range and the deviation in the analyzed data. You can move the brushes to redefine both the baseline and the deviation and rerun the analysis with the modified values.
Log pattern analysis
editThis functionality is in technical preview and may be changed or removed in a future release. Elastic will work to fix any issues, but features in technical preview are not subject to the support SLA of official GA features.
Log pattern analysis helps you to find patterns in unstructured log messages and makes it easier to examine your data. It performs categorization analysis on a selected field of a data view, creates categories based on the data and displays them together with a chart that shows the distribution of each category and an example document that matches the category.
You can find log pattern analysis under Machine Learning > AIOps Labs where you can select the data view or saved search that you want to analyze.
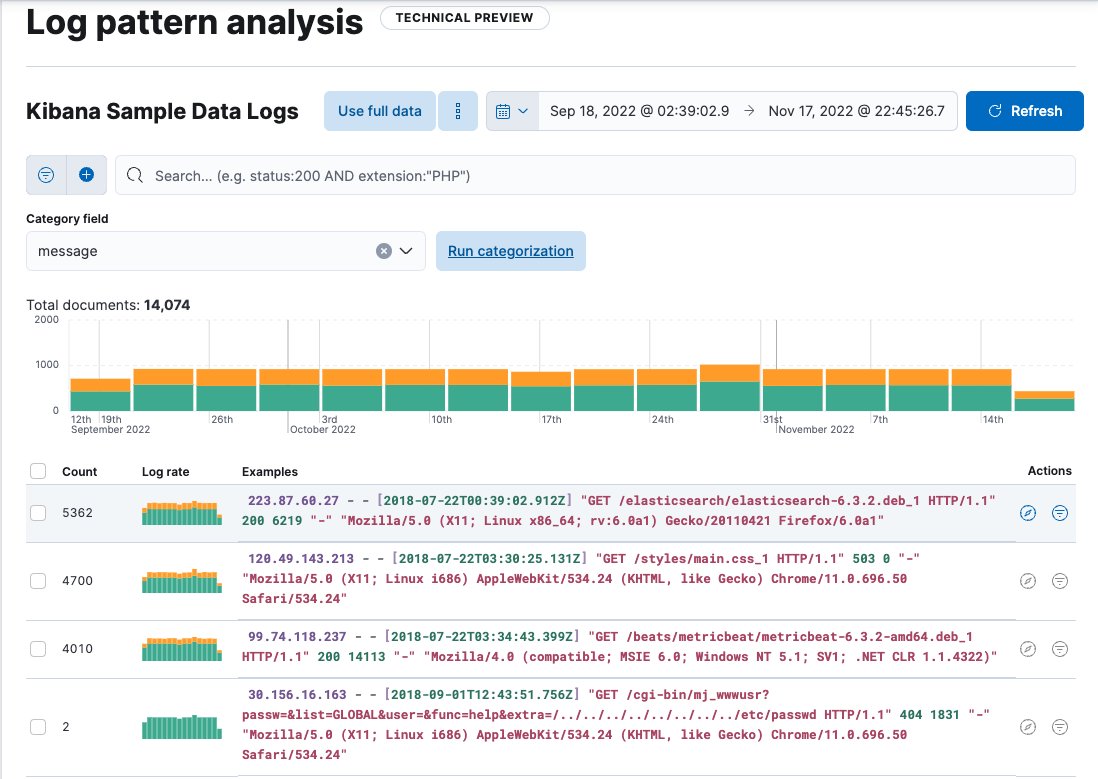
Select a field for categorization and optionally apply any filters that you want, then start the analysis. The analysis uses the same algorithms as a machine learning categorization job. The results of the analysis are shown in a table that makes it possible to open Discover and show or filter out the given category there, which helps you to further examine your log messages.
Change point detection
editThis functionality is in technical preview and may be changed or removed in a future release. Elastic will work to fix any issues, but features in technical preview are not subject to the support SLA of official GA features.
Change point detection uses the change point aggregation to detect distribution changes, trend changes, and other statistically significant change points in a metric of your time series data.
You can find change point detection under Machine Learning > AIOps Labs where you can select the data view or saved search that you want to analyze.
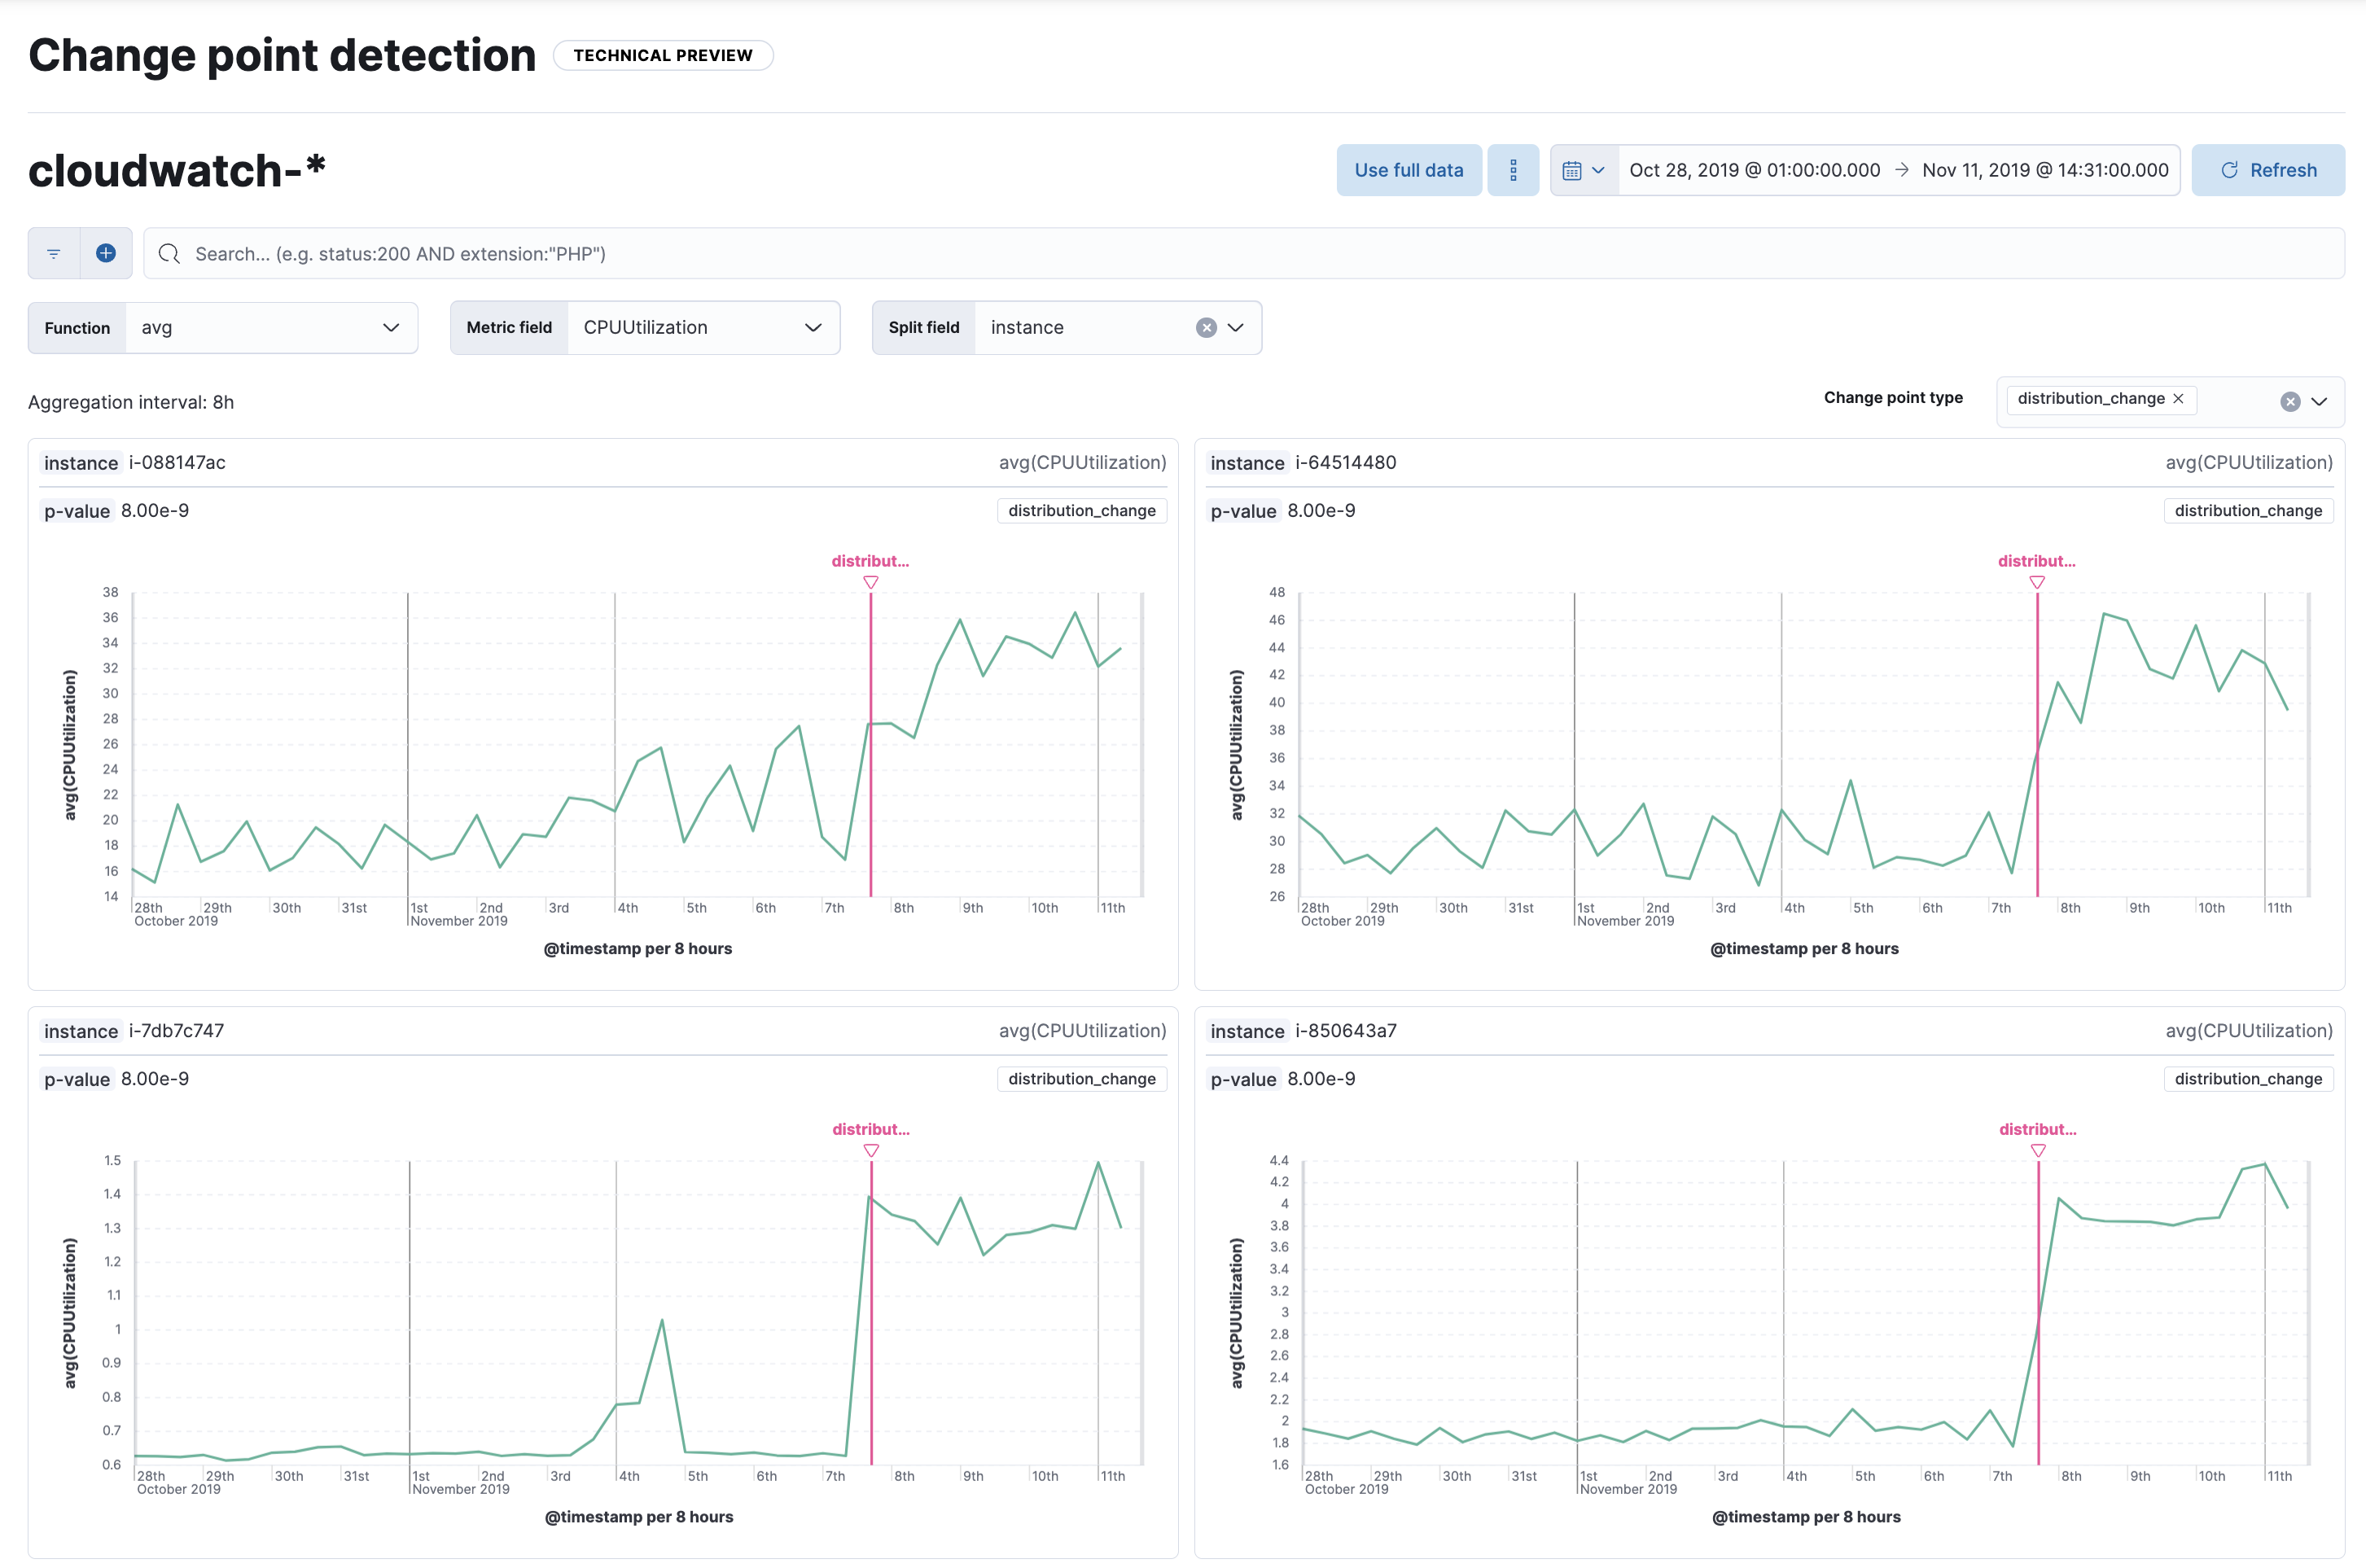
Select a function and a metric field, then pick a date range to start detecting change points in the defined range. Optionally, you can split the data by a field. If the cardinality of the split field is greater than 10,000, then only the first 10,000, sorted by document count, are analyzed.
If a change point is detected, a chart visualizes where the change point was identified in
the time window analyzed, making the interpretation easier. If you split the analysis by a
field, a separate chart is displayed for every partition with a detected change
point. You can view the type of change point in the chart as well as its value
and the time when the change happened. The corresponding p-value indicates how
extreme the change is; lower values mark more significant changes. You can use
the change point type selector to filter the results by specific types of change
points.