

Observability: Monitor your application performance
Overview
Introduction to Elastic Observability
Get more familiar with Elastic Observability as well as an overview on how to ingest, view, and analyze customer logs from your applications using Elastic Cloud. Learn how you can modernize applications and adopt the cloud with confidence.
Interactive demo: APM overview
Check out this interactive demo to get a tour of what you can experience when you leverage Elastic Observability for monitoring your application performance.
Let's get started
Create an Elastic Cloud account
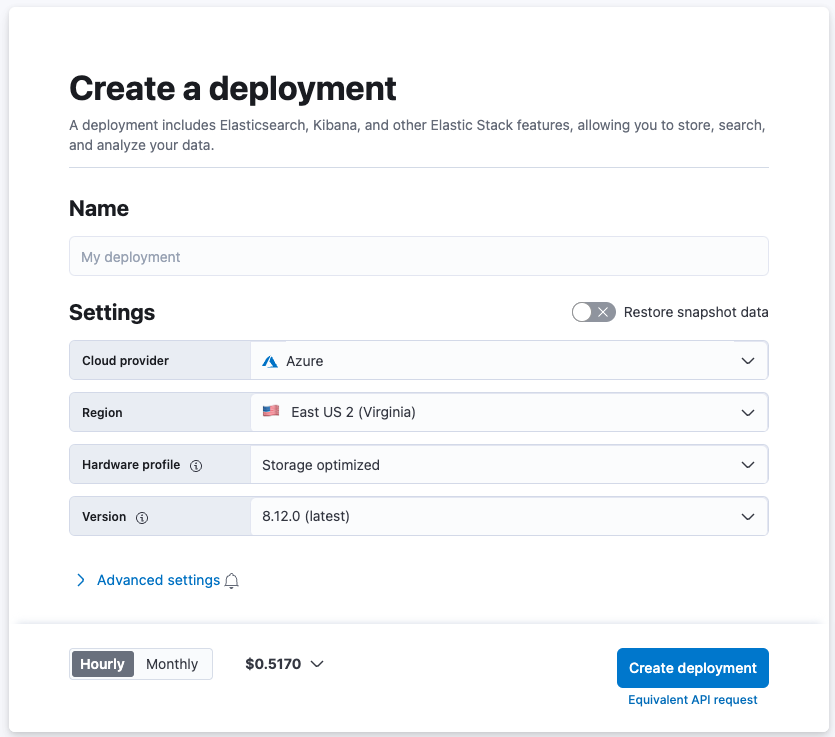
Once you go to cloud.elastic.co and create an account, follow this video to learn how to launch your first Elastic stack in any one of our 50+ supported regions globally.
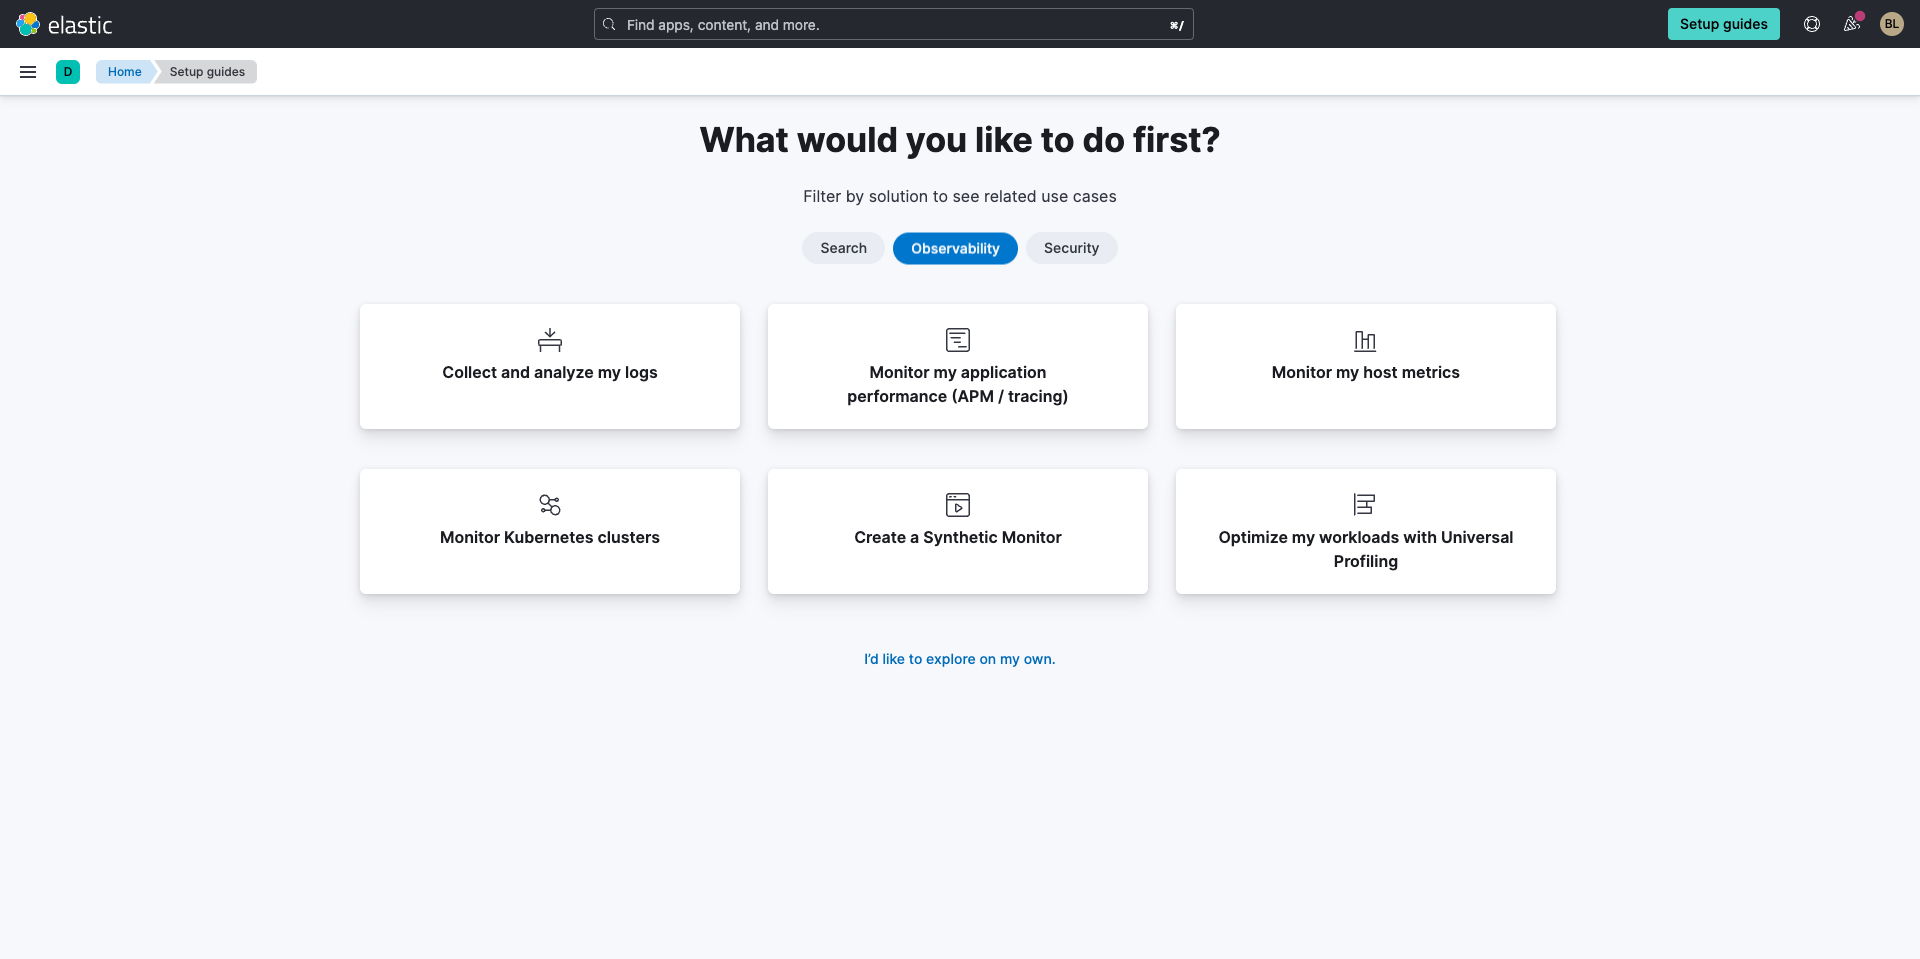
Once your deployment is complete, under the Observability tab, select Monitor my application performance (APM/tracking)
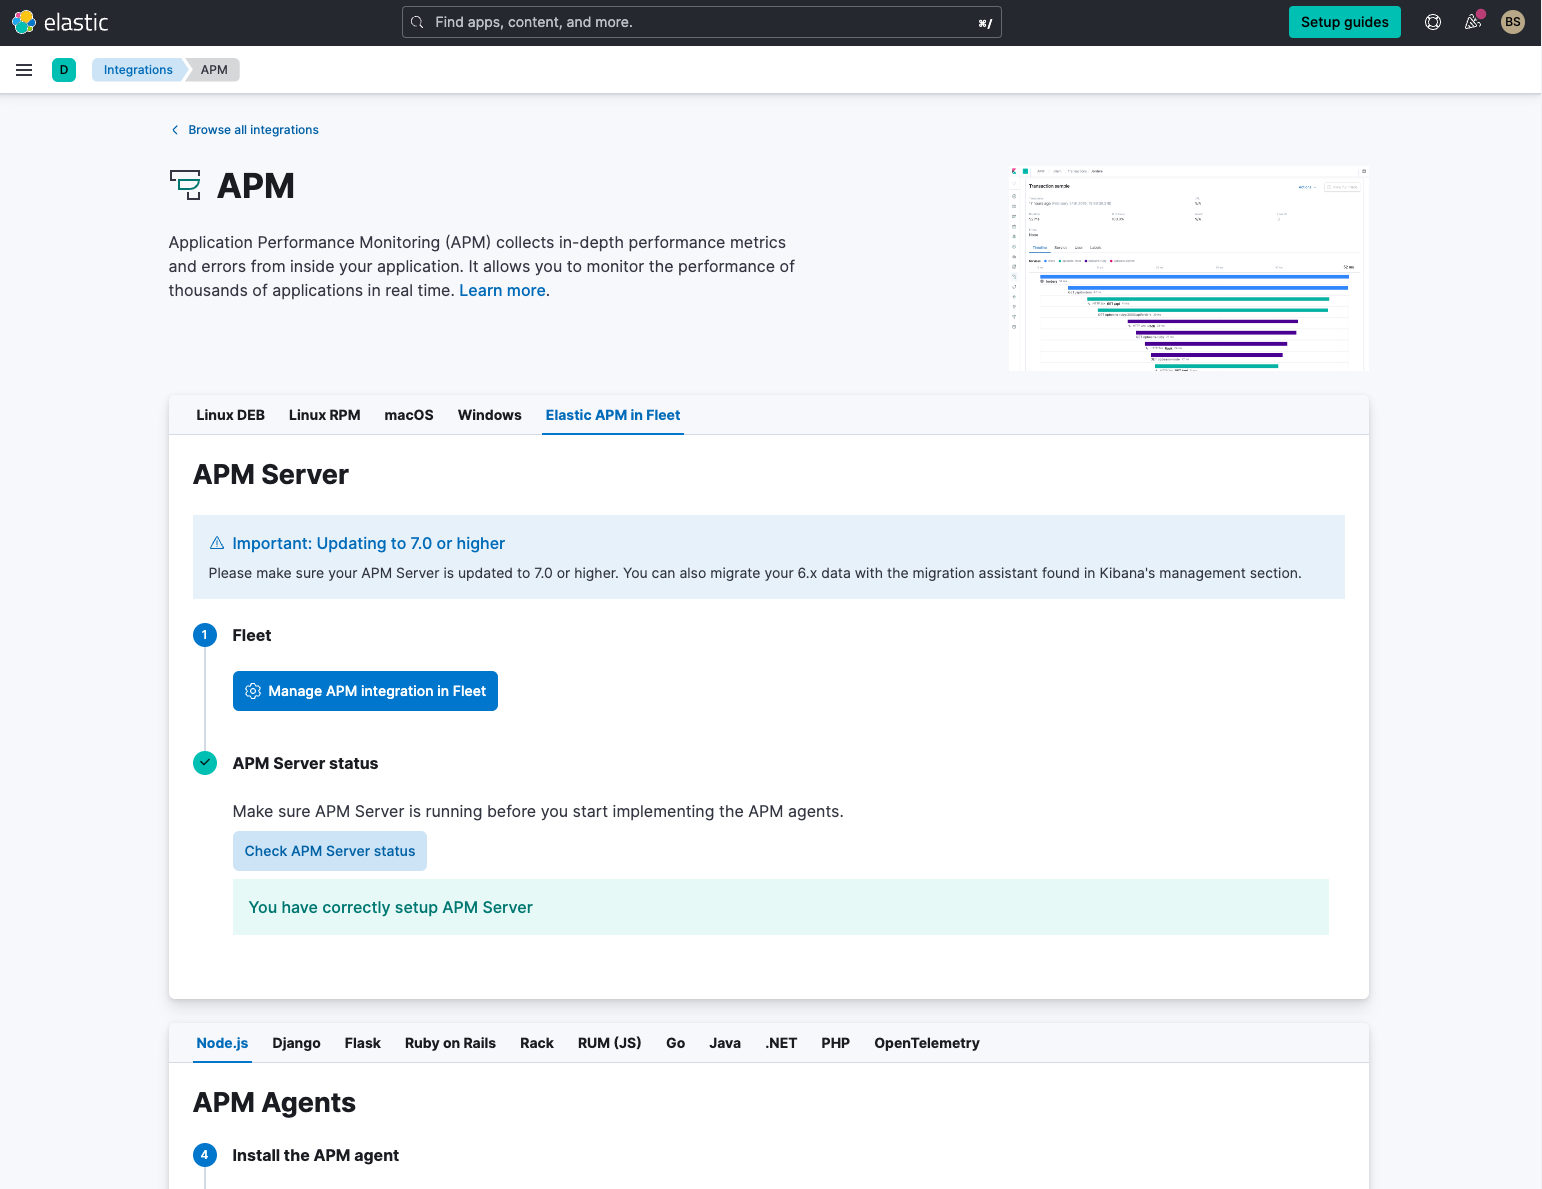
Using Elastic APM
As an Elastic Cloud user you have Elastic APM available in Fleet. Simply confirm it’s running by selecting Check APM Server Status. If it shows “You have correctly setup the APM Server” then you can proceed to the next step to get started on Elastic Cloud (Elasticsearch service).
Experience Elastic APM
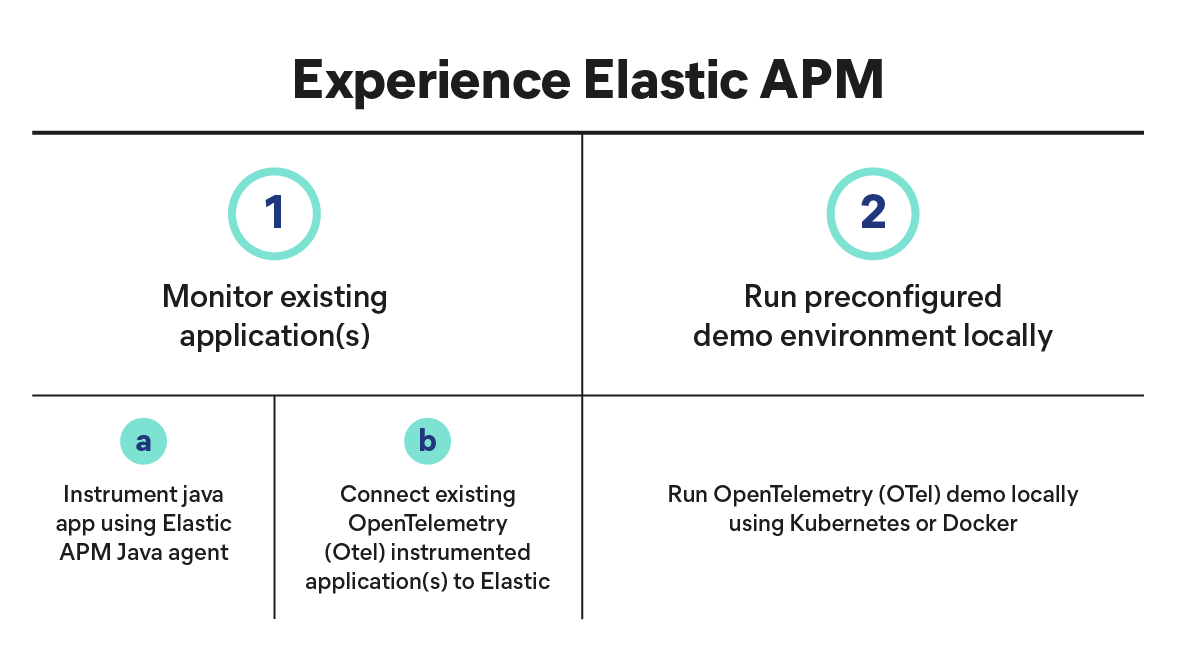
There are multiple ways to get started on Elastic APM such as:
- Monitoring your application with Elastic APM agents. Several language options are available to select from: Node.js, Django, Flask, Ruby on Rails, Rack, RUM(JS), GO, Java, .NET, and PHP; or
- Ingesting telemetry from Opentelemetry instrumented applications.
For the purpose of this guide, it’s recommended to use one of the following ways below:
Monitor existing applications
Instrumenting Java app using Elastic APM Java Agent:
Let’s go through an example for Java.
We recommend following the steps to download the latest Java agent and add it to your existing java application.
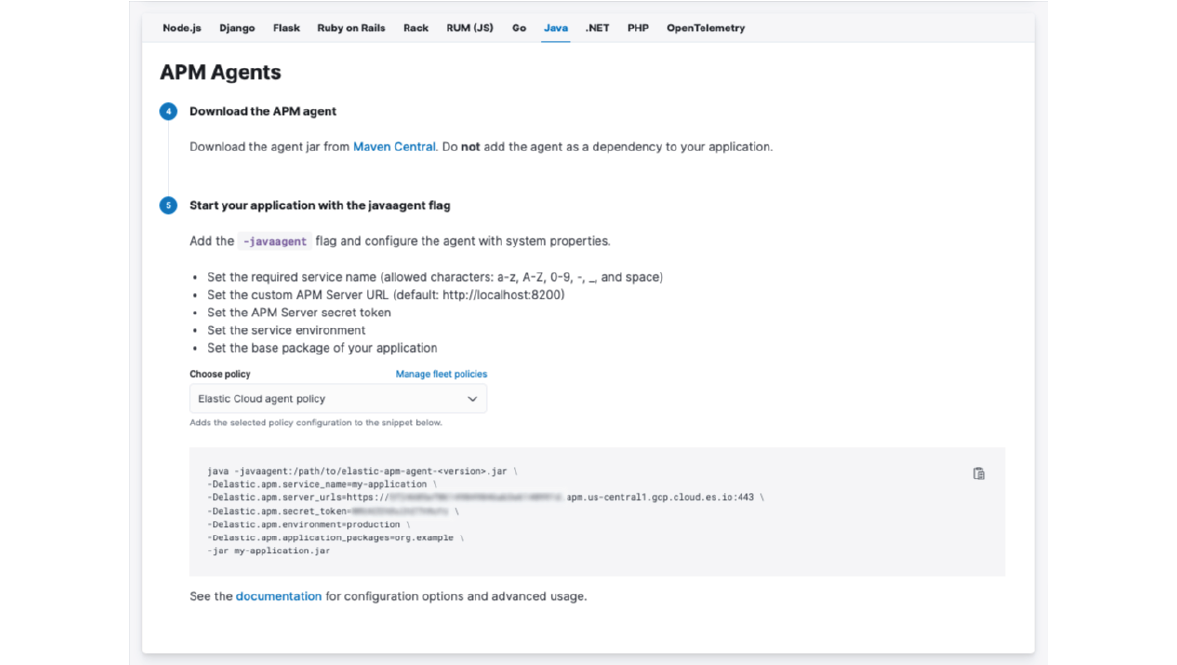
Copy the code snippet within the cloud console to start your java application with the necessary configuration for Elastic APM.
For alternative configuration options, you can check out the documentation for the relevant code snippets.
Connect existing Otel instrumented application(s) to Elastic
If you want to instrument your application with OpenTelemetry and see Distributed Tracing in Elastic APM, just follow the instructions in the OpenTelemetry documentation.
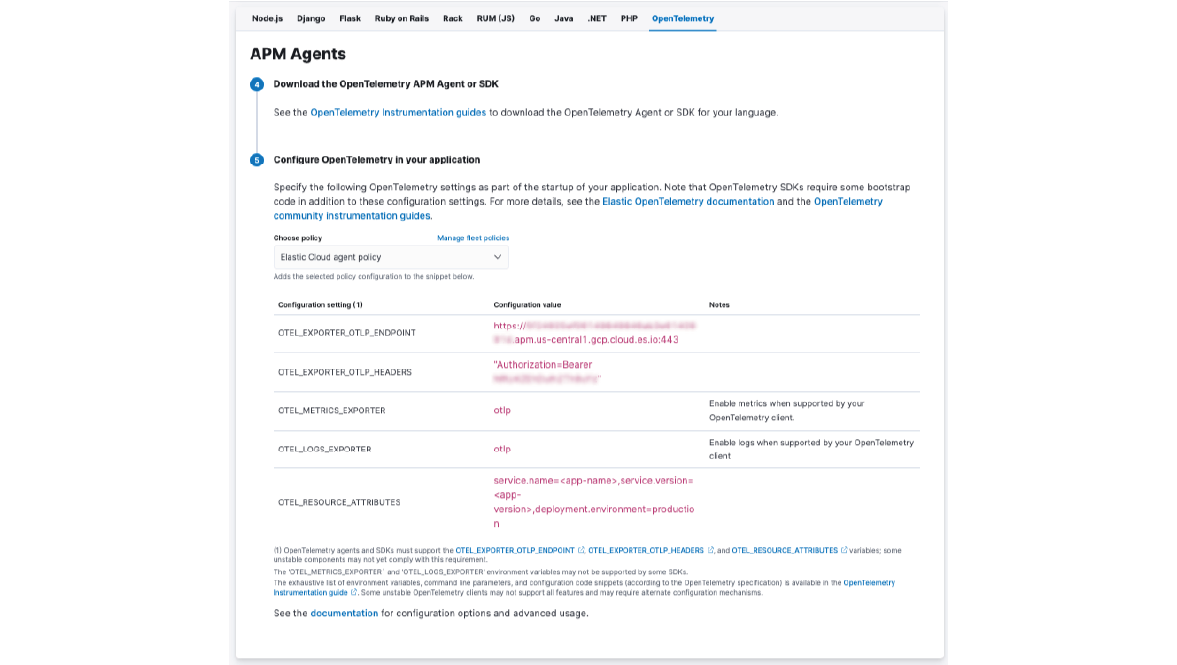
Run a preconfigured demo environment locally
Run OpenTelemetry (OTel) demo locally using Kubernetes or Docker
If you don’t have an application instrumented with OpenTelemetry, Elastic has forked the OTel demo. Just follow the instructions on the Github page, and connect the application to Elastic APM Server.
Check out this blog for more guidance if you are using K8S. Once you go through the blog and follow it, if you see this, then the Otel Collector is sending data into Elastic.
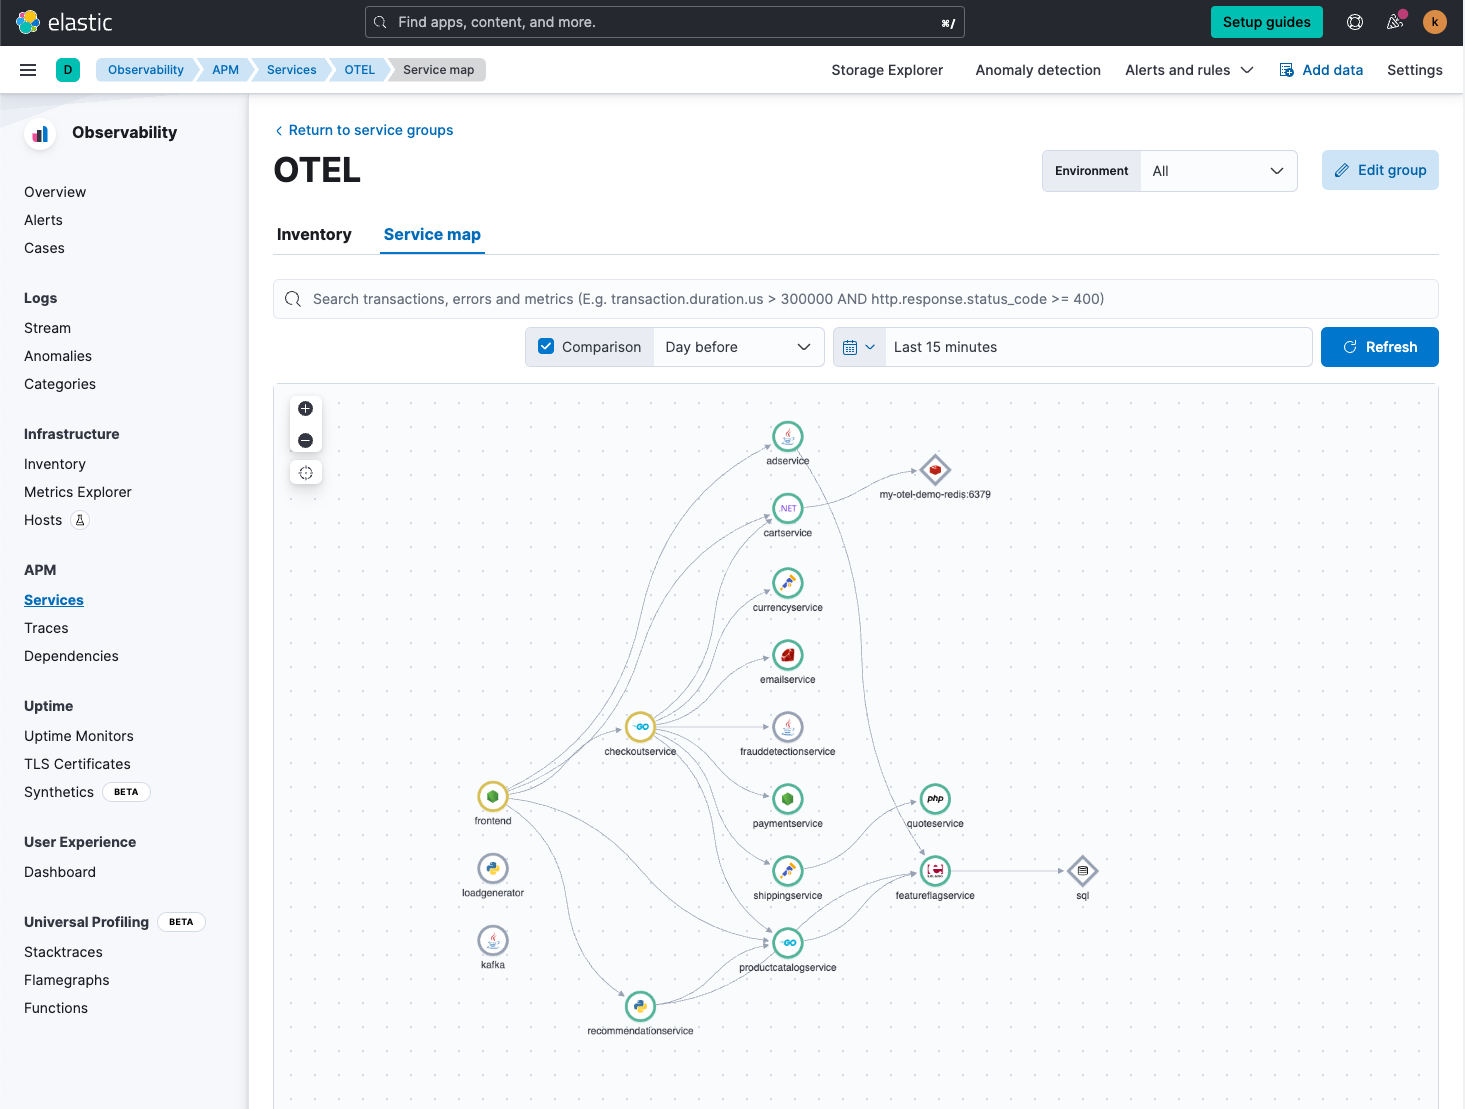
Working with Elastic Observability
Search for the root cause with interactive dashboards in Kibana
Kibana allows you to analyze your data with interactive dashboards to derive insights, automate workflows, find anomalies and trends, and more. Check out the video below to get more familiar with Kibana so that can customize or create your own dashboards.
Analyze data in APM UI
Issues can happen intermittently and are often complex. To find the root cause, learn how APM correlations in Elastic Observability helps you find solutions faster.
Now let’s dive in to learn how you can analyze your application performance within Kibana.
Anomaly detection, alerts, and more
Lastly, take advantage of anomaly detection, alerts, and more to make life easier.
Next steps
Thanks for taking the time to collect and analyze logs with Elastic Cloud. If you’re new to Elastic, be sure to spin up a free 14-day trial.
Also, as you begin your journey with Elastic, understand some operational, security, and data components you should manage as a user when you deploy across your environment.
Ready to get started? Spin up a free 14-day trial on Elastic Cloud.