Create an index pattern
editCreate an index pattern
editKibana requires an index pattern to access the Elasticsearch data that you want to explore. An index pattern selects the data to use and allows you to define properties of the fields.
An index pattern can point to a specific index, for example, your log data from yesterday, or all indices that contain your data. It can also point to a data stream or index alias.
You’ll learn how to:
- Create an index pattern
- Explore and configure the data fields
- Set the default index pattern
- Delete an index pattern
Before you begin
edit-
To access the Index Patterns view, you must have the Kibana privilege
Index Pattern Management. To create an index pattern, you must have the Elasticsearch privilegeview_index_metadata. To add the privileges, open the main menu, then click Stack Management > Roles. - If a read-only indicator appears in Kibana, you have insufficient privileges to create or save index patterns. The buttons to create new index patterns or save existing index patterns are not visible. For more information, refer to Granting access to Kibana.
Create an index pattern
editIf you collected data using one of the Kibana ingest options, uploaded a file, or added sample data, you get an index pattern for free, and can start exploring your data. If you loaded your own data, follow these steps to create an index pattern.
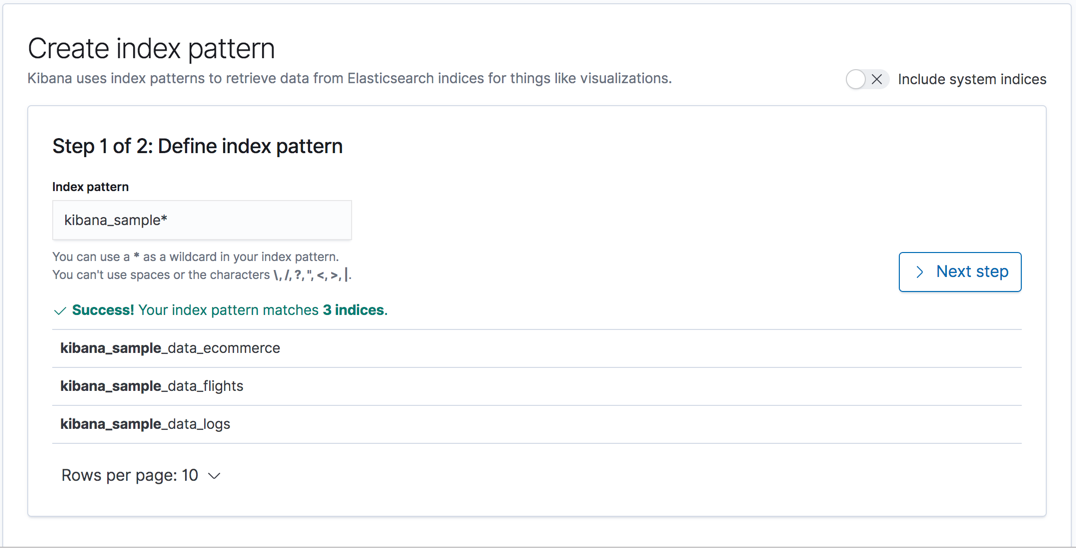
- Open the main menu, then click to Stack Management > Index Patterns.
-
Click Create index pattern.

-
Start typing in the Index pattern field, and Kibana looks for the names of Elasticsearch indices that match your input.
-
Use a wildcard (*) to match multiple indices.
For example, suppose your system creates indices for Apache data
using the naming scheme
filebeat-apache-a,filebeat-apache-b, and so on. An index pattern namedfilebeat-amatches a single source, andfilebeat-*matches multiple data sources. Using a wildcard is the most popular approach. -
Select multiple indices by entering multiple strings,
separated with a comma. Make sure there is no space after the comma.
For example,
filebeat-a,filebeat-bmatches two indices, but not other indices you might have afterwards (filebeat-c). - Use a minus sign (-) to exclude an index, for example, test*,-test3.
-
Use a wildcard (*) to match multiple indices.
For example, suppose your system creates indices for Apache data
using the naming scheme
- Click Next step.
-
If Kibana detects an index with a timestamp, expand the Time field menu, and then specify the default field for filtering your data by time.
If your index doesn’t have time-based data, or if you don’t want to select the default timestamp field, choose I don’t want to use the Time Filter.
If you don’t set a default time field, you will not be able to use global time filters on your dashboards. This is useful if you have multiple time fields and want to create dashboards that combine visualizations based on different timestamps.
-
Click Create index pattern.
Kibana is now configured to use your Elasticsearch data.
- Select this index pattern when you search and visualize your data.
Create an index pattern for rolled up data
editAn index pattern can match one rollup index. For a combination rollup index pattern with both raw and rolled up data, use the standard notation:
rollup_logstash,kibana_sample_data_logs
For an example, refer to Create and visualize rolled up data.
Create an index pattern that searches across clusters
editIf your Elasticsearch clusters are configured for cross-cluster search, you can create an index pattern to search across the clusters of your choosing. Use the same syntax that you’d use in a raw cross-cluster search request in Elasticsearch:
<cluster-names>:<pattern>
For example, to query Logstash indices across two Elasticsearch clusters
that you set up for cross-cluster search, named cluster_one and cluster_two,
use this for your index pattern:
cluster_one:logstash-*,cluster_two:logstash-*
You can use wildcards in your cluster names
to match any number of clusters. For example, to search Logstash indices across
clusters named cluster_foo, cluster_bar, and so on, create this index pattern:
cluster_*:logstash-*
To query across all Elasticsearch clusters that have been configured for cross-cluster search, use a standalone wildcard for your cluster name in your index pattern:
*:logstash-*
You can use exclusions to exclude indices that might contain mapping errors.
To match indices starting with logstash-, and exclude those starting with logstash-old from
all clusters having a name starting with cluster_, you can use cluster_*:logstash-*,cluster*:logstash-old*.
To exclude a cluster, use cluster_*:logstash-*,cluster_one:-*.
Once an index pattern is configured using the cross-cluster search syntax, all searches and aggregations using that index pattern in Kibana take advantage of cross-cluster search.
Explore and configure the data fields
editTo explore and configure the data fields in your index pattern, open the main menu, then click Stack Management > Index Patterns. Each field has a mapping, which indicates the type of data the field contains in Elasticsearch, such as strings or boolean values. The field mapping also determines how you can use the field, such as whether it can be searched or aggregated.
When a new field is added to the index, the index pattern field list is updated the next time the index pattern is loaded, for example, when you load the page or move between Kibana apps.

Format the display of common field types
editWhenever possible, Kibana uses the same field type for display as Elasticsearch. However, some field types that Elasticsearch supports are not available in Kibana. Using field formatters, you can manually change the field type in Kibana to display your data the way you prefer to see it, regardless of how it is stored in Elasticsearch.
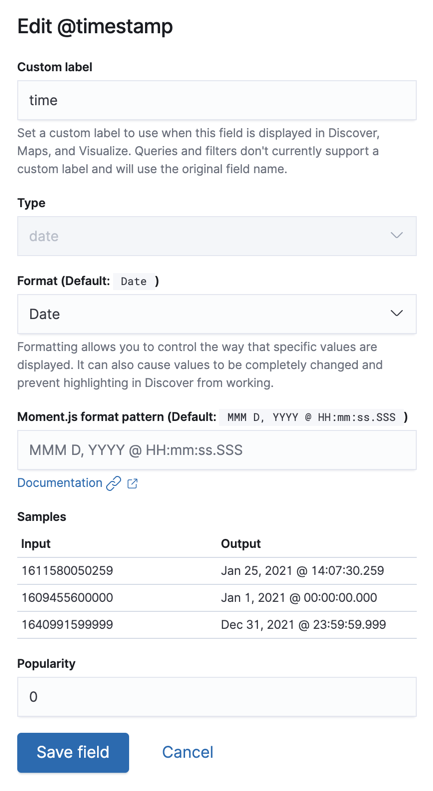
For example, if you store date values in Elasticsearch, you can use a Kibana field formatter to change the display to mm/dd/yyyy format. Kibana has field formatters for strings, dates, geopoints, and numbers.
To customize the displayed field name provided by Elasticsearch, you can use Custom Label .
A popularity counter keeps track of the fields you use most often. The top five most popular fields and their values are displayed in Discover.
To edit the field display, click the edit icon
(![]() ) in the index pattern detail view.
) in the index pattern detail view.

Set the default index pattern
editThe first index pattern you create is automatically designated as the default pattern, but you can set any index pattern as the default. The default index pattern is automatically selected when you first open Discover or create a visualization from scratch.
- In Index patterns, click the index pattern name.
-
Click the star icon (
 ).
).
Delete an index pattern
editThis action removes the pattern from the list of saved objects in Kibana. You will not be able to recover field formatters, scripted fields, source filters, and field popularity data associated with the index pattern. Deleting an index pattern does not remove any indices or data documents from Elasticsearch.
Deleting an index pattern breaks all visualizations, saved searches, and other saved objects that reference the pattern.
- In Index patterns, click the index pattern name.
-
Click the delete icon (
 ).
).
What’s next
edit- Learn about scripted fields and how to create data on the fly.